If you're hunting for a high-probability zone where crypto price action often makes pivotal decisions, look no further than the Golden Pocket — that mystical Fibonacci retracement area nestled between 61.8% and 65%. This narrow zone isn't just math; it's a reflection of natural harmony found in everything from seashells to galaxies, now imprinted into the fabric of financial markets.
Why does the Golden Pocket matter? Because it's where the tug-of-war between buyers and sellers often reaches its climax. Picture it as the market's final checkpoint before a potential revival or collapse. This area frequently aligns with previous support, resistance, or liquidity zones where big players and algorithms lurk, waiting to tip the scales. In volatile arenas like crypto, Bitcoin and Ethereum have repeatedly found their fate influenced here — bouncing from this zone only to surge or falter depending on the broader market forces at play.
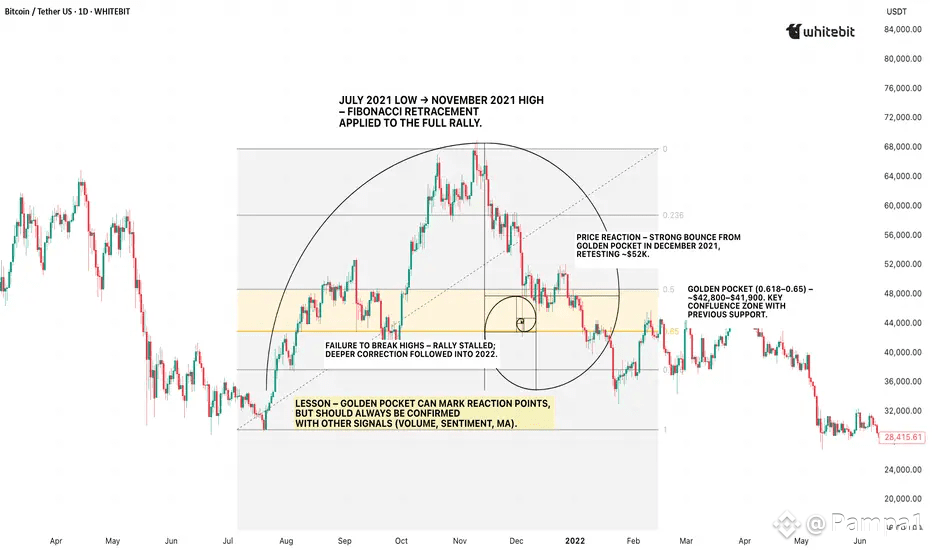
But beware: the Golden Pocket is no magic switch for guaranteed reversals. It’s best wielded as one tool among many — blending Fibonacci levels with volume analysis, trendlines, and momentum indicators. In September 2021, Bitcoin’s pullback landed right inside this zone near $42,000 after rallying from $29,000, briefly pausing before trying for new highs — a perfect case study of the zone’s power yet also its limits.
For traders aiming to make the most of Fibonacci, mastering the Golden Pocket on daily charts and coupling it with other signals offers a potent edge. Whether entering retracements or spotting exhaustion points, it stays one of the smartest places to watch for market decisions—until it’s time to move on.
In the end, the Golden Pocket isn’t about certainty but probability — a timeless market secret wrapped in nature’s perfect ratio, waiting for the savvy trader to unlock its potential. Trade smart, combine tools, and respect this Fibonacci sweet spot to trade like a boss.