In short
In the past 24 hours, 553,000 OKB tokens worth $58 million entered the exchange, forming a heavy sell wall.
$1.1 million in long positions is situated near key support areas, which could increase the likelihood of a chain sell-off if prices fall.
Although the OKB price reached a historical high, the weekly CMF still shows lower peaks, indicating that buying pressure is diminishing over a longer period.

OKX's native token OKB surged 160% in just 24 hours, briefly breaking the $135 mark, setting a new all-time high. The price rise of OKB is backed by a series of positive news, including quarterly token burns, reduced circulating supply, and speculation about a potential IPO for OKX.
However, on the surface, three key signals indicate that the foundation of this rebound may be much weaker than what the overall data suggests.
Forex inflow indicates a pressure of $58 million!
Nansen data shows that in the past 24 hours, 553,000 OKB tokens valued at approximately $58 million have entered the exchange at a price of $106.19 (the price at the time of writing). The exchange balance surged by 36.03%, potentially causing significant selling pressure.
The significant surge in exchange supply typically indicates that the market is preparing to sell off, especially after a market rebound. However, there is also a glimmer of hope.
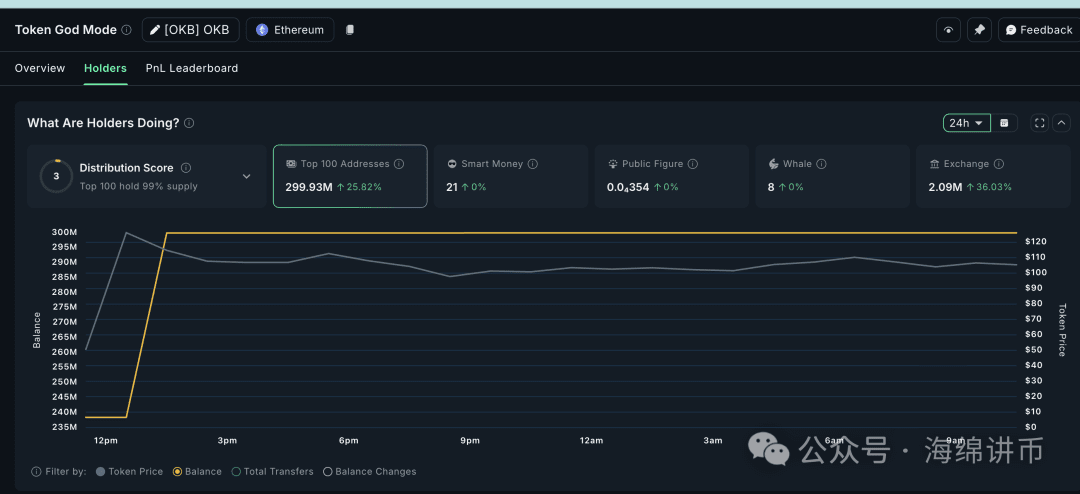
While the fund inflow to the exchange shows a wave of potential sell-off, a group of people is doing the opposite. The top 100 OKB addresses now hold 299.93 million OKB tokens—this is after their holdings increased by 25%.
At this scale, their net increase amounts to approximately 59.98 million OKB, far exceeding the 553,000 OKB that entered the exchange in the past 24 hours. This discrepancy indicates that whales are still actively buying, attempting to absorb selling pressure before prices decline further. However, the accumulation by whales does not necessarily guarantee an immediate price increase; this buying could represent a long-term strategy rather than a short-term defense.
Liquidation clusters intensify downward pressure.
BingX's liquidation heatmap shows that $1.1 million in long positions is concentrated near $92.6, with a small amount of positions slightly above $100. If the fund inflow from the exchange begins to push the prices down, these levels may trigger a series of forced sell-offs.
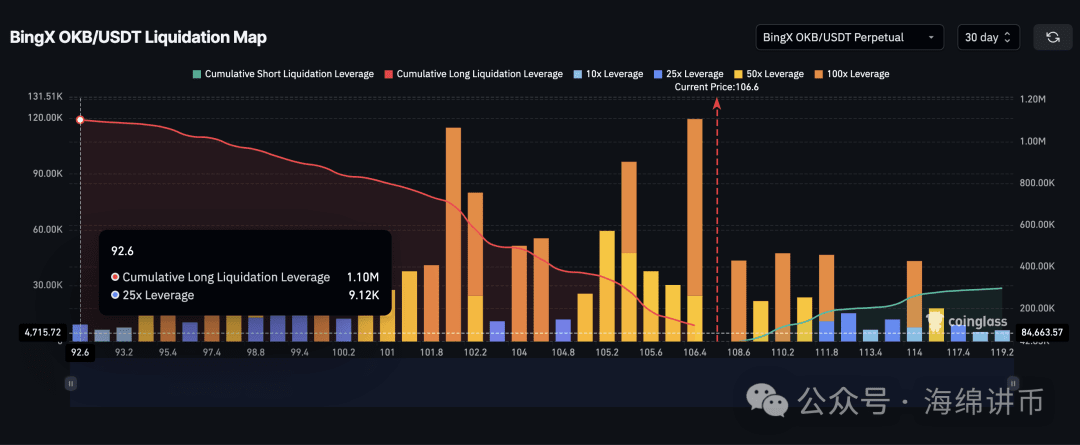
Liquidation is self-reinforcing; falling to the first cluster may trigger sell orders, pushing the price up to the next cluster, thus exacerbating losses. Given OKB's recent vertical movement, the current price is not far from the first major cluster, which increases the likelihood of significant liquidations if momentum reverses.
The weekly price chart of OKB and CMF indicate that potential strength is weakening.
Unlike the volatile daily fluctuations, the price trend of OKB tends to develop over a longer time frame, making the weekly chart a better tool for identifying sustainable trends.
The OKB price chart shows that after failing to break through the $142 barrier, the price has stagnated. However, the current price is focusing on the support level of $102. Falling below this support level will trigger long position liquidations, as the main resistance is currently between $106 and $102.
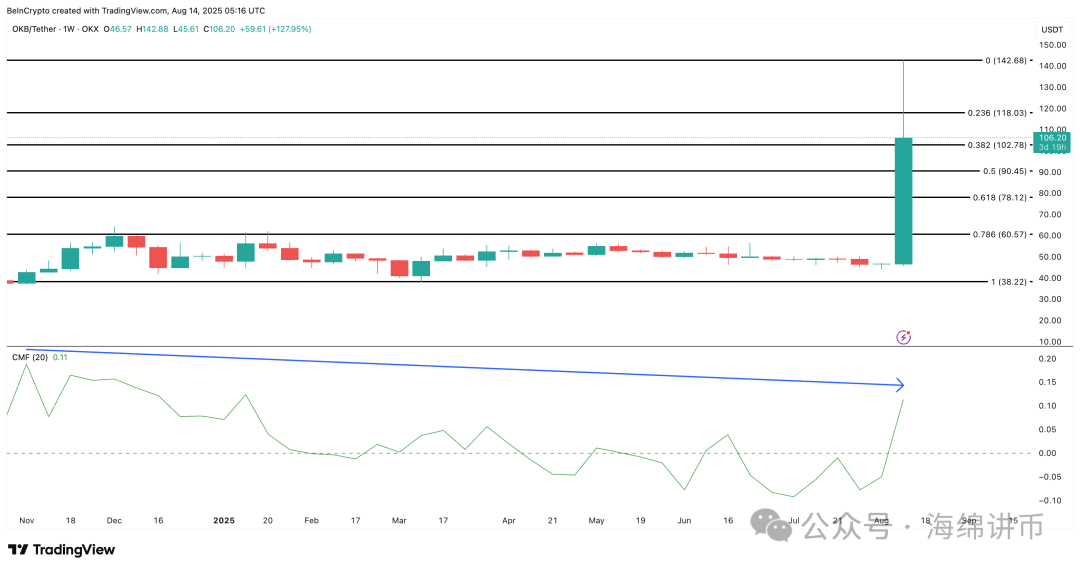
Overlaying the Chaikin Money Flow (CMF) reveals that even when the price reached record levels, its peak was lower than the level in November 2024.
This divergence indicates that the capital inflow driving the latest rally is weakening, suggesting that this rally may have been driven purely by news factors rather than buying pressure. Combined with the sell wall and liquidation clusters, the weak trend in CMF confirms that the upward momentum may be fading.
In addition, if the level of $102 is broken, then according to the weekly chart, the next key support levels are at $90 and $78. Reaching these two levels will confirm the notion of a 'free fall'. Moreover, since we are tracking the OKB price on a weekly chart, the anticipated decline or even consolidation may progress slowly.
However, if the OKB price successfully recovers the resistance level of $118, and the fund inflow from the exchange slows down while top addresses continue to accumulate, the short-term bearish assumption will lose momentum. At that time, the price may retest the level of $142.

