
Early holders typically control a significant amount of token supply, and their buying and selling decisions are crucial to market trends. Understanding the behavior patterns of early holders can provide traders with important insights into market trends and potential price pullbacks/tops.
This content is translated from Antonio Manrique de Lara Martín's (Tracking Early Token Holder Behavior) by Run Finance · Web 3.0 Reading Room.
This article analyzes four key indicators: 'Early Holder Balance', 'Herfindahl Index', 'Net Unrealized Profit/Loss (NUPL)', and 'Cost Basis Distribution Heatmap (CBD)' to help traders understand methods to predict price tops and effectively manage risks.
Four Key Indicators
Early Holder Balance
Herfindahl Index
Net Unrealized Profit/Loss (NUPL)
Cost Basis Distribution Heatmap (CBD)
By examining the same phenomenon from multiple angles, traders can more accurately predict market turns and optimize exit timing.
1. Early Holder Balance
A direct method to assess the influence of early holders is to track changes in their holding balances. Early holders typically accumulate tokens at low price points. As assets appreciate, some holders begin to sell, increasing market selling pressure and often triggering price pullbacks. Tracking the evolution of their holdings can reveal trends of large-scale profit-taking, assisting in predicting pullbacks.
Its operating mechanism
Balance Dips: Early holders selling will lead to a reduction in their total holdings. If this phenomenon coincides with price peaks, it indicates significant selling pressure, possibly marking a top formation.
Price Impact: Due to controlling a large supply, early holders selling can cause sharp price drops.
Chart Insights: Monitoring balance changes can identify trends of large-scale profit-taking, assisting in predicting market pullbacks.
Figure 1↓ shows how early SHIB holders accumulated tokens at low prices (once accounting for over 20% of total supply) and sold off in large quantities after the price surged, causing a sharp price drop.
The blue line in the chart represents SHIB's holdings, and the yellow line shows the percentage of early holders in the total supply, clearly displaying the evolution of their relative holdings and the market impact of their selling activities.
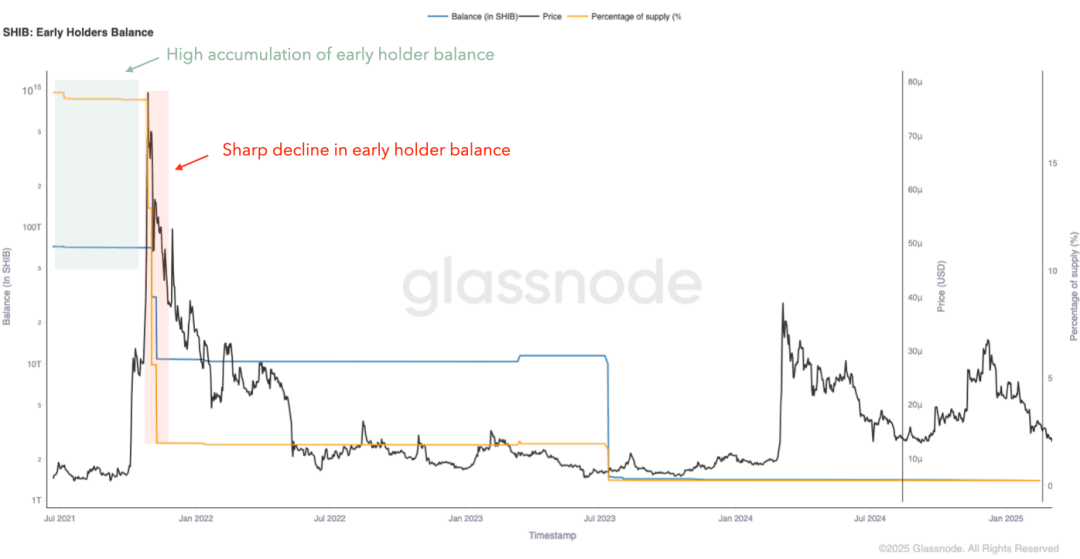
Figure 1. Early Holder Balance of SHIB
To maintain consistency in analyzing the same asset, subsequent indicators in this article will focus on SHIB. However, before in-depth analysis, horizontally comparing the early holder balances of different tokens is quite valuable, as it allows observation of behavioral differences and their potential impact on prices.
Figure 2↓ presents the strategic sell-off of early APW holders at key price peaks:
First Sell-off (left of the chart): The yellow line representing the proportion of early holder holdings drops sharply, indicating a large-scale sell-off near the first price peak.
Accumulation Phase (in the chart): After the first sell-off, the remaining early holders' activity remains subdued.
Second Sell-off (right of the chart): When the price rises again, early holders sell off a large portion of their holdings after increasing their positions, causing their supply proportion to drop sharply.
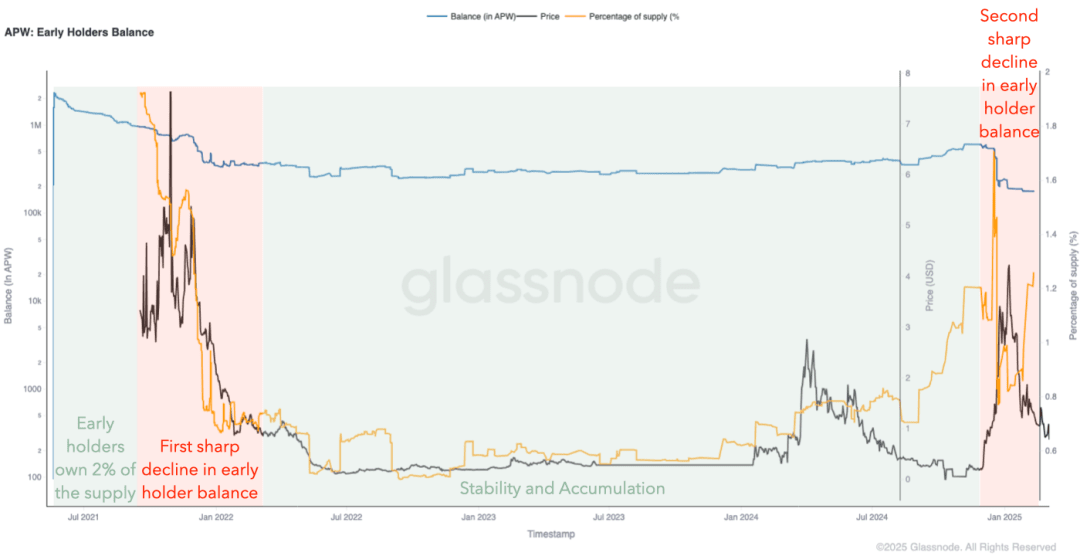
Figure 2. Early Holder Balance of APW
Figure 3↓ shows the gradual decrease in holdings of early TSUKA holders, differing from previous sudden sell-offs:
Holdings steadily decline to avoid sharp price drops.
More controllable sell-offs bring better price stability.
Selling pressure dispersion reduces market impact.
This indicates that they adopted an orderly exit strategy, effectively mitigating extreme volatility.
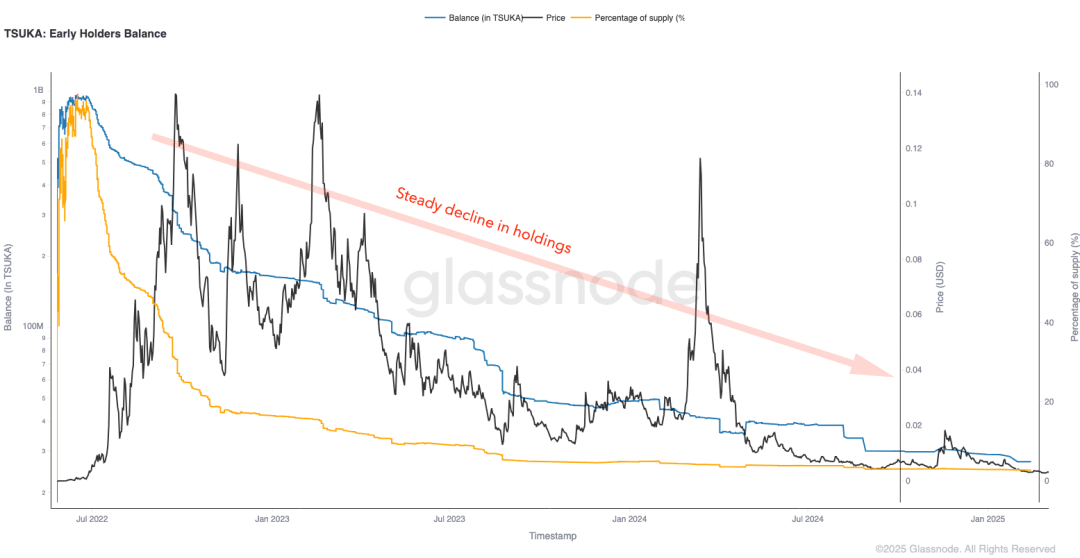
Figure 3. Early Holder Balance of TSUKA
In Figure 4↓, early PEPE holders sold off most of their tokens immediately after the first price surge (the left-end orange line drops sharply):
Early Exit: Most tokens are sold off in the early stages, leading to sharp price drops but also avoiding large-scale selling pressure later (similar to the SHIB model).
Price Discovery: After early holders exit, the market can price more organically.
Long-term Stability: Due to the absence of subsequent large distributions, price trends are more driven by new demand rather than large holder activity. This model avoids gradual selling pressure, allowing the market to form a fair price without continuous supply shocks.
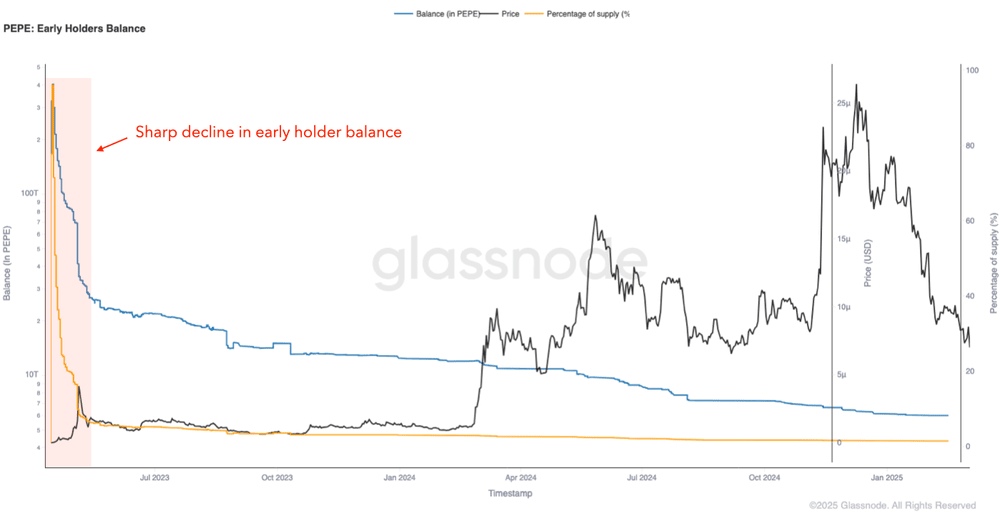
Figure 4. Early Holder Balance of PEPE
2. Monitor the Herfindahl Index
The Herfindahl Index measures market concentration. A high index indicates that a few large holders dominate the market; a low index reflects a more dispersed distribution of tokens.
Its operating mechanism
Impact of Early Holders: In the early stages of token issuance, early holders often concentrate supply, raising the Herfindahl Index.
Market Dynamics: As they sell off, the index declines, reflecting a broader distribution of tokens.
Market Signals: The Herfindahl Index declines in tandem with the early holder balance, indicating that tokens are being distributed to more market participants, suggesting potential profit-taking behavior and market tops.
Figure 5↓ shows the SHIB Herfindahl Index (red line) and price (black line). The sharp drop in the index corresponds to the moments when large holders sold off their holdings, coinciding with price peaks.
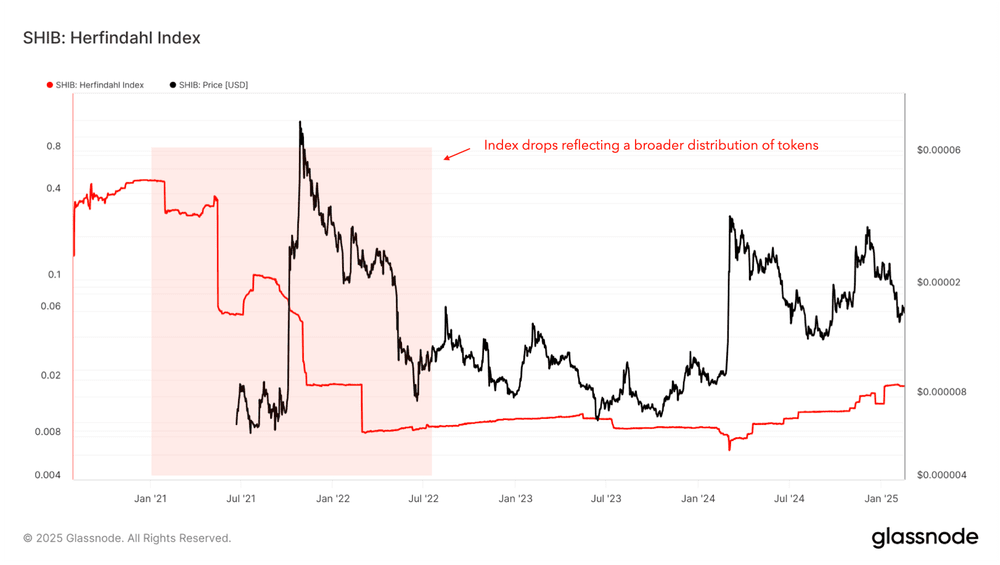
Figure 5. SHIB Herfindahl Index
3. Utilize Net Unrealized Profit/Loss (NUPL)
Net Unrealized Profit/Loss (NUPL) is an on-chain metric that quantifies the unrealized gains and losses of all holders at a specific point in time. As a sentiment indicator, it can detect potential market tops and bottoms based on the profit and loss status of investors.
For early holders, their profit-taking behavior is often reflected in the early peaks of NUPL—since they tend to accumulate at low prices and sell during strong price increases.
Its operating mechanism
Early NUPL Surge → Market Frenzy and Sell-off: High NUPL values appear early in the token lifecycle, indicating that most holders are profiting, often triggering profit-taking by early holders, increasing selling pressure.
Early NUPL Decline → Large Holder Exit: If the token reaches a new high but NUPL begins to decline early, it indicates that early adopters and large holders are selling, leading to a weakening market structure.
Figure 6↓ presents SHIB's NUPL alongside price, showing early high NUPL values coinciding with price peaks, often followed by sell-offs. Pay particular attention to the first price peak (corresponding to the most active phase of early holders, consistent with the balance indicator observations).
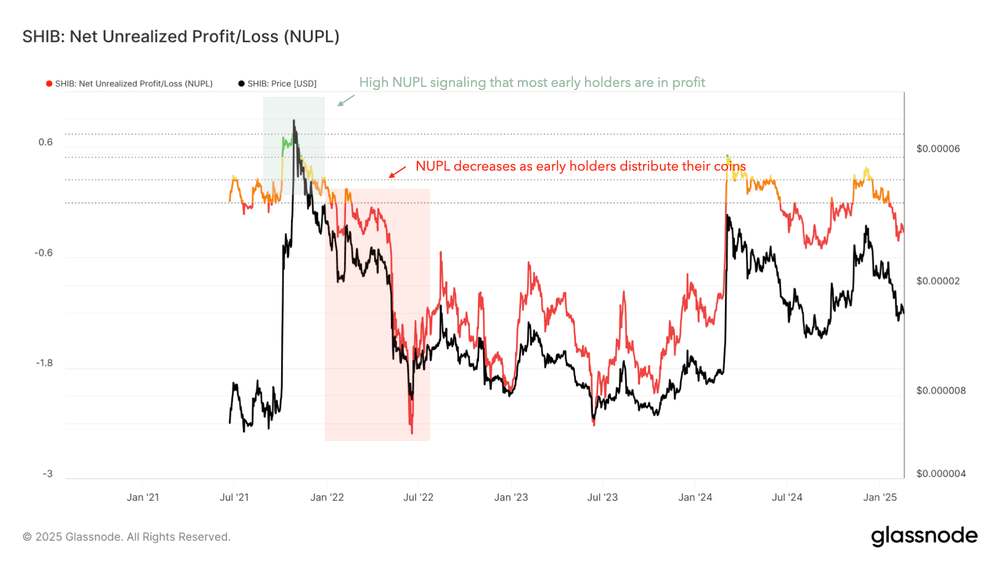
Figure 6. SHIB Net Unrealized Profit/Loss (NUPL)
4. Analyze Cost Basis Distribution (CBD)
The CBD heatmap visualizes the cost of acquiring tokens (cost basis) over time. Focusing on the early stages of the chart can identify the cost basis ranges of early holders, providing insights into their initial accumulation areas and the evolution of their selling behavior.
How to read the CBD heatmap
The vertical axis intervals represent specific cost basis levels, with color intensity reflecting the accumulation amount at that average entry price (blue = low concentration, red = high concentration).
The black line represents the current price.
The interval below the black line is in profit (cost basis below current price).
The interval above the black line is in loss (cost basis above current price). This visualization helps track the evolution of accumulation areas and whether supply is being sold over time.
Its operating mechanism
Low Cost Basis: Early holders accumulate tokens at extremely low prices, forming a low-cost basis accumulation zone (such as the red area in the January 2021 chart).
Accumulation vs. Sell-off: During price increases, holders begin to sell, causing the low-cost range to become sparse (the red area in the chart shifts to blue, indicating the supply accumulated at low prices is being sold off).
Top Identification: If the heatmap shows a large amount of low-cost holdings being sold near price peaks, it may indicate a market top.
Sell-off Prediction: The CBD heatmap not only reveals the selling behavior of early holders but also predicts their selling tendencies—by visualizing their cost basis, it exposes the price levels at which they accumulated tokens. Comparing the current price with these accumulation zones can assess the intensity of their profit-taking motives. If the price is far above the accumulation zones, the probability of early holders selling increases, making the heatmap a powerful tool for predicting potential sell-offs.
Figure 7↓ shows the heatmap indicating SHIB early holders accumulated in the low price zone in January 2021 (red-yellow interval), and sold off in large quantities near the market peak in October-November 2021, reflected in sharp price increases, fading early accumulation, and subsequent declines.
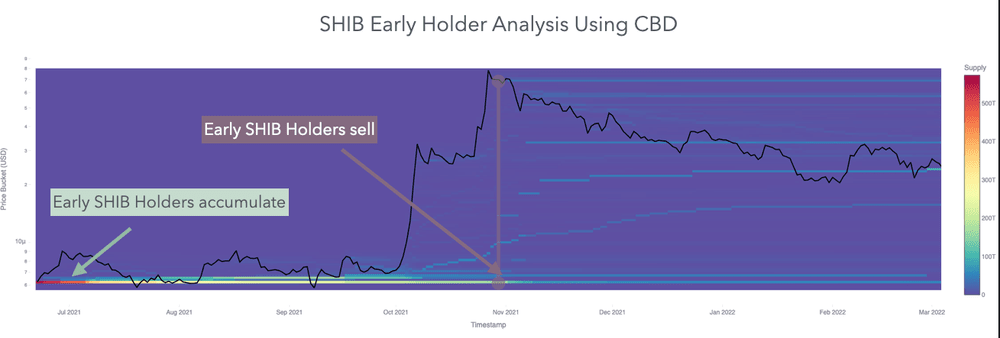
Figure 7. Early Cost Basis Distribution of SHIB
5. Conclusion: Framework Value and Application Strategy
By comprehensively applying the four methods, one can analyze early holder behavior from various dimensions, assisting traders in predicting potential market tops:
Early Holder Balance Analysis: Reveals the timing for early investors to reduce their holdings (often before price declines).
Herfindahl Index: Tracks changes in market concentration to identify large holder exits or ownership dispersion.
Net Unrealized Profit/Loss (NUPL): Assesses market sentiment; high NUPL values indicate early holders have substantial unrealized profits, increasing the likelihood of selling.
Cost Basis Distribution Heatmap (CBD): Precisely locates the profit-taking points of early investors (possibly signaling the end of a price uptrend).
The four types of indicators complement each other, interpreting early holder behavior from different dimensions. When multiple indicators emit coordinated signals, the predictive strength significantly increases, reducing uncertainty and optimizing decision-making.
By integrating these insights, traders can optimize strategies and navigate the early market phase of tokens more confidently.

