
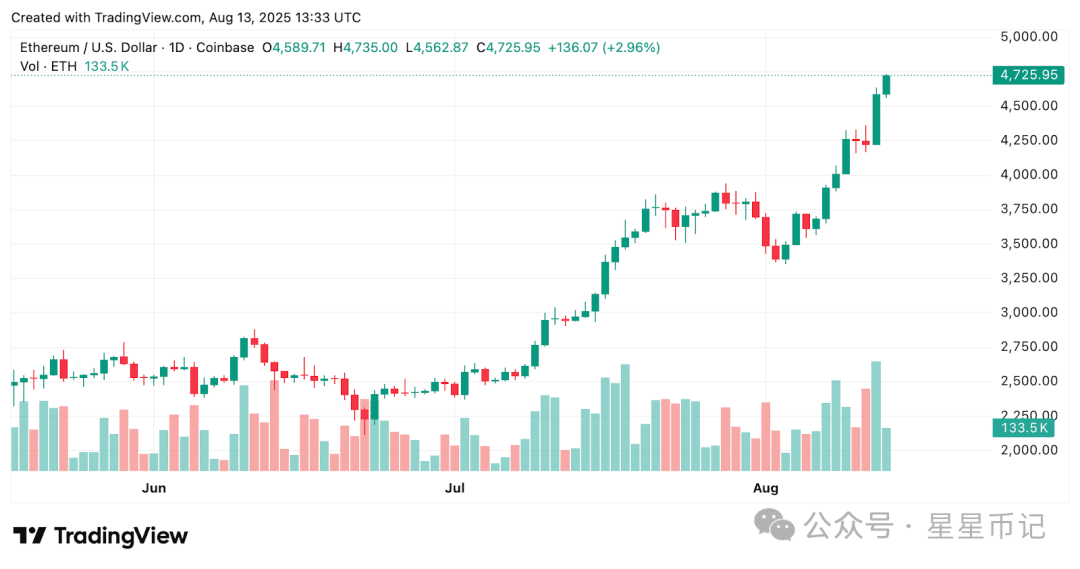
Ethereum is expected to break the $5,000 mark, having surged over 200% from a low of $1,385 four months ago. As of this writing, ETH is trading at $4,680, having briefly touched $4,715. Currently, this price is only 2% lower than the peak in 2021.
Market participants expect gold prices to break $5,000 this weekend, especially as key SMA30 (30-day simple moving average) indicators have shown considerable strength in recent weeks.
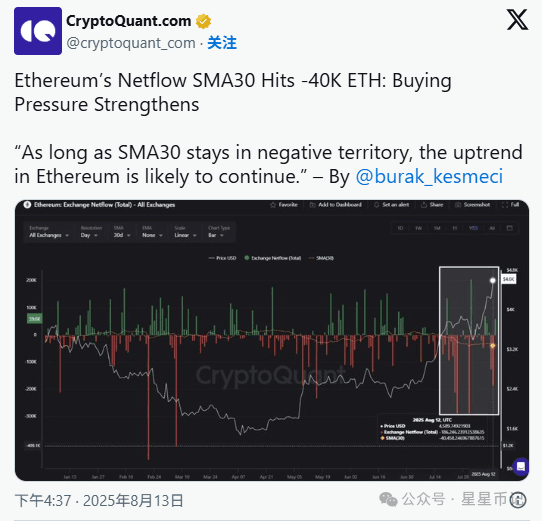
SMA30 shows a daily outflow of 40,000 ETH maintaining bullish control
CryptoQuant data shows that as of August 12, ETH SMA30 recorded -40,000 ETH, averaging a daily outflow of 40,000 ETH over the past month.
To correctly interpret this indicator, a positive net inflow usually indicates potential selling pressure, while a negative value (representing ETH outflows) suggests that buying pressure is dominating.
Retail investors often sell during these periods, while institutional investors tend to accumulate. For instance, Arthur Hayes closed 2,373 ETH (worth $8.32 million) about a week ago when ETH was trading around $3,507, but later repurchased at higher prices.
Meanwhile, the ETF purchased $1 billion worth of Ethereum in a single trading day.
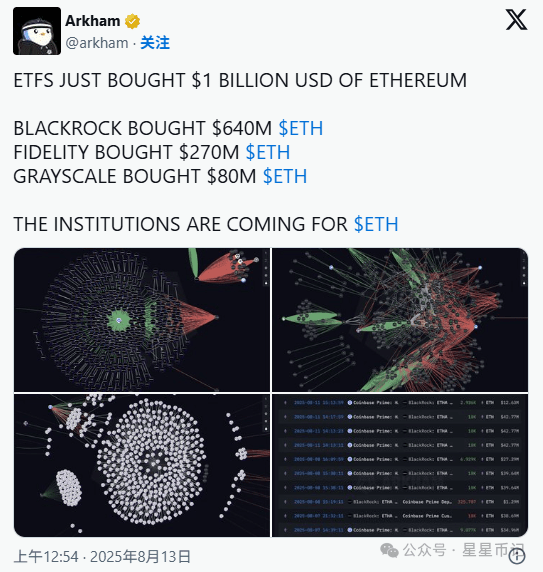
The impact of the ETF is creating buying pressure and pushing prices higher. CryptoQuant analyst 'burakkesmeci' believes that as long as the SMA30 remains in negative territory, Ethereum's upward trend is expected to continue.
The analyst stated: 'Unless we see the market reverse into positive territory, the short-term rebound momentum may remain unchanged.'
There are no signs of a decrease in buying volume and pressure in the short term. Ethereum's market cap has surpassed $567 billion for the first time in four years, with daily trading volume exceeding $60 billion.
Yesterday, an ETH fund company was prepared to acquire $27 billion worth of ETH, equivalent to 40% of all ETH currently held on exchanges.
Currently, five Ethereum fund management companies hold approximately 2,400,000 ETH (worth $5 billion). Tom Lee's BitMine alone has accumulated over $2.9 billion worth of ETH (5% of the total Ethereum supply).
Why ETH is expected to break $5,000 this weekend
A large amount of dry capital preparing to bid for Ethereum could push it into price discovery territory and potentially set new highs above $5,000.
Think about it, when ETH reached $4,868 in 2021, there weren't as many current catalysts. For example, in 2021, neither ETFs nor fund companies were purchasing billions of dollars' worth of ETH weekly.
The U.S. President does not support cryptocurrencies (not to mention holding over $500 million worth of Ethereum like President Trump), and there has been no indication of ETH supply shortages in over-the-counter trading.
These catalysts, combined with the growing dominance of the altcoin market, indicate that Ethereum will continue to outperform the broader market.
Cryptocurrency investor LordofAlts believes Ethereum is poised to break $5,000 this weekend. His analysis suggests that Ethereum is undergoing a familiar pattern: breakout, false breakout, pullback, then surge.
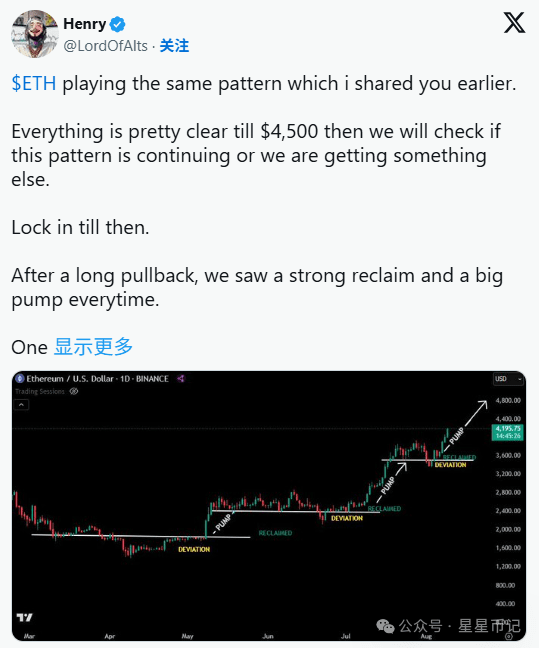
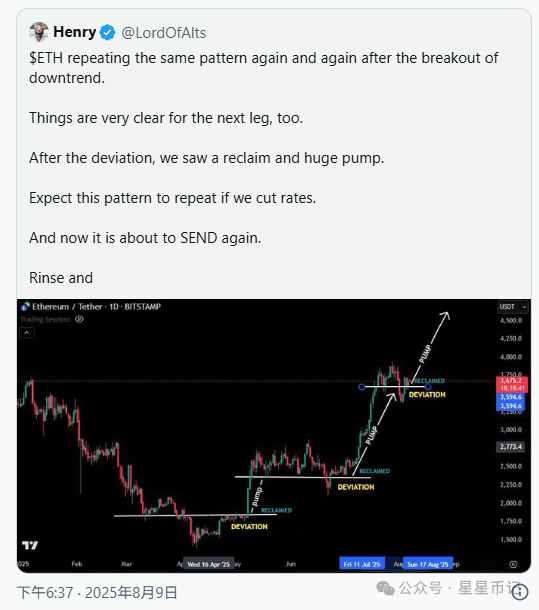
ETH is disrupting the entire market landscape with strong momentum. Now that the shorts have fully covered, what happens next is also clear to you. With just one piece of news, this trend could surge explosively.
Cryptocurrency investor TedPillows also pointed out that ETH is preparing to break out of its four-year trading range. He predicts that Ethereum will reach a target price of $10,000 near the peak of the cycle.
Ethereum Technical Analysis: Elliott Wave 5 points to $5,013
From a technical perspective, the 4-hour ETH/USD chart shows a clear Elliott Wave pattern, seemingly experiencing the fifth wave of the current bullish cycle.
The price recently reached $4,699 in the third wave, experienced a corrective decline in the fourth wave, and is currently moving towards the expected target of $5,013, with broader resistance extending to $5,216.
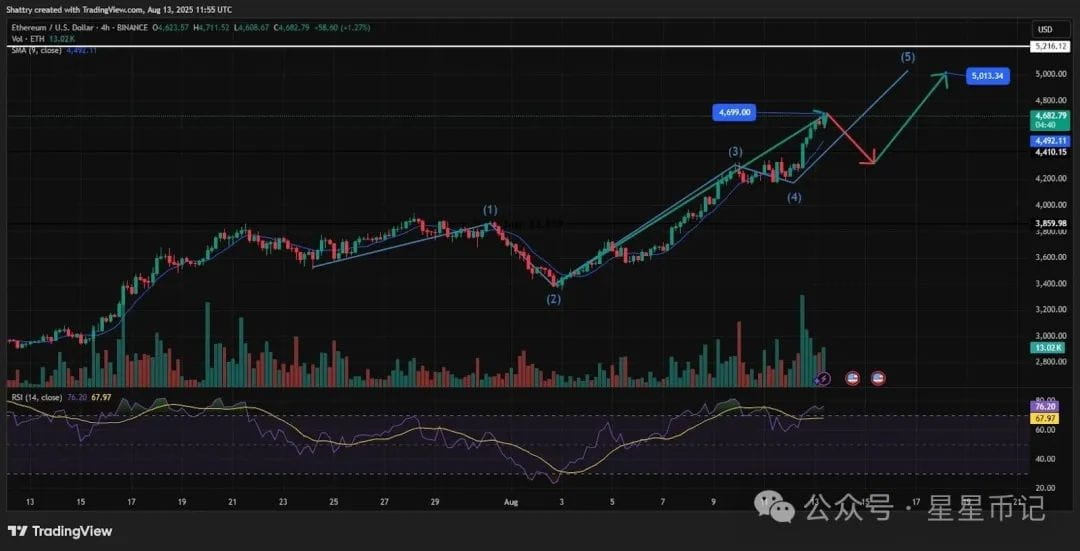
The RSI is currently at a high of 76, indicating that the market is in an overbought state, which may trigger a short-term pullback before the next round of upward movement. The price trend remains well above the 9-period moving average, showing strong upward momentum.
If the current upward momentum loses steam, there is a possibility of a pullback to the support area between $4,492 and $4,410, followed by a continuation of the upward trend.
Overall, the momentum and wave structure indicate a rise in the near term, but there may be a short-term consolidation or pullback before decisively moving towards the $5,000 level.

