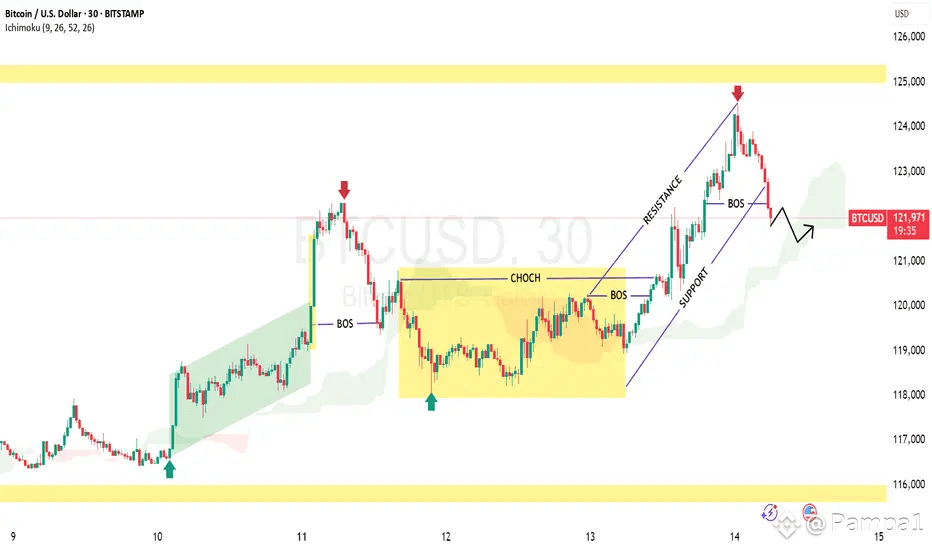
Bitcoin, the flagship cryptocurrency, is showing signs of a potential short-term bearish reversal as it breaks down from a rising channel on the 30-minute chart, according to the latest technical analysis. After a strong uptrend starting August 10, BTC approached a key resistance zone around 124,000–125,000 but failed to breach it decisively, triggering a breakdown in price structure.
### 🔥 Key Technical Insights:
- **Rising Channel Breakdown:** The clear break below the channel support and a confirmed break of structure signal a shift from bullish momentum to bearish pressure.
- **Resistance Rejection:** BTC was rejected near the 124,000–125,000 resistance area, with price now struggling to reclaim this zone, which could act as new resistance.
- **Critical Support Levels:** Immediate support is around 121,000. Should BTC fall below this, the next major support zone lies near 116,000, suggesting a drop that could extend further downward.
- **Ichimoku Cloud:** Although the Ichimoku Cloud provides some support, current downward momentum is strong, indicating sellers currently have the upper hand.
### 📉 What This Means for Traders:
- A bearish continuation is likely if BTC fails to re-enter the rising channel or breaks below 121,000. This scenario could lead to deeper retracements to 119,000 and even 116,000.
- Conversely, a strong rebound above 122,500 with momentum could give bulls a chance to regain control and target a recovery.
- Traders should watch for a possible minor retest of the breakdown zone before betting on further downside moves.
### 🚀 Market Sentiment & Outlook:
Bitcoin has shown impressive strength this year, hitting fresh highs above $124,000 fueled by optimism around monetary easing and continued institutional support. However, this recent breakdown warns of a short-term pause or correction amid profit-taking or supply at resistance. For now, cautious positioning is advised with stops below critical support levels and clear exit plans in play.
### 🧠 Bottom Line:
The BTC/USD 30-minute chart is signaling a *bearish reversal* following a rising channel breakdown. While the macro bullish trend remains intact for the longer term, traders need to respect the short-term technical signals and watch price action closely around the 121,000 support zone. A failure to hold could open the door for a deeper correction, while a reclaim of key resistance could revive the bullish momentum.
Stay alert and manage risk carefully in this potentially volatile phase for Bitcoin. The next few trading sessions will be crucial in defining whether BTC resumes its upward trajectory or enters a corrective phase.
