

XRP is trading at $3.24 as of August 13, 2025, reflecting a 1.8% increase for the day. The asset maintains a daily trading range from $3.20 to $3.32, with a 24-hour trading volume of $9.64 billion and a total market capitalization of $193.41 billion.

XRP
On the 1-hour chart, XRP has experienced a minor correction after peaking at $3.32. The long-wicked candle at this level, along with the sudden spike in red volume, indicates immediate selling pressure. Support is identified at $3.22, with the possibility of further adjustment towards $3.18. Although momentum appears to be temporarily weakening, continued upward trend can only occur if XRP breaks strongly above the resistance level of $3.32.
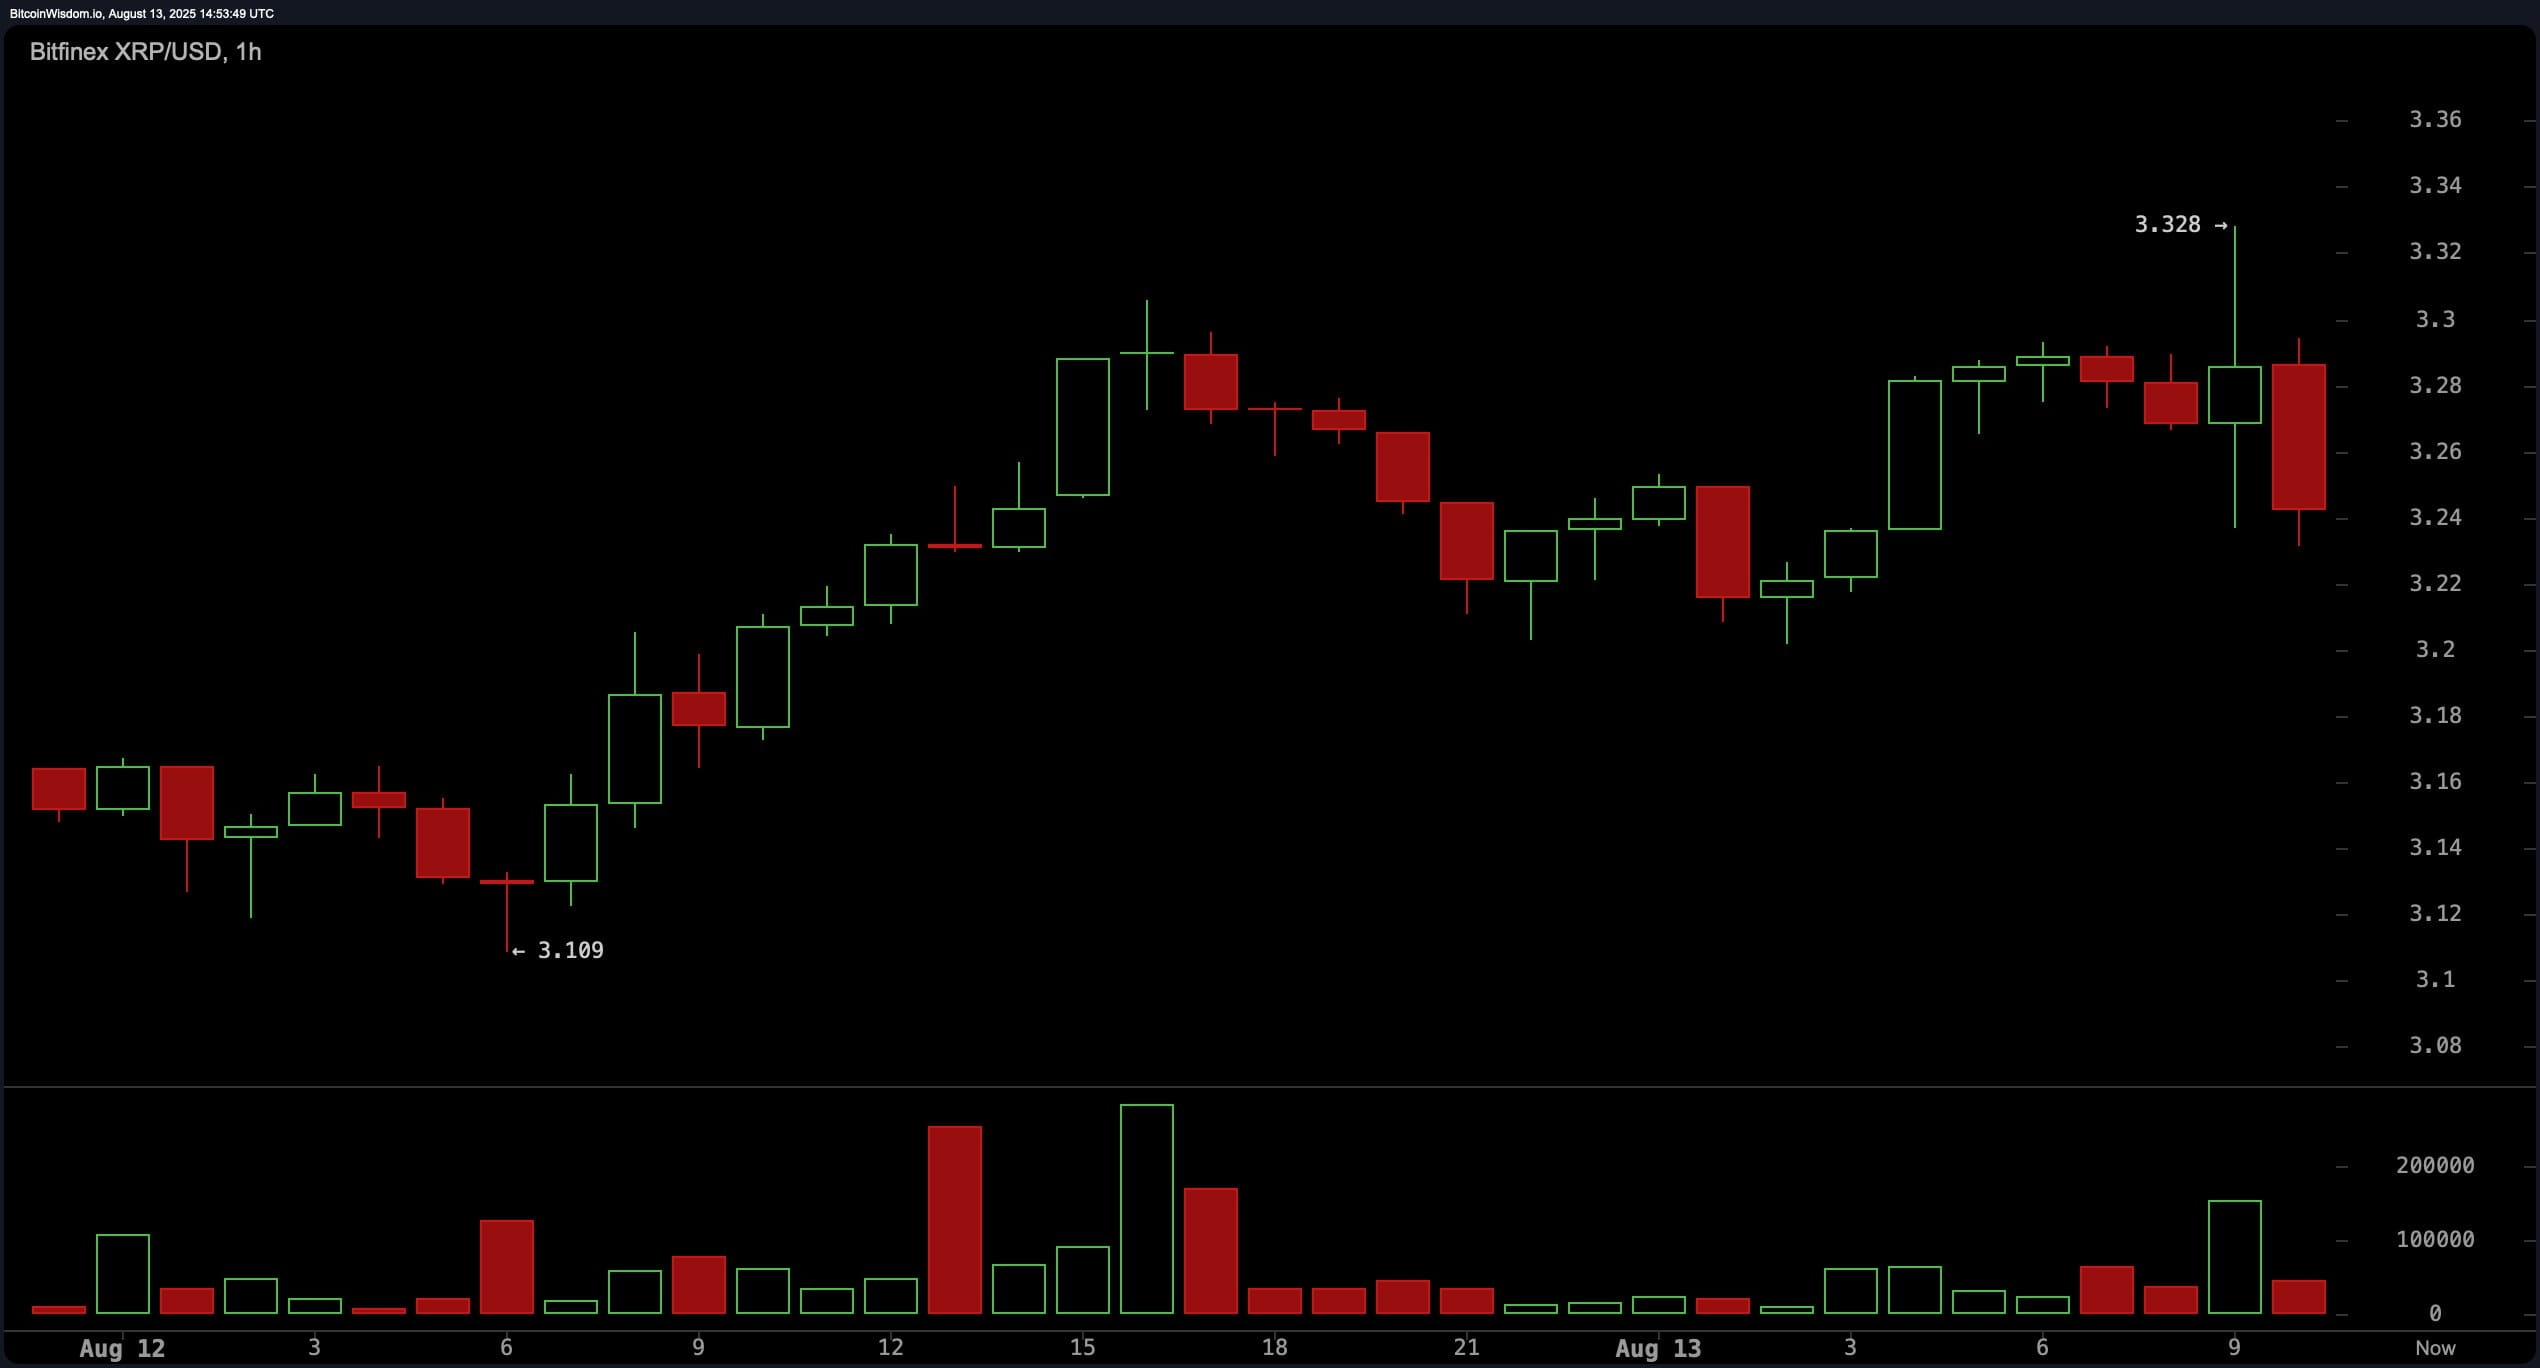
1-hour chart of XRP/USD via Bitfinex on August 13, 2025.
Zooming out to the 4-hour chart, XRP's short-term price action shows a recovery pattern from the recent downtrend. The recovery from the $3.01 area has formed an ascending triangle pattern, bounded between $3.15 and $3.30. Multiple attempts to break above $3.30 have failed, indicating a significant resistance area. A confirmed breakout above this threshold is likely to signal a continuation of the upward trend, while a breakdown below $3.15 could suggest another test at the support level of $3.00.
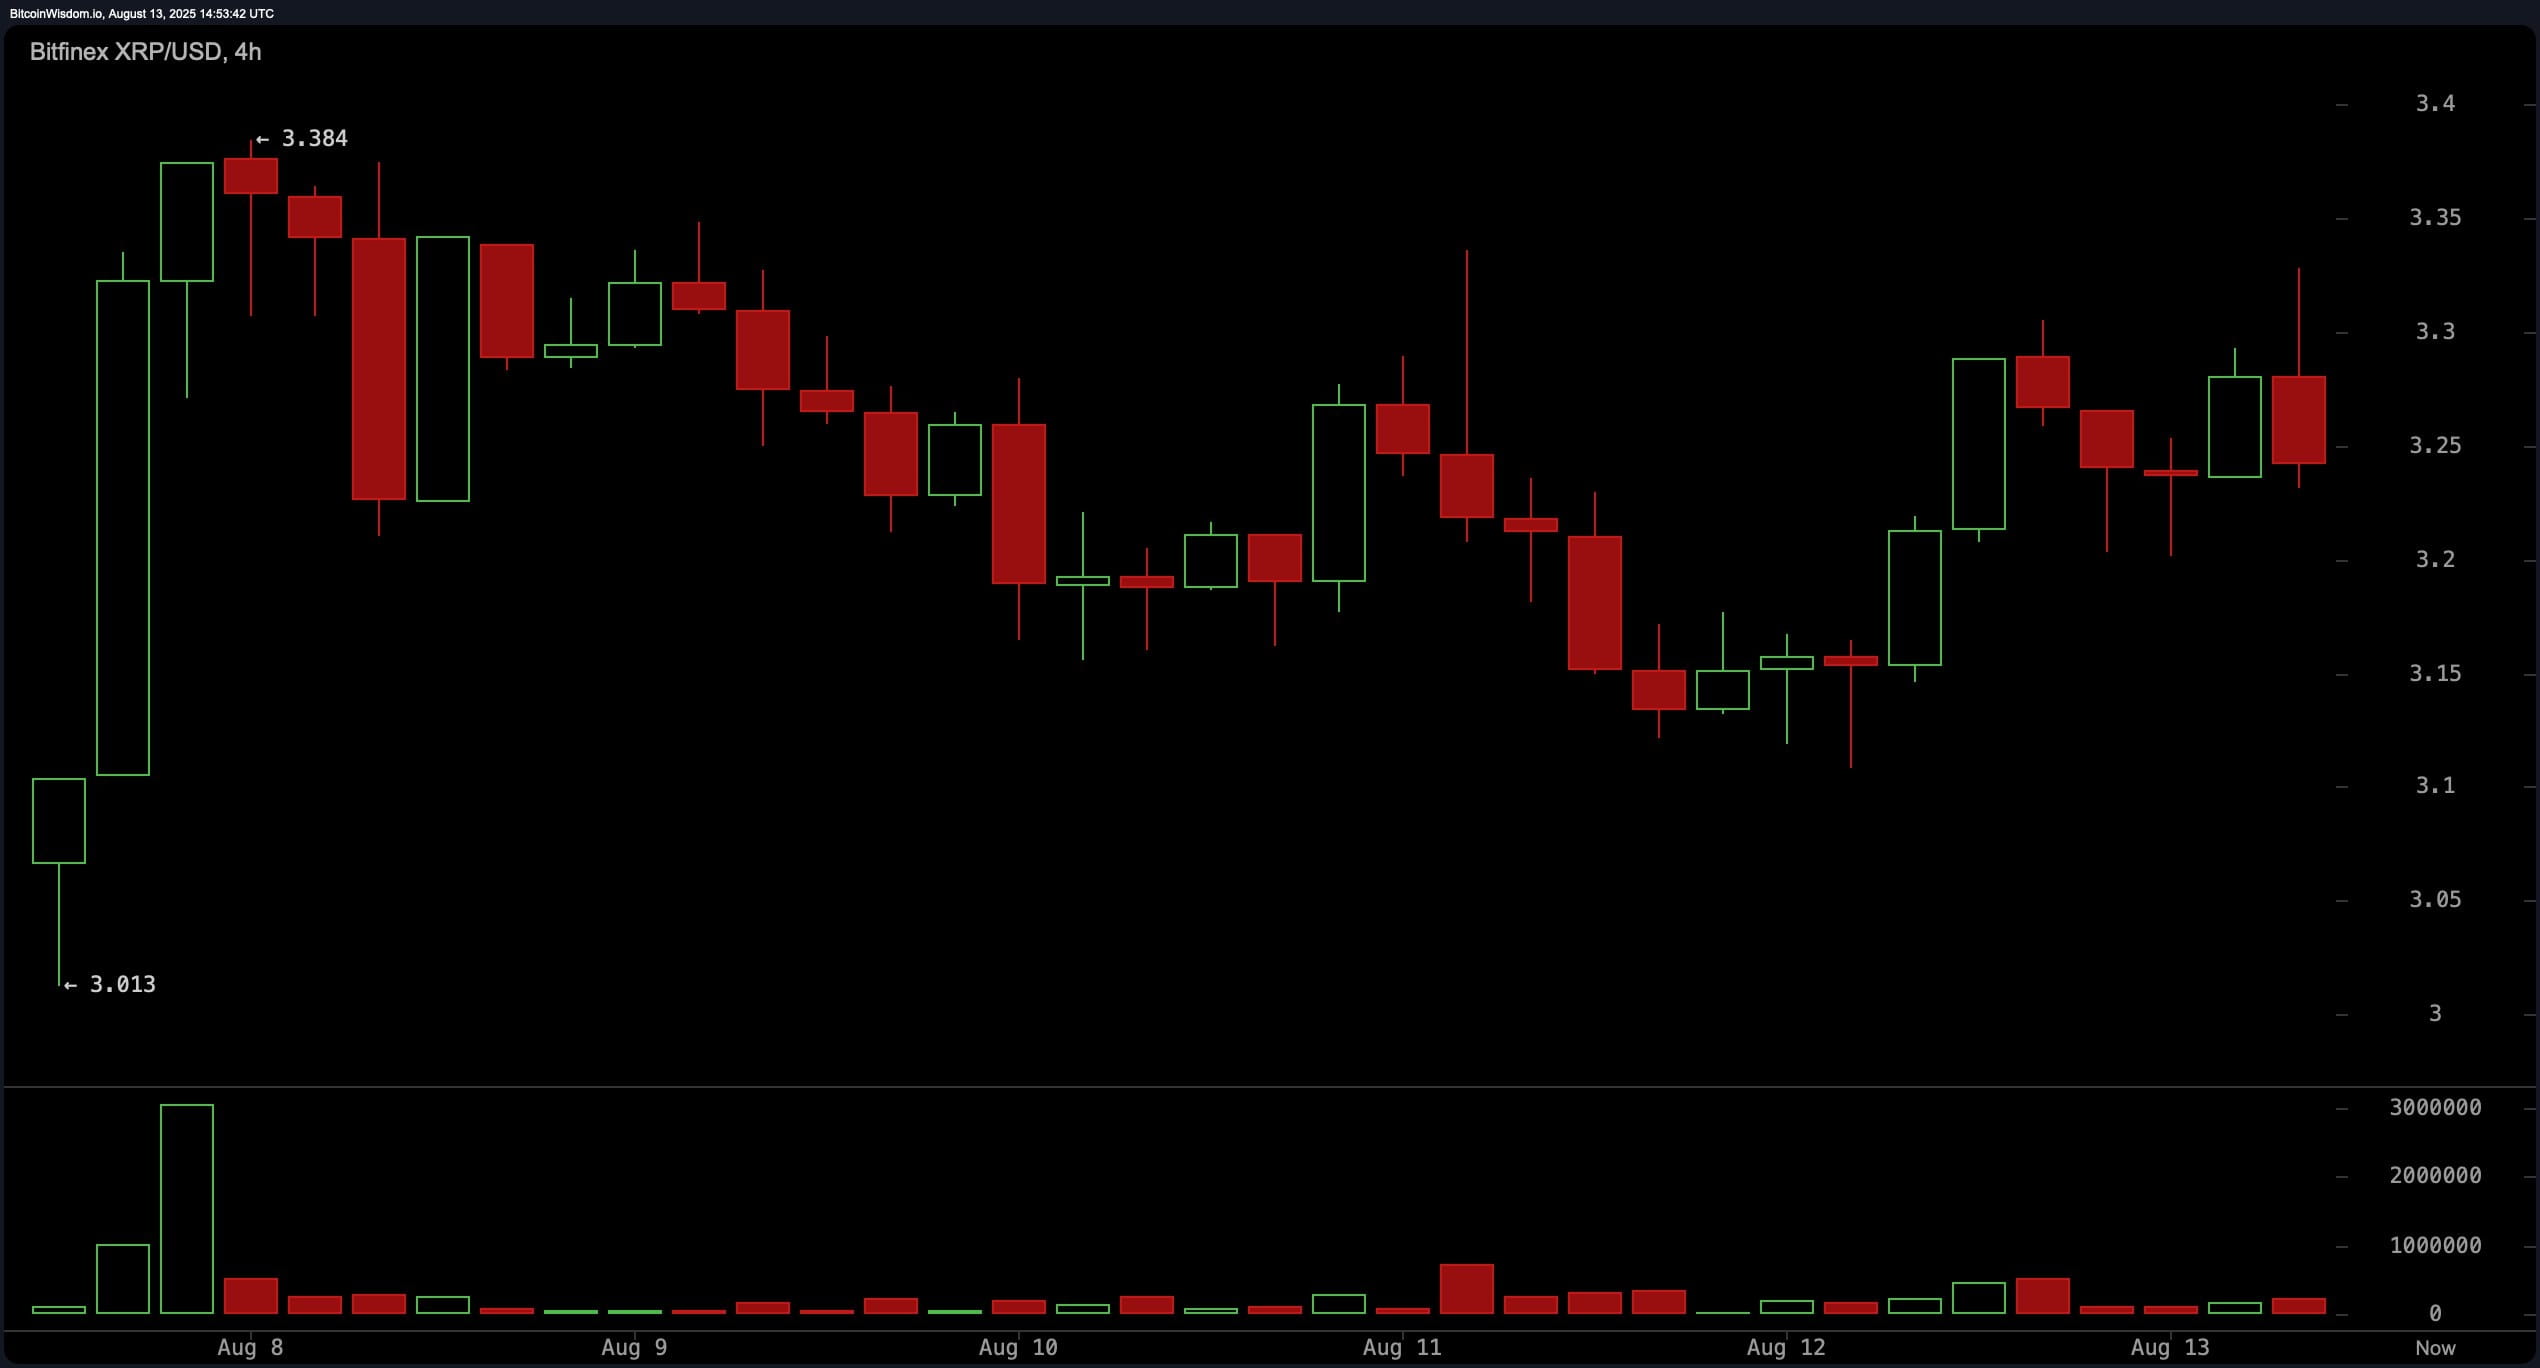
4-hour chart of XRP/USD via Bitfinex on August 13, 2025.
The daily chart shows a generally neutral to slightly bullish trend. XRP rose as high as $3.66 before encountering a correction, subsequently showing signs of gradual accumulation. Currently, prices are making higher lows, indicating potential strength, however, declining recovery volume advises against being overly optimistic too soon. Key resistance lies between $3.30 and $3.40, and a breakout with substantial volume could reignite bullish momentum. Conversely, a drop below $2.90 would invalidate the trend and reintroduce selling pressure.
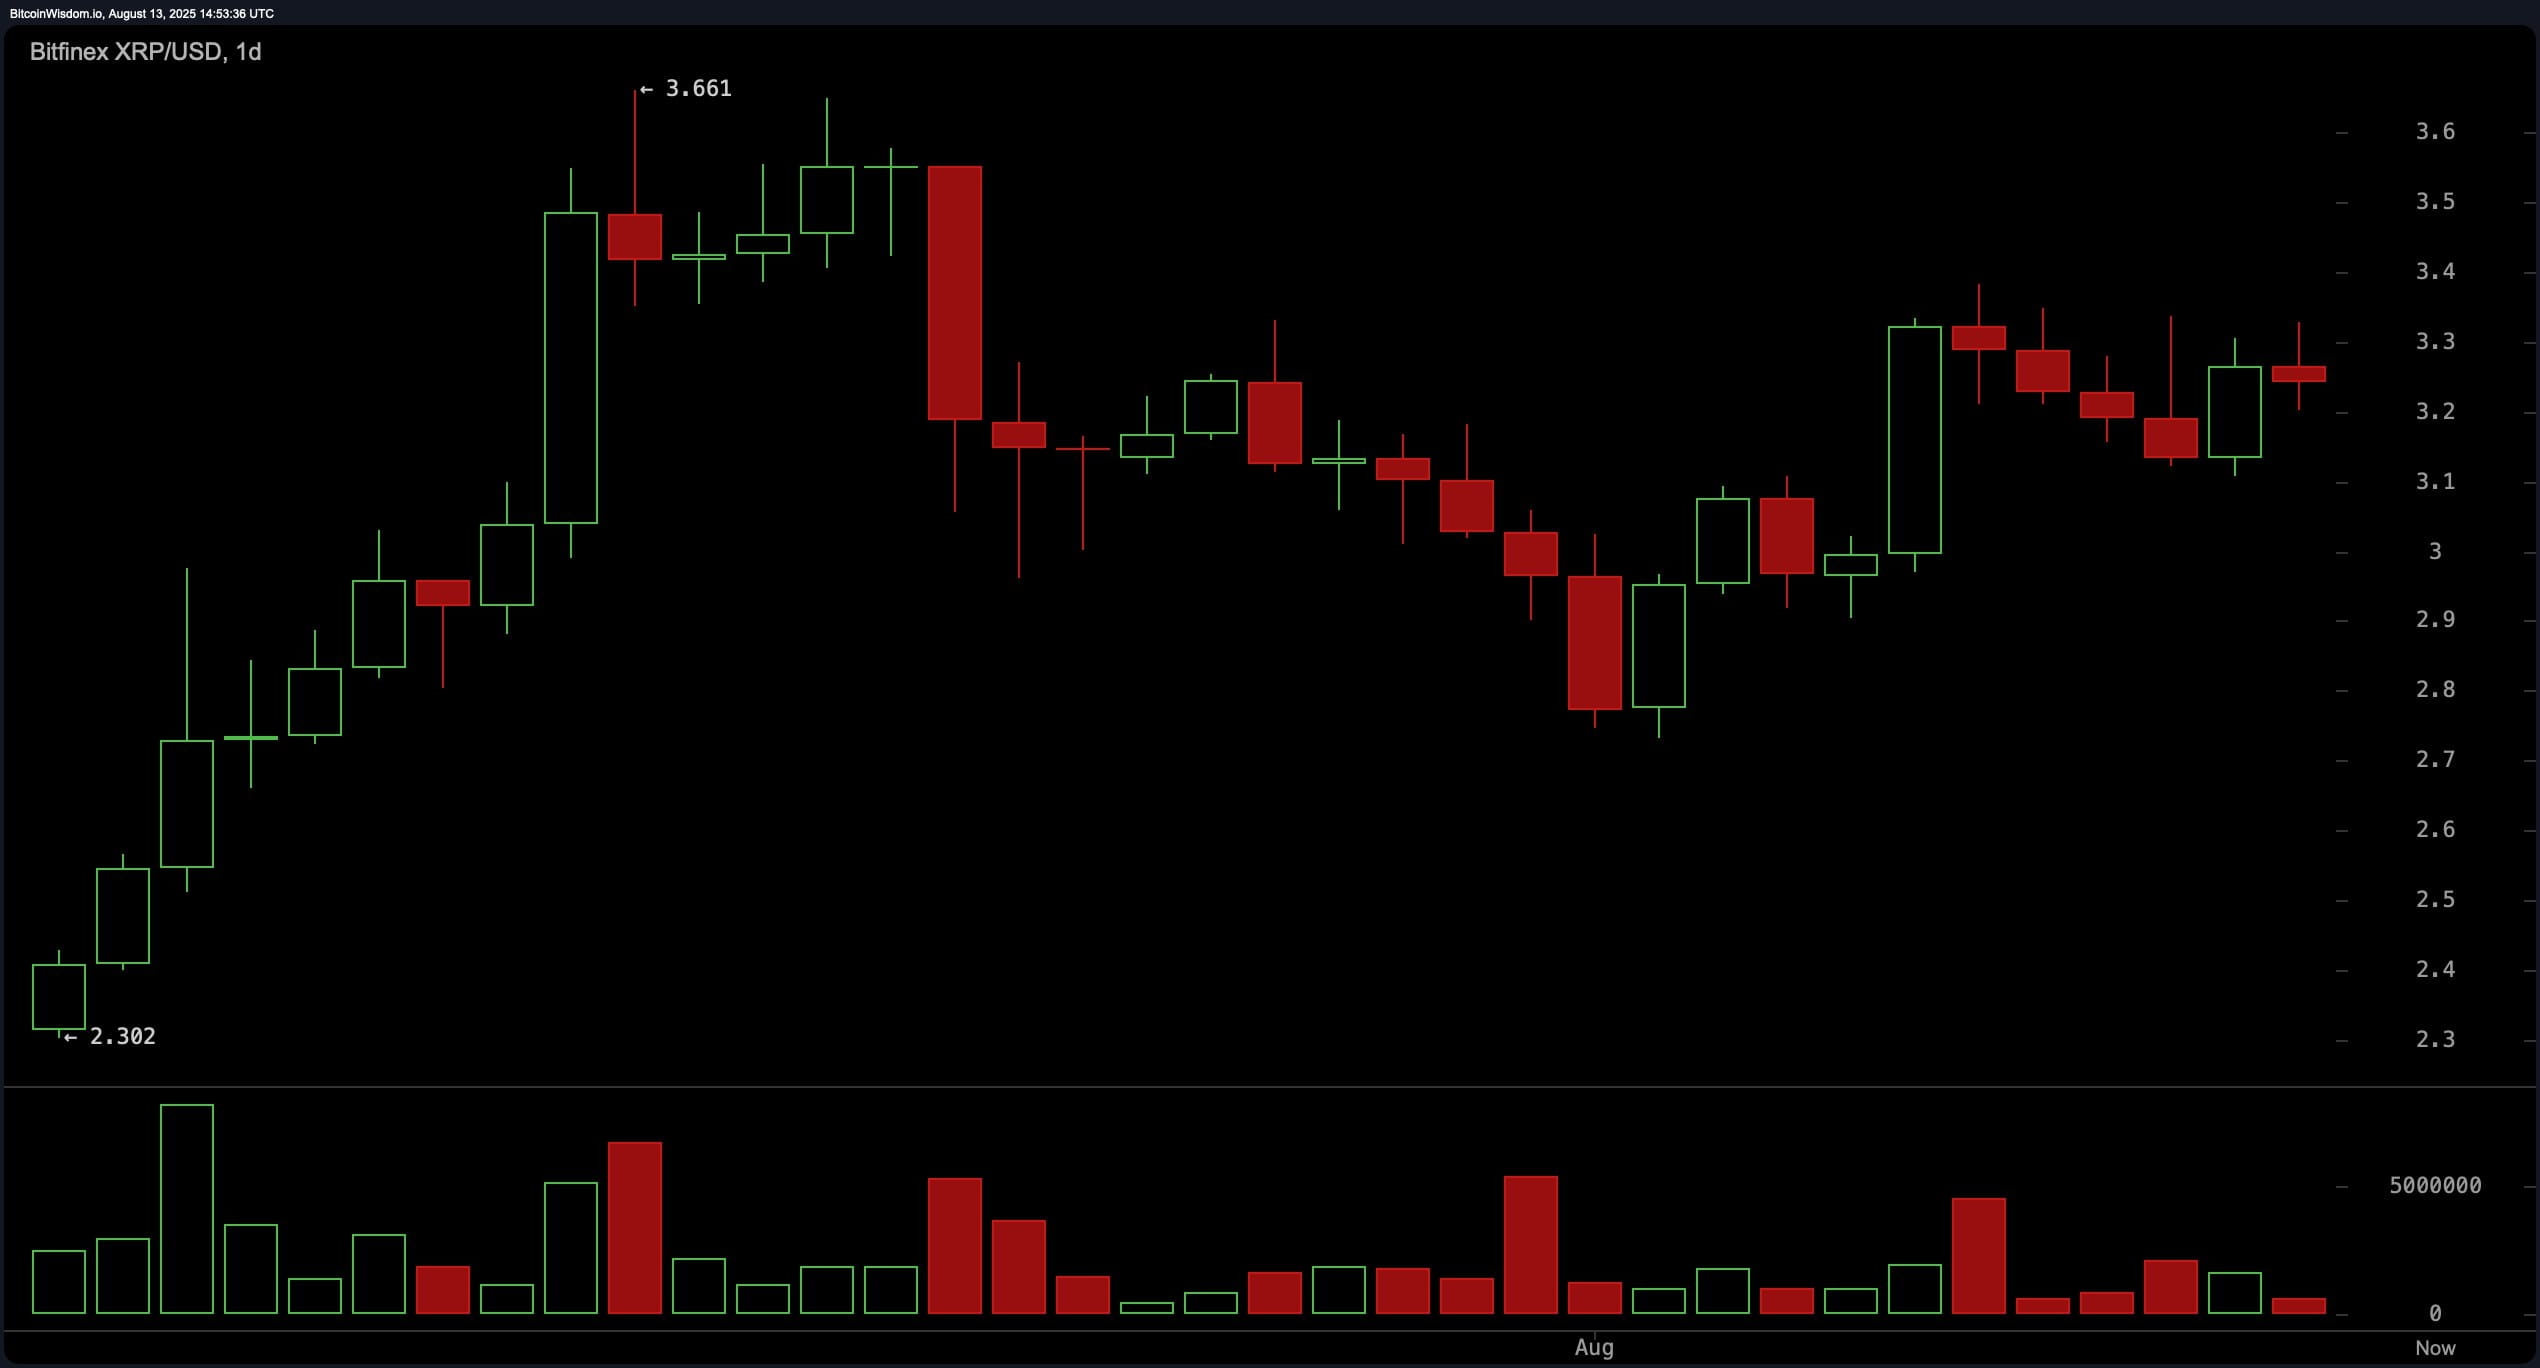
1-day chart of XRP/USD via Bitfinex on August 13, 2025.
Oscillator metrics on Wednesday are mostly neutral. The relative strength index (RSI) stands at 57.67, the stochastic oscillator at 74.80, and the commodity channel index (CCI) at 92.70 — all indicating balance. The average directional index (ADX) at 30.62 on the daily chart indicates a trend with moderate strength without any clear bias. However, two important indicators show weakness: the momentum oscillator reading 0.30622 emitting a bearish signal, while the moving average convergence divergence (MACD) at 0.08283 also provides a negative signal.
All moving averages provide strong support for the upward trend. The exponential moving average (EMA) and simple moving average (SMA) across 10, 20, 30, 50, 100, and 200 periods — including EMA (10) at $3.18002, SMA (10) at $3.16980, and EMA (200) at $2.41450 — all signal bullishness. These technical indicators reinforce the upward structure, especially the long-term averages, indicating strong vertical alignment. Prices maintaining above these key averages support the broader theory of ongoing strength, dependent on volume confirmation over resistance.
Bullish Verdict:
If XRP decisively breaks through the resistance level of $3.32 with strong volume, the technical outlook will shift to strong optimism. In that case, the asset could target a breakout to the range of $3.40–$3.45, with broader continuation likely due to strong support from moving averages across all time frames.
Bearish Verdict:
Failing to maintain above $3.15 or breaking below the stop-loss threshold of $3.10 would invalidate the higher low structure. In that case, bearish momentum could push XRP back to $3.00 or lower, especially if selling volume increases rapidly and oscillators continue to deteriorate.
