Bitcoin (BTC) has broken above the $122,000 mark during Wednesday's trading session, indicating that bulls are maintaining strong pressure. Continuously testing the resistance zone often weakens this 'shield,' thus opening up opportunities for BTC to conquer the historical peak of $123,218.
Not only BTC but Ether (ETH) is also accelerating, nearing the record $4,868 after a spike to $4,733. Market sentiment analysis platform Santiment states on X that ETH could very well break into new highs, as the majority of retail traders are still skeptical about this upward trend. History shows that prices often move 'against' the expectations of this group of investors.
In a recent report, Standard Chartered noted that strong cash flows from companies holding ETH and ETF funds, combined with the growth rate of stablecoin usage, are creating a solid foundation for ETH's outlook. The bank has raised its ETH price forecast for 2025 to $7,500, nearly doubling the previous forecast of $4,000.
Will BTC break through its historical peak and pave the way for a new breakout wave of altcoins? Let's analyze the price charts of the top 10 cryptocurrencies to find the answer.
Technical analysis of BTC
Buyers continue to push BTC closer to the historical peak of $123,218, indicating strong buying power at each small pullback.
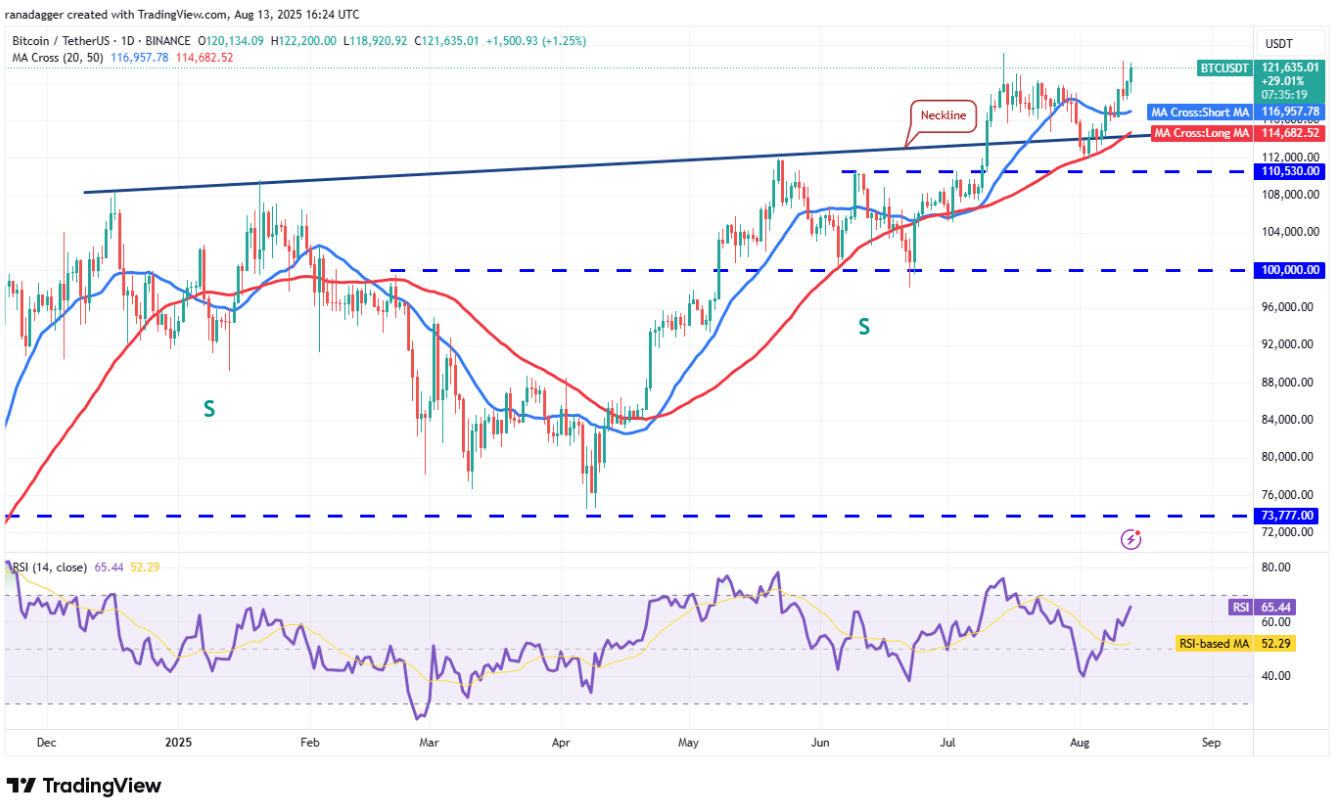
The 20-day simple moving average (SMA) is almost flat at $116,957, reflecting a balanced supply-demand situation, but the relative strength index (RSI) above 65 indicates positive momentum. This increases the likelihood of breaking the $123,218 level. If successful, the BTC/USDT pair could rise to the $135,000 area.
Bears are gradually running out of time. They need to quickly pull the price below the 50-day SMA ($114,682) to weaken the upward momentum. If this scenario occurs, the price of Bitcoin could fall to $110,530.
Technical analysis of ETH
ETH has extended its upward momentum beyond the $4,700 mark during Wednesday's trading session, indicating that buying demand remains strong.
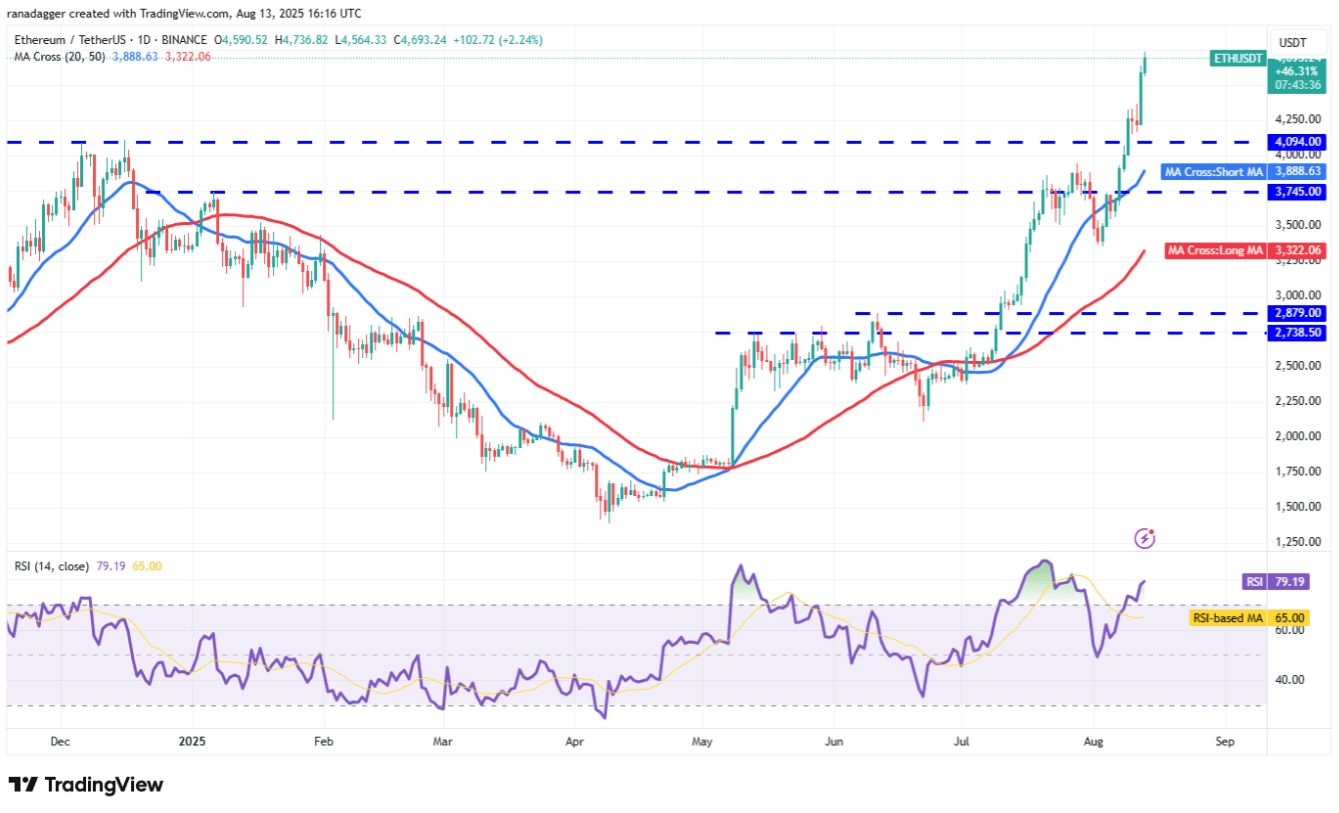
Bears will try to defend the $4,868 level, which could trigger a correction or short-term accumulation. The RSI indicator is in the overbought zone, implying that the upward momentum may slow down temporarily. If this occurs, the ETH/USDT pair could retreat to $4,350, even down to the breakdown level of $4,094.
Conversely, if buyers break through the $4,868 level, the price of ETH could soar to the psychological level of $5,000 and further to $5,662.
Technical analysis of XRP
XRP surged from the 20-day SMA ($3.11) on Tuesday, but bulls are still struggling to maintain high price levels.
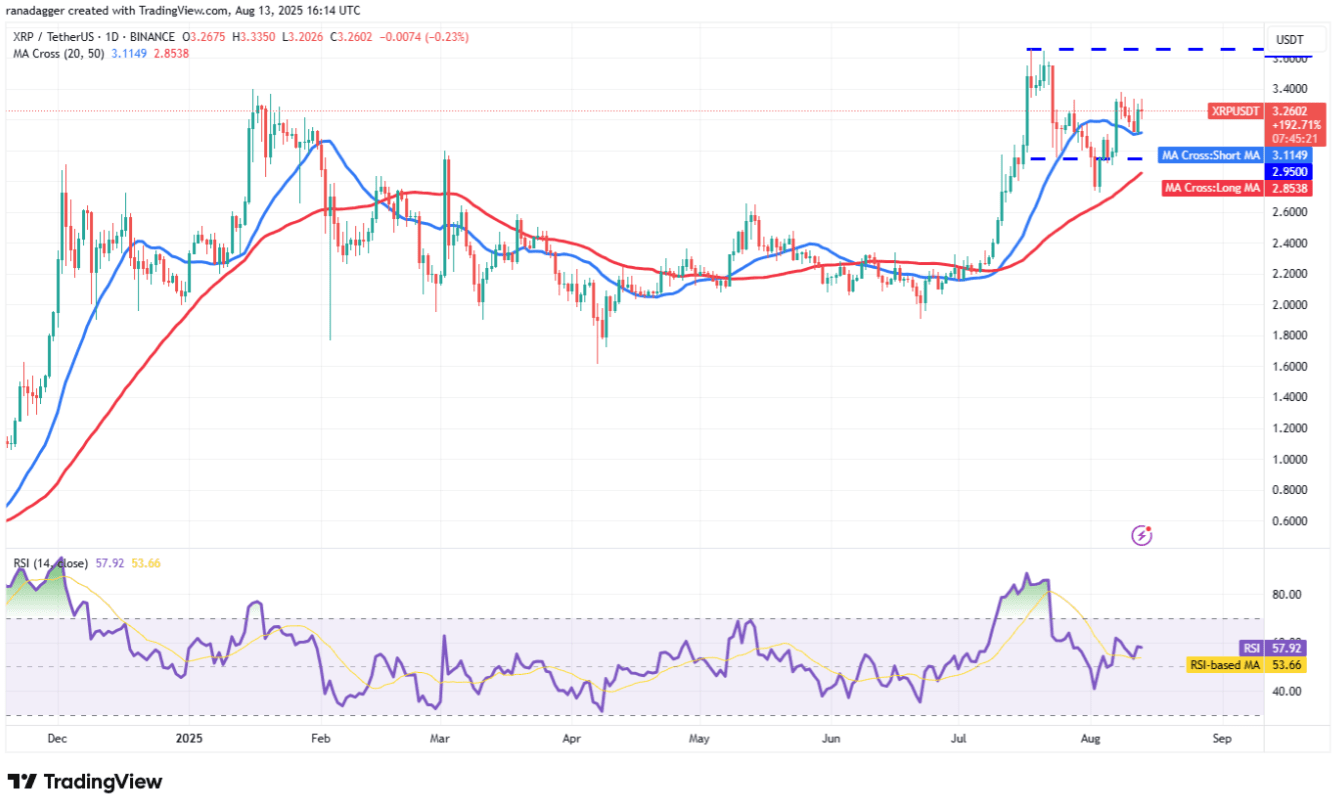
The 20-day SMA is flat and the RSI is just above neutral, indicating that neither bulls nor bears have a clear advantage. If the price exceeds $3.40, the XRP/USDT pair could advance to $3.66.
On the other hand, if the price falls below the 20-day SMA, this signals that bears are regaining the advantage. At that point, the price of XRP could drop to the 50-day SMA ($2.85), an area expected to attract buying pressure. The short-term trend turns negative if the price breaks below $2.72.
Technical analysis of BNB
BNB has recovered in a V-shape from $730 on August 3, indicating strong buying power at low price levels.
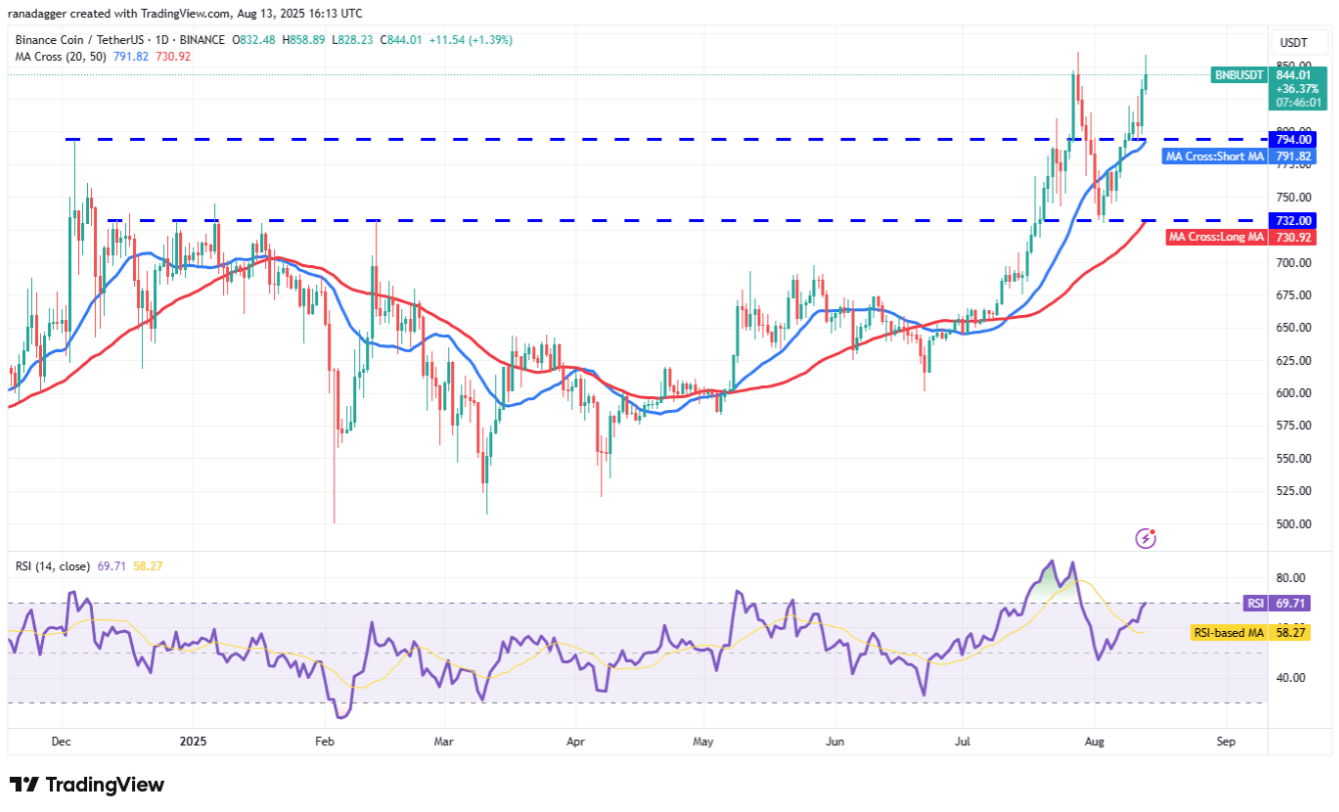
The BNB/USDT pair has risen close to the resistance level of $861, where bears are exerting significant pressure. If the price retraces from $861 but bounces back from the 20-day SMA ($794), it indicates a buying trend on the pullback. At that point, the likelihood of breaking $861 will be higher, opening up the opportunity to advance towards $900, even $1,000.
The first weakening signal is when the price breaks and closes below the 20-day SMA, indicating profit-taking at high levels. At that time, the price of BNB could sharply decline to strong support at $732.
Technical analysis of SOL
Solana surged strongly from the 20-day SMA ($176) and broke through the $185 resistance during Tuesday's session.
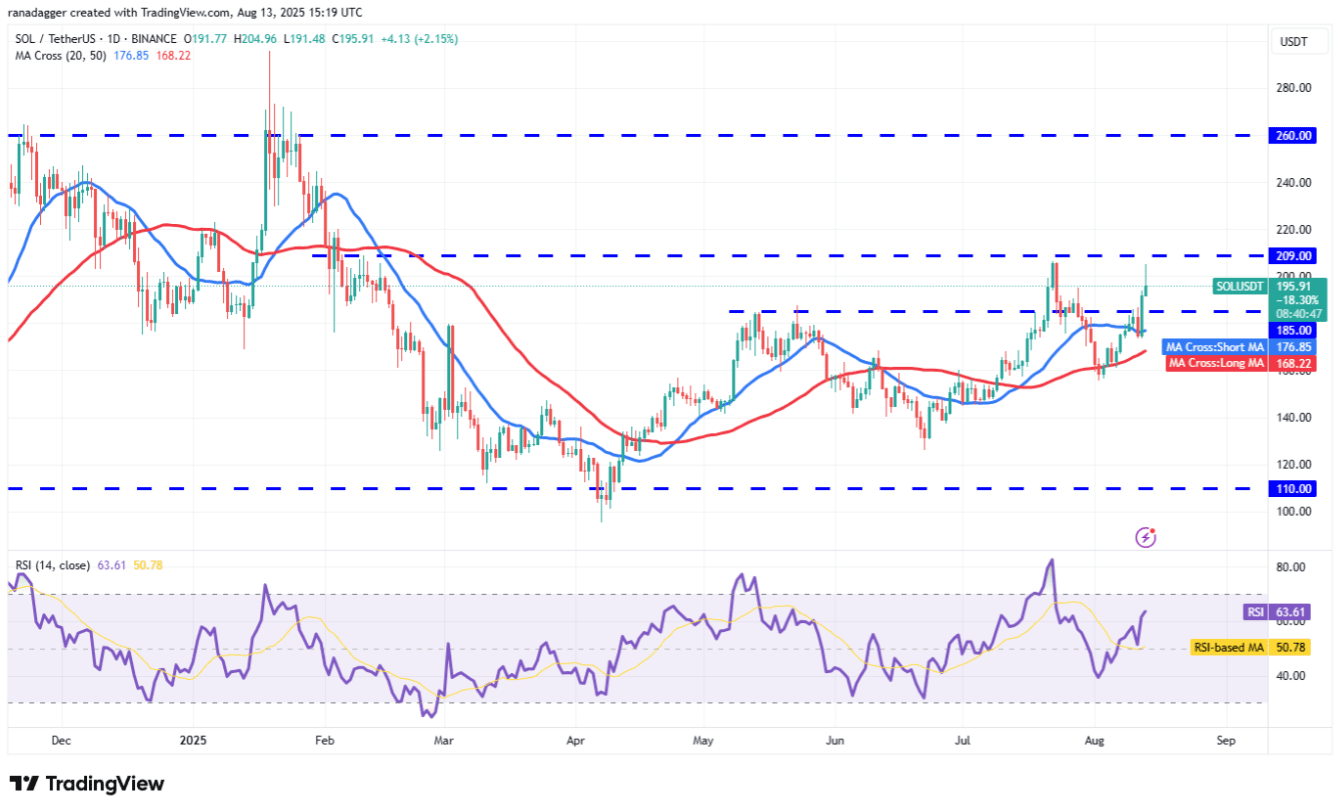
The SOL/USDT pair approached the resistance zone of $209 on Wednesday, but the long candle wick indicates that bears are still defending this price area. The price of Solana may retreat to support at $185, where buying pressure is expected.
If the price bounces strongly from $185, bulls will again attempt to push the price above $209. Success will pave the way for an increase towards $240.
On the other hand, if the price breaks and closes below $185, the market may form a trading range from $155 to $209.
Technical analysis of DOGE
Dogecoin has been stuck in a wide range from $0.14 to $0.29 for several months.
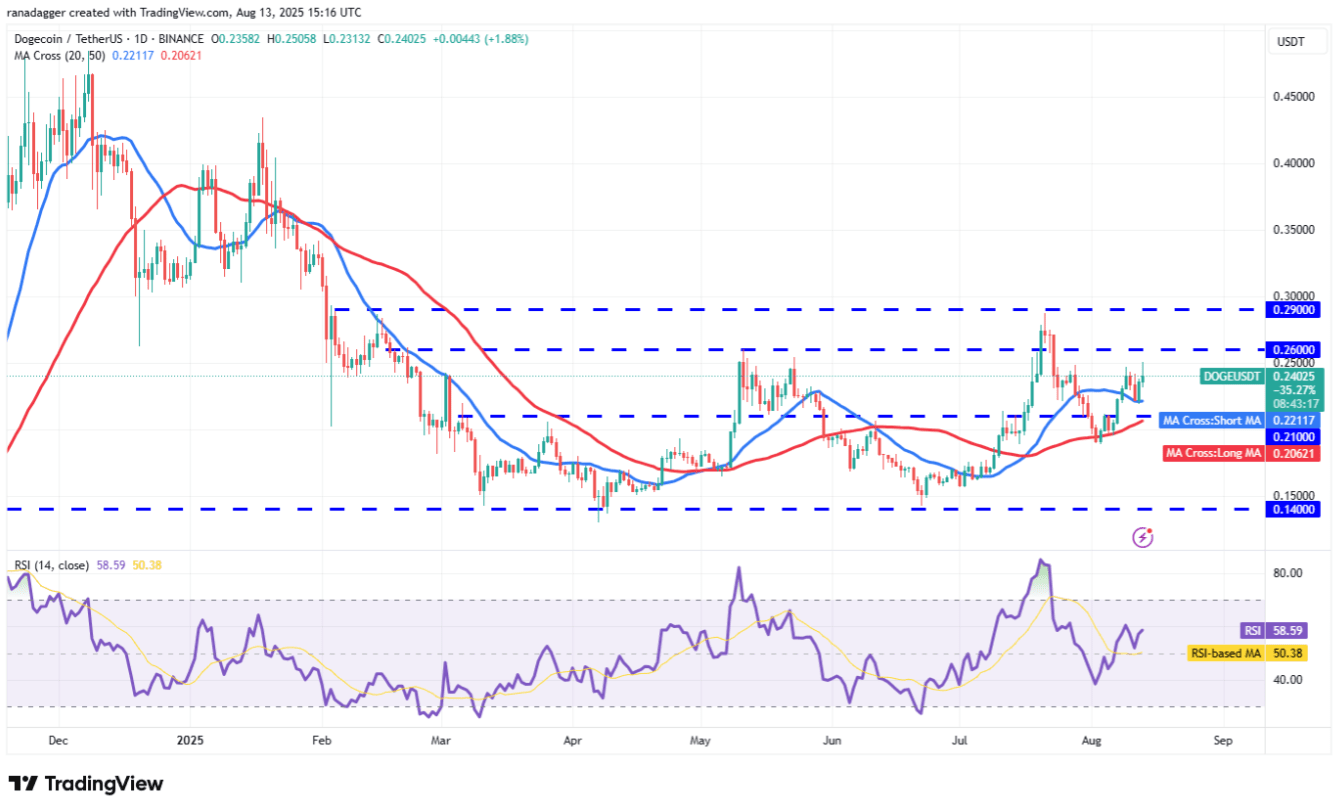
The price bounced from the 20-day SMA ($0.22) on Tuesday, indicating that bulls are trying to take control of the market. The $0.25 level will be the nearest resistance, and if surpassed, the DOGE/USDT pair could advance to $0.29. Bears are likely to fiercely defend $0.29, as a close above this level could trigger a strong rally to $0.44.
On the downside, the first support is at the 20-day SMA, followed by the 50-day SMA ($0.20). If the 50-day SMA is breached, the price of Dogecoin could drop sharply to $0.18.
Technical analysis of ADA
Cardano (ADA) surged strongly from the 20-day SMA ($0.77) on Tuesday, indicating fierce buying power at low price levels.
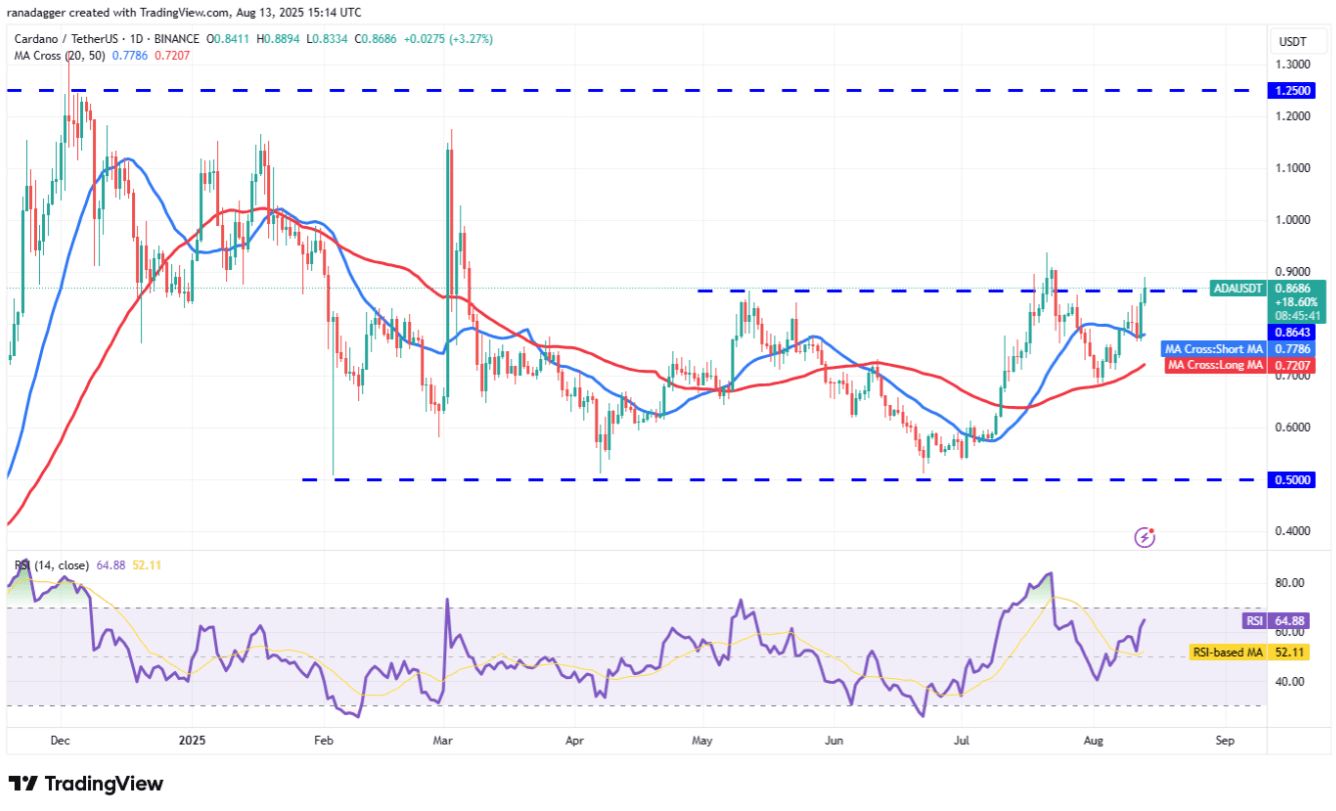
Bulls are trying to maintain the price above the resistance level of $0.86. If successful, the ADA/USDT pair could rise to $0.94 and then to $1.02.
The first weakening signal will appear if the price breaks and closes below the 20-day SMA. At that point, the price of Cardano could fall to the 50-day SMA ($0.72). This is an important level for bulls to defend, as breaking and closing below the 50-day SMA could shift the advantage to bears.
Technical analysis of LINK
Chainlink (LINK) is gradually heading towards the $27 level, reflecting strong buying power from bulls.
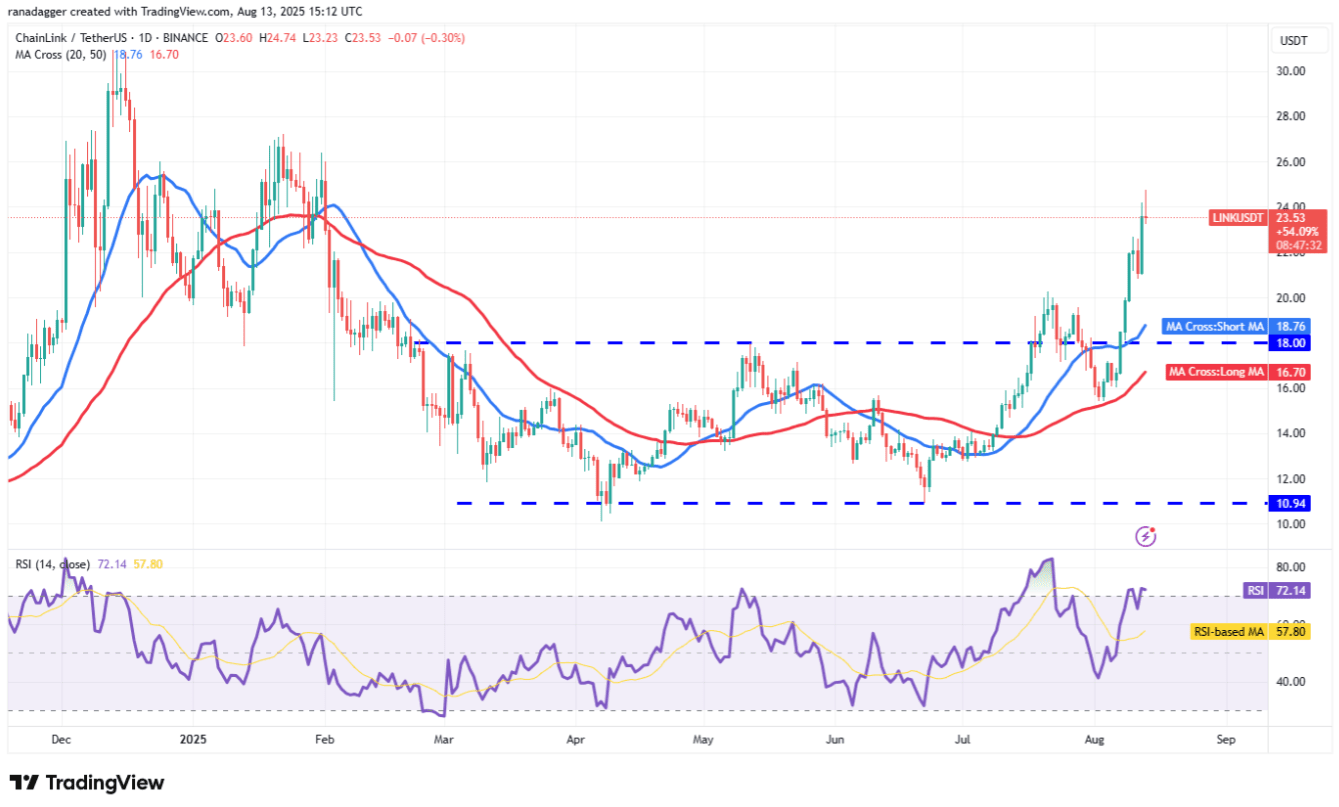
However, bears are likely to exert significant pressure in the resistance zone of $26 - $27. If the price reverses from this area, the LINK/USDT pair could plummet to $20.84. Buying pressure is expected to protect the $20.84 level, as breaking this threshold could cause the price of Chainlink to drop deep to $18.
Conversely, if bulls break through the $27 resistance, the upward trend could continue, and the price is likely to extend the rally to $31.
Technical analysis of HYPE
Hyperliquid (HYPE) is currently caught between moving averages and the support line of an ascending price channel.
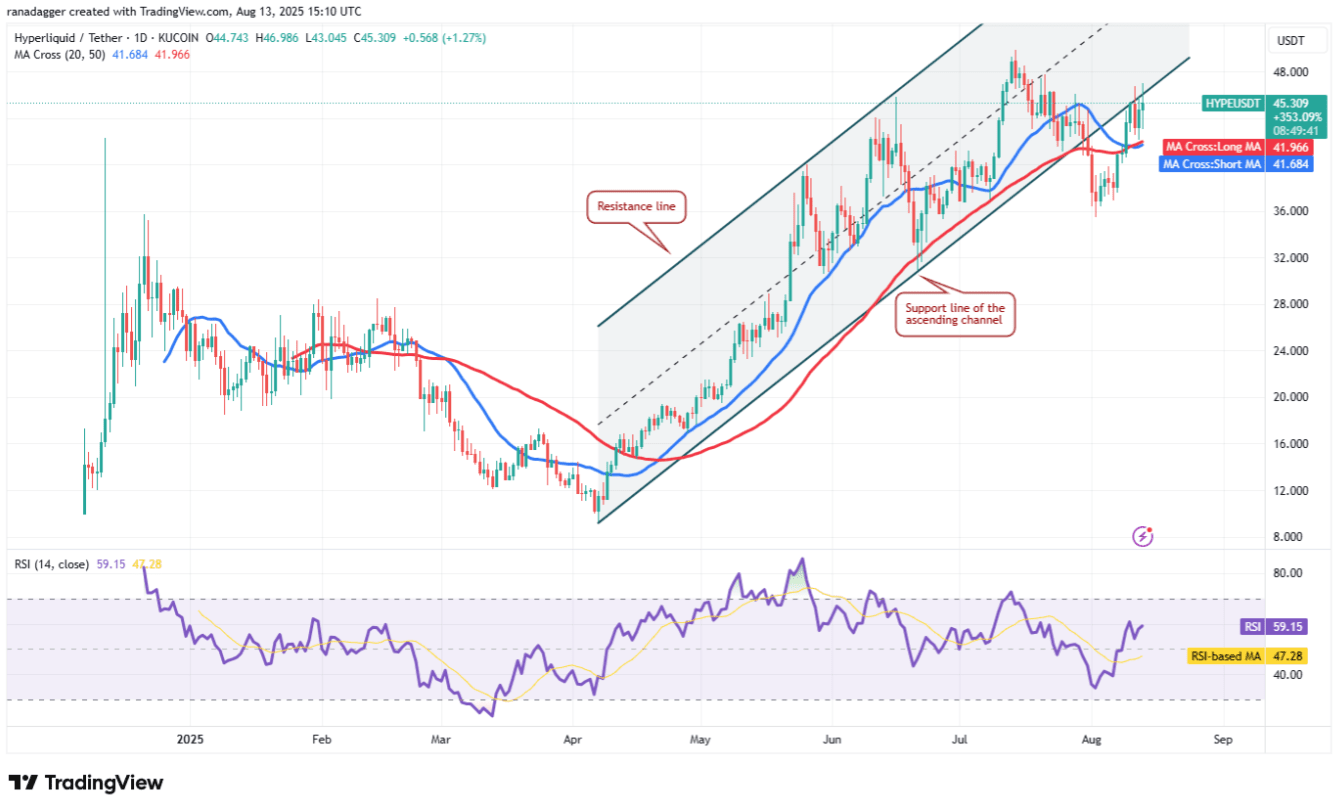
The moving averages are flat, and the RSI is slightly above neutral, showing that neither side has a distinct advantage. If bulls successfully close above the support line, the HYPE/USDT pair could break out to $50. Bears may try to stop the uptrend at this level, but if bulls prevail, the rally could extend to the resistance of the price channel near $64.
This positive scenario would be invalidated in the short term if the price reverses and breaks below the moving averages. At that point, the price of Hyperliquid could fall to $36.
Technical analysis of XLM
Stellar (XLM) continues to receive support at the 20-day SMA ($0.42), reflecting positive sentiment in the market.
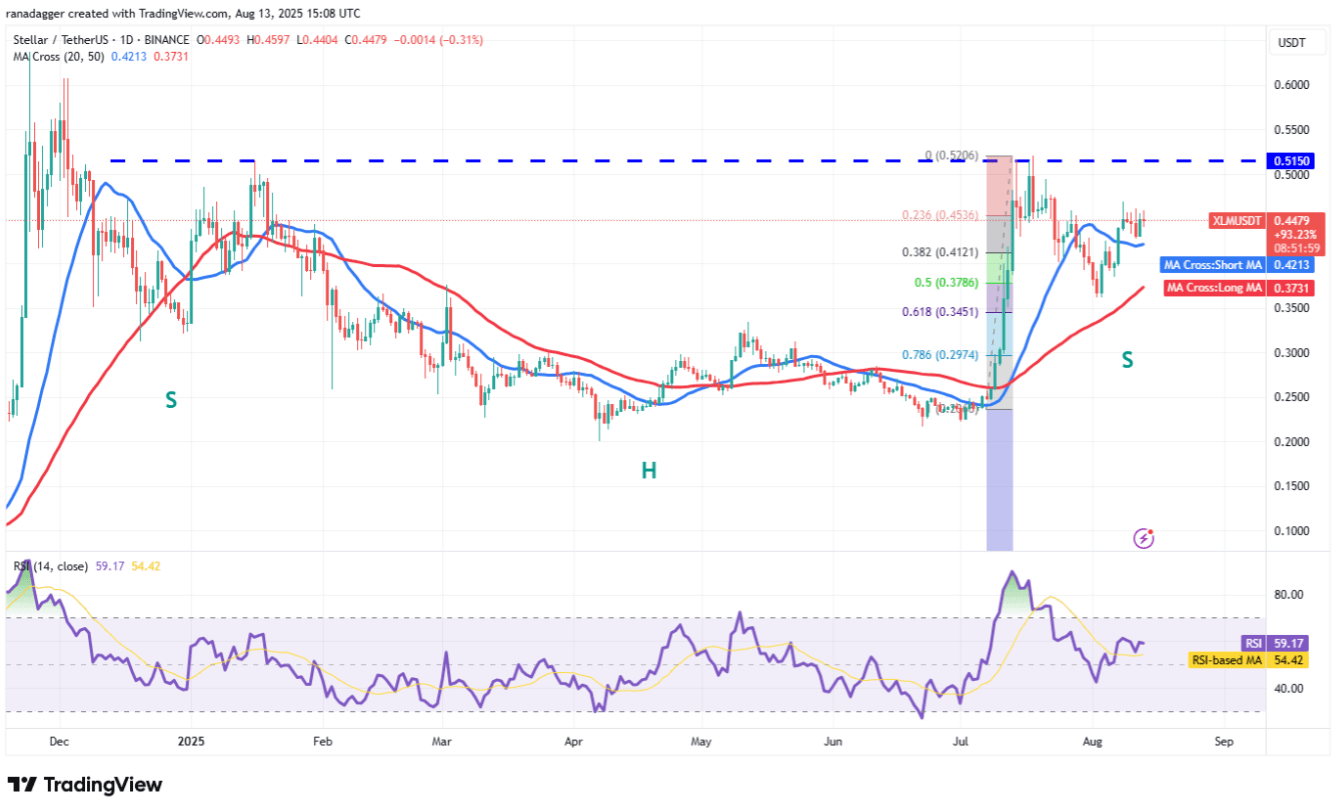
The 20-day SMA is moving sideways, but the RSI is in the bullish zone, indicating that momentum is leaning towards bulls. If bulls push the price above $0.47, the XLM/USDT pair could accelerate to $0.52. Notably, the price of Stellar will complete an inverse head and shoulders pattern if it closes above $0.52.
Conversely, bears will need to quickly pull the price below the 20-day SMA to regain the advantage. If successful, this pair could plummet to the 61.8% Fibonacci retracement level at $0.34.