
Date: Wed, Aug 13, 2025 | 12:35 PM GMT
The cryptocurrency market is in full bullish swing as Ethereum (ETH) broke above the $4,700 mark for the first time since 2021. This 30% weekly surge has boosted sentiment across major altcoins, including Solana (SOL).
$SOL has jumped 14% today, extending its weekly gains to 23%. More importantly, its latest chart now reveals a key harmonic setup that could point toward more upside in the near term.
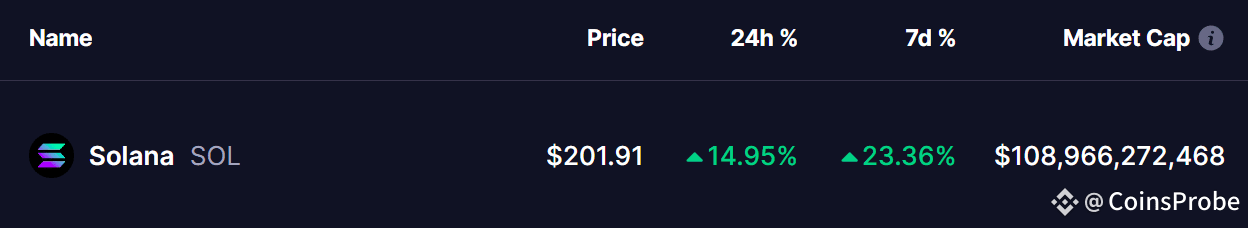
Source: Coinmarketcap
Harmonic Pattern Hints at Potential Bounce
On the daily chart, SOL is forming a Bearish ABCD harmonic pattern — a structure that, despite its name, often features a bullish CD-leg before reaching the final Potential Reversal Zone (PRZ).
The move began with a rally from Point A near $145.35 to Point B, followed by a retracement to Point C around $155.91, where buyers stepped back in. Since then, SOL has climbed to around $202, showing that the CD leg is well underway.
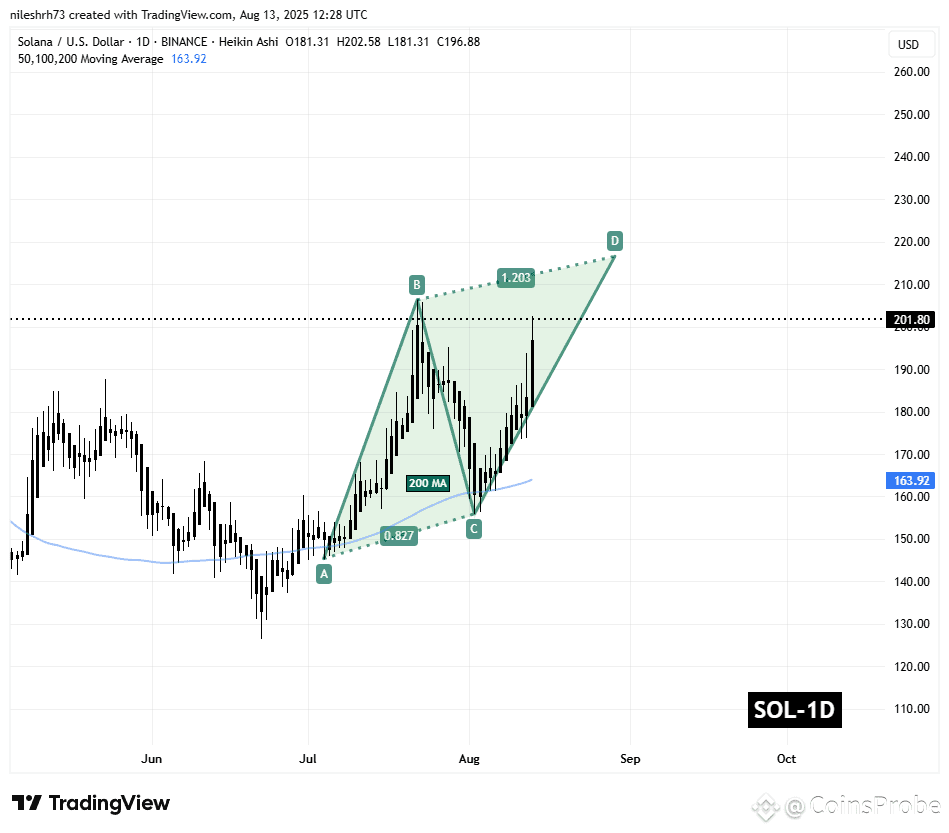
Solana (SOL) Daily Chart/Coinsprobe (Source: Tradingview)
If the pattern plays out according to the traditional ABCD framework, the CD leg could extend to the 1.20 Fibonacci projection of the BC leg, putting the PRZ around $216.56 — about 7% higher from current prices.
What’s Next for SOL?
If bullish momentum holds, SOL could continue toward the $216.56 zone. However, this level is likely to act as a major resistance area, where profit-taking or short-term pullbacks may occur. Before reaching the target, traders should not ignore the possibility of a retracement toward lower-edge support.
Disclaimer: This article is for informational purposes only and not financial advice. Always conduct your own research before investing in cryptocurrencies.

