After over 10 years of trading cryptocurrency, I spent 3 years and over a thousand days and nights, conducting tens of thousands of trades to validate this method, achieving a success rate of 90%.
I have also personally tested this: using a principal of 80,000, I managed to reach over 40 million using this trading method!
Now I share this with everyone; if you read this article seriously, you will benefit for a lifetime! Remember to save it, repeatedly study and practice, summarize and review to develop your trading system.
Table of Contents:
One: Basic concepts for market manipulation in the cryptocurrency market.
Two: Basic logic for market manipulation in the cryptocurrency market.
Three: The basics of candlestick charts in the cryptocurrency market.
Four: Curses of Retail Investors in Cryptocurrency Market Manipulation.
Five: Choosing currencies and bottom fishing in the cryptocurrency market.
Six: Riding on the coattails of market makers in the cryptocurrency market.
Seven: Trading strategies in cryptocurrency market manipulation.
Eight: Basic indicators for market manipulation in the cryptocurrency market.
Two: Basic logic for market manipulation in the cryptocurrency market.
How can you make money in the stock market or cryptocurrency market?
Clearly understand two concepts: market makers and retail investors.
In simple terms, stocks or cryptocurrencies are merely games where market makers play retail investors using price fluctuations.
Some might say, I know about market makers; knowing that doesn’t change anything. The market maker says I'm right here; what can you do? Do you have a market maker's team? Do you have more money than the market maker? Do you have broader news than the market maker? You have nothing; so what does knowing about the market maker mean?
What you truly need to understand is not concepts, not news; those daily fake and exaggerated messages pull you in different directions, making you unaware of your own north.
What you really need to know is the data, the market maker's data.
How to view the data of the market makers? Whether in stocks, forex, or cryptocurrency, the most reliable indicator is 'volume'.
Volume ✖ Price = Money = Money invested by market makers!
If you know how much money the market makers have invested in a currency pair and at what cost, and how much profit they aim to make, you can relax and follow along to share the profits, then cash out.
It's easy to say but hard to do.
The difficulty lies in being manipulated by the candlestick in front of you, running away from where you should hold and entering where you should exit. Often, later regret comes too late: if only I hadn’t sold at that moment, if only I hadn’t acted impulsively, I wouldn’t be trapped. I say this will rise, and you see it rose, right? I say this will fall, and you see how fiercely it falls. But if it were to happen again, you would still choose impulsively and still regret it; thus, hindsight is meaningless! It only adds to your emotional exhaustion.
The fundamental reason is your uncertainty. Why the uncertainty? Because you haven't grasped the most basic logic.
What is logic? For example, what is the logic of a complete life? Birth, youth, adulthood, old age. This is the logic of a complete life.
Then what is the logic of a currency? Up and down. At this point, you might say, that's obvious, I know about rises and falls. The key here is the nodes: at age 3, one should start kindergarten; at 20, one should marry; at 60, one should retire. These are nodes. When a child is three, you’ll know: oh, this child should start kindergarten. Similarly, if you find the candlestick reaches a node where it should rise, you’ll know it’s time to buy without hesitation.
Rises and falls can be subdivided into many nodes, namely accumulation, washout, upward movement, and distribution, which are four stages. If you can understand the accumulation stage, you have already succeeded halfway. This alone ensures that you won't incur losses.
Three: The basics of candlestick charts in the cryptocurrency market.
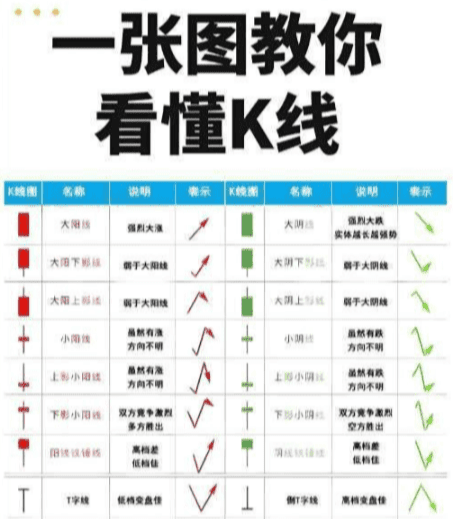
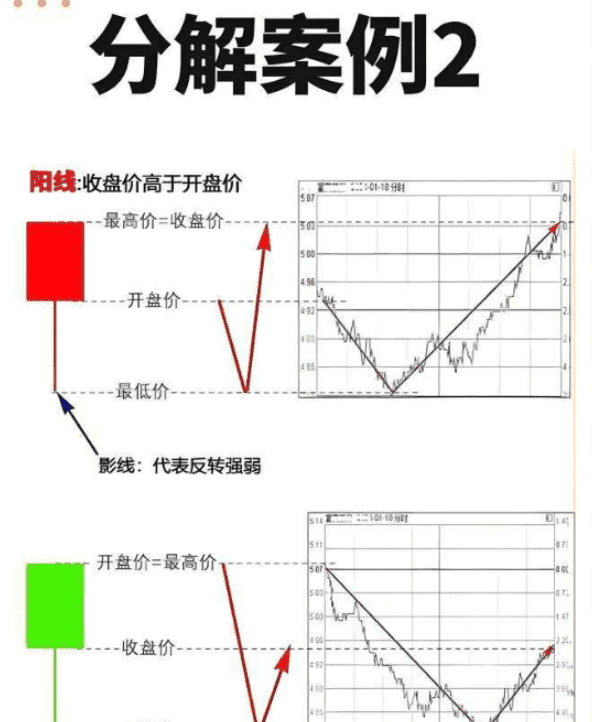
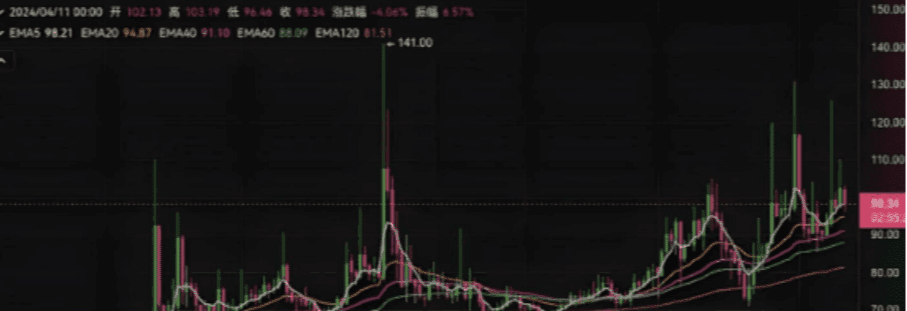
Next, let's discuss the actions of market makers. To have an accurate understanding, you first need a comprehensive foundation. A tall building rises from the ground; without a foundation, your logic has no support. What is a candlestick? It records prices over a certain period. For example, daily candlesticks, weekly candlesticks, monthly candlesticks, and shorter periods like hourly or minute candlesticks. Candlesticks primarily have four elements: highest price, lowest price, opening price, and closing price.
Getting Started in Cryptocurrency: Making it Easy for Beginners to Understand Candlestick Charts
[Star R] Basic structure of candlestick charts
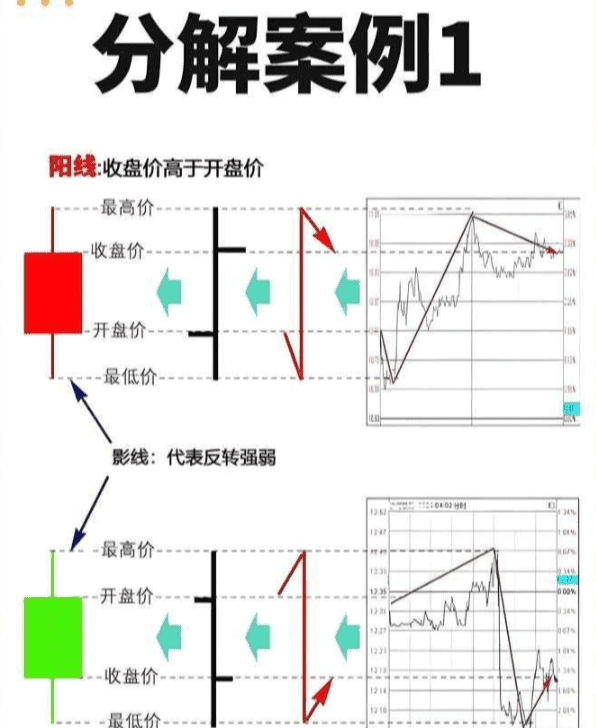
Opening Price: The first transaction price of the trading day.
Closing Price: The last transaction price of the trading day.
Highest Price: The highest transaction price within the trading day.
Lowest Price: The lowest transaction price within the trading day.
A candlestick typically consists of three parts:
Upper Shadow: Located above the candlestick, it represents the price range between the highest price and the closing price (or opening price, depending on the candlestick's color).
Body: Represents the price range between the opening and closing prices. A bullish candlestick (red or white) indicates the closing price is higher than the opening price, while a bearish candlestick (green or black) indicates the closing price is lower than the opening price.
Lower Shadow: Located below the candlestick, it represents the price range between the lowest price and the opening price (or closing price, depending on the candlestick's color).
[Star R] Methods for Interpreting Candlestick Charts
Interpretation of a single candlestick.
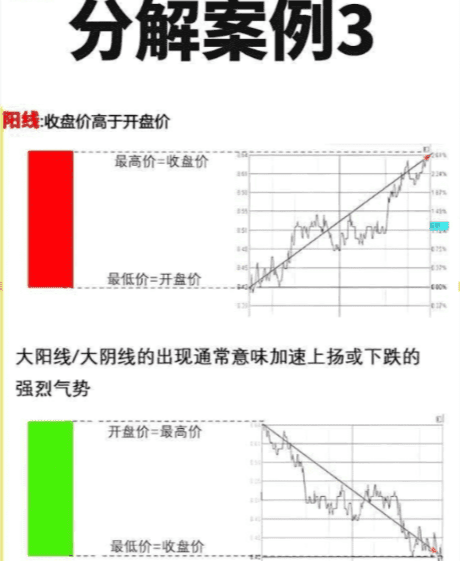
Bullish and bearish candlesticks: A bullish candlestick indicates the market rose during that period, while a bearish candlestick indicates a decline.
Body Size: The longer the body, the stronger the market's attack force. The longer the bullish candlestick body, the more sufficient the upward momentum; the longer the bearish candlestick body, the greater the downward momentum.
Shadow Length: The longer the shadow, the stronger the resistance or support in that direction. The longer the upper shadow, the greater the resistance to rising; the longer the lower shadow, the stronger the support.
Interpretation of candlestick combinations.
Four: Curses of Retail Investors in Cryptocurrency Market Manipulation.
About the curse of buying low and selling high.
This question can be understood from a different perspective. It's a simple principle: if I were a market maker with such a large team and invested so much money, my goal is to make money from you, not to help you make money. This is the main point. All actions revolve around this point. After secretly collecting bottom-level chips for several months or even a year, why would I take you along for the ride? Thus, before the price rises, I must get you off the bus. How do I get you off? Washout!
After lurking for a while, I obtained enough chips and enough controlling chips; thereafter, the fate of the entire candlestick is thoroughly in my hands. Mastering the candlestick is equivalent to holding the heart of retail investors; the candlestick is the rope, and retail investors are a flock of sheep. Wherever I lead, you will follow, allowing me to play with you. You may say you won't easily be fooled; you overestimate yourself. As long as you have humanity and desires, you can't remain calm. Emotional fluctuations can happen in an instant; buying and selling actions only require a second. You won’t have time to realize your emotions are being manipulated. When you realize all this, you have already completed the buy/sell action, and that’s what I want you to do.
When you think this currency is going to rise, others will think the same. Most people will think so. So it's not just you who bought; others bought too. Once you all come in, can I still rise? If I rise and all of you make money and run away, who will take over? So once you all follow in, I will wash out until there are no more uncertain chips left. Unless you uninstall the platform after buying, I truly can do nothing; but how many can achieve that?
Conversely, when no one thinks this currency will rise, with no retail investors flooding in, and previous retail investors mostly washed out, I will begin to rise. A big bullish candlestick will shoot up, and whether you chase or not, if many chase, I will repeat the washout action. If you don’t chase, then why shouldn’t I continue to rise? You all will have missed the boat successfully.
Thus, when you buy, the price drops, and when you sell, the price rises; this is a sort of inevitability caused by the actions of the majority of retail investors. This is a dynamic orientation.
As long as it concerns 'the majority', you will fall into this curse. How to become part of the minority? Market makers hunt retail investors, and we hunt market makers. There are many experts in the cryptocurrency market; when market makers are hunting retail investors, they watch the show. When market makers are pulling up, they follow along; when market makers distribute chips, they exit.
Their common characteristic is: patience. Like a wolf, they watch their prey, motionless.
Knowing yourself and knowing your enemy will ensure victory in every battle. Understanding the enemy's movements allows for targeted actions.
I believe the following chart is familiar to veteran traders and even well-known.
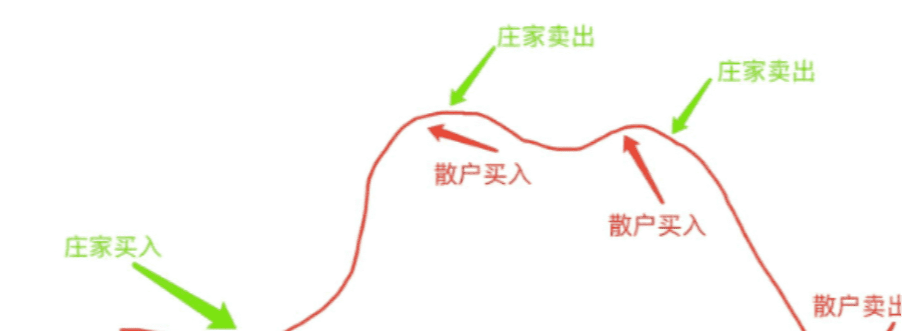
After seeing this chart, you might think, how could I be so foolish? You don’t believe it, right? Open your trading records, and you’ll know. Why is it so difficult to apply such simple principles? It’s just human nature; trading is all about human nature.
Five: Choosing currencies and bottom fishing in the cryptocurrency market.
To engage in a game of wits with market makers, you need to have a comprehensive understanding of them. Each market maker has their unique trading methods; some are bold and decisive, others are meticulous and cautious, some are bloodthirsty and violent, while others are gentle and refined. Based on their attitudes towards retail investors, they can be divided into two types: benevolent and malevolent.
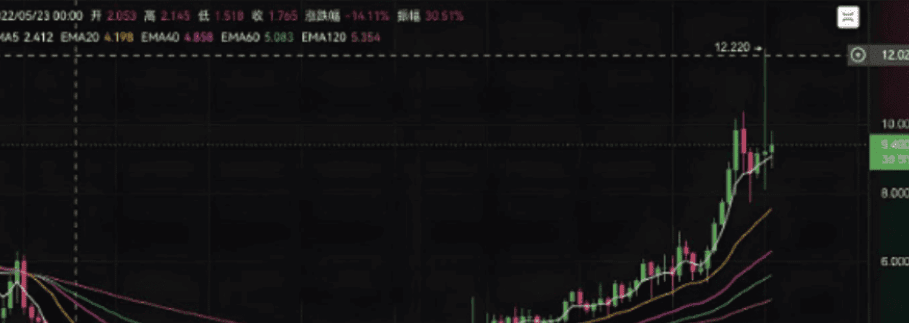
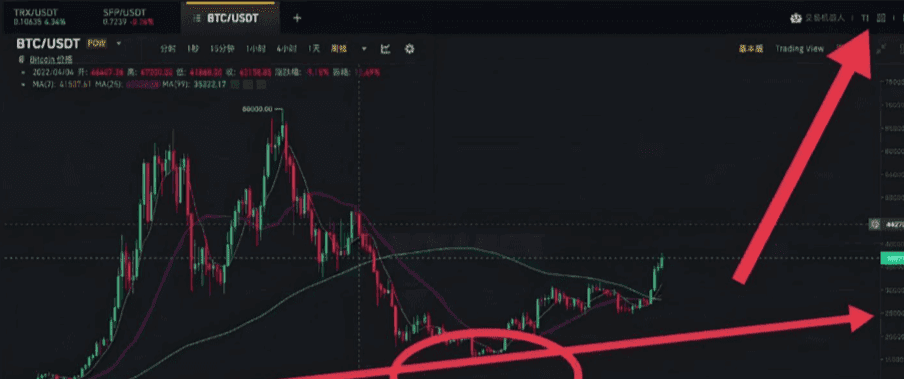
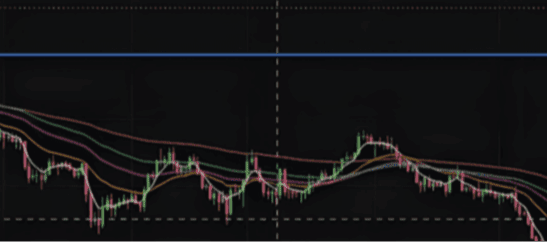
The weekly chart shows a trend from around 1 in May 2022 to a peak price of 12 in April 2024, yielding nearly 11 times the return over two years. From the bottom, it slowly climbs; as long as you are on the ride, it won’t be long before you gain returns, with minimal fluctuations, and it won’t intimidate you. I make money, and I also help you make money, giving you a big brother feeling. Such market makers are rare to encounter! Most are like the one below:
Big bullish candlesticks entice traders, while high points are distributed to retail investors, followed by sharp bearish declines, leaving many small retail investors stuck at high positions, with extremely violent and cruel methods. Such trading techniques are repeatedly used with great enthusiasm. It's difficult to make money in front of such market makers; even if luck allows you to earn a little, you will eventually give it all back, and die a very tragic death.
The cryptocurrency market is not lacking in such market makers, who have ruthless trading methods.
There is a saying in the stock market about 'limit-up genes.' This term also applies in the cryptocurrency market. If this market maker has used such methods before, they are likely to use them again, as each trader has their own character, which reflects in their trading methods. It's easier to change the country than to change one's character, unless a market maker changes.
Of course, there is also a more standard approach, doing washouts when needed, pulling up when necessary, with horizontal consolidation and fluctuations, and a primary upward wave.
By observing the trading methods used by market makers, we can roughly determine what type of market maker they are, and then you can estimate the difficulty of making money in that market, of course choosing the simplest difficulty.
With this basic concept in mind, let's look at the entry points of market makers, also known as the bottoms for bottom fishing.
What is the 'bottom'? Can it be bottom-fished?
Let’s first talk about what forms a 'bottom'. When the price of a currency pair falls to its market value, it indicates that a 'bottom' is about to appear. How do we understand this?
You should all understand the situation with garlic prices. What is the normal value of a pound of garlic? When the price of garlic is inflated by some ill-intentioned capital, it has already deviated far from its market value. If a pound of garlic is 3 yuan and is inflated to 10 yuan, the extra 7 yuan is a bubble. Remember, bubbles are always meant to burst! When this bubble bursts, the price of garlic will drop from 10 yuan to 9, 8, 7... Eventually, the price will drop back to 3 yuan, and people will feel this is its normal price, thereby increasing buying power. At this point, the price will stabilize, and this price will be the bottom price for garlic, which is also its market value.
Of course, this is conceptually speaking. How do we judge from candlestick patterns?
When the value of a commodity is recognized by 'most capital', its value will be in a relatively stable state. This 'most capital' can be seen as the market maker; the value recognized by the market maker essentially reaches its market value.
Next, let’s discuss its logic. When a commodity is suddenly frequently acquired, it cannot remain stable at the original price; the rarer something is, the more valuable it becomes. At this time, the price will rise; once the price rises, buying power will relatively decrease. If garlic becomes expensive, I can only eat scallions! When buying power decreases, the price will seek balance and eventually fall. The next sentence is very important:
If a new low is set again, it indicates that the previous low price was not recognized by the market makers, meaning they did not genuinely acquire it.
When the price falls to a new low again, significant buying power will emerge once more, and the price will rise again, followed by a decline in buying power and a price drop. Note that if the price does not return to the original lowest price at this time, it indicates one thing: 'Capital is continuously acquiring'.
Sustained buying power is the strong support against new lows.
So how to judge the bottom?
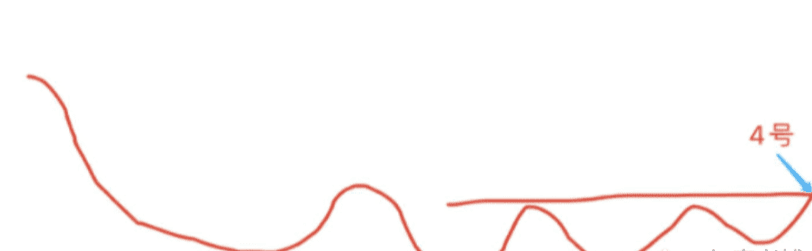
When a currency pair has been falling for a while and hits the first low point, how do you determine if that low point is indeed the bottom?
When the second low point appears, if it sets a new low, it proves that the first low is not the bottom. How to determine if the second point is the bottom? Wait for the third point to appear; if it doesn’t set a new low, it indicates 'Capital is continuously acquiring.' The second point is tentatively judged as the bottom. Why is it tentative? When the fourth point appears, the bottom can basically be confirmed.
You might ask, why not jump in directly when it appeared on the 2nd? By the 4th, the price has already risen somewhat. Isn't that too late?
If you have this thought, you need to re-examine the analysis above. Even if you jumped in, you did not enter on the 2nd but rather on the 1st. Remember, before the 3rd comes out, the 2nd is not the bottom!
Even if you entered on the 2nd, subsequent washouts may shake you out; you may not necessarily capture the entire upward phase. Therefore, it is not about being late; it’s about whether you can make the right judgments. If you can judge correctly 8 out of 10 times, then you can make money.
If you want to rely on luck to catch the lowest point, remember that beneath the bottom, there can be another bottom. Trying to catch a falling knife with empty hands will definitely lead to injury.
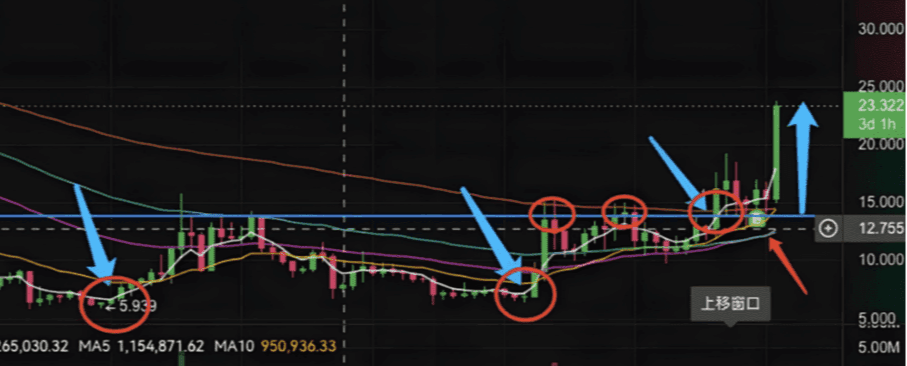
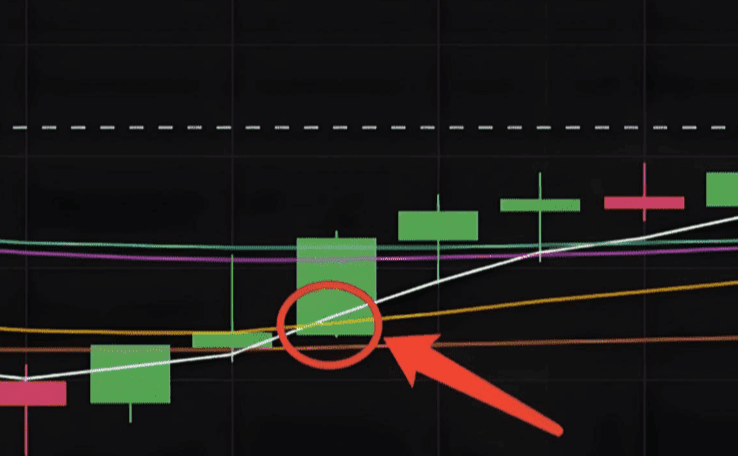
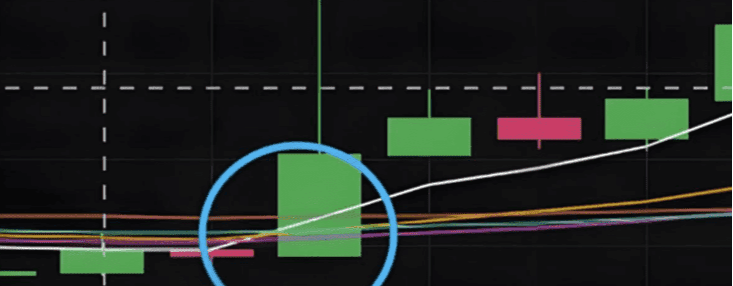
The red arrows in the chart indicate actual buying points. Open any candlestick chart and simulate it. When you think back, what inevitably happens during a complete decline or rise? It will inevitably experience a turn. Think carefully about what a turn is.
Six: Riding on the coattails of market makers in the cryptocurrency market.
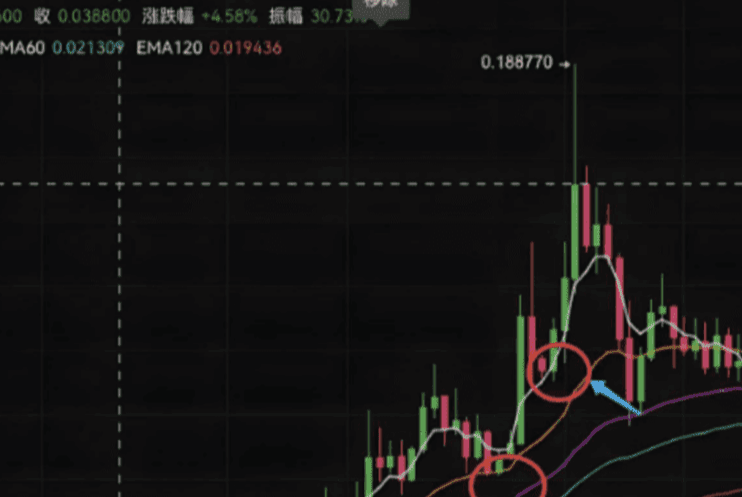
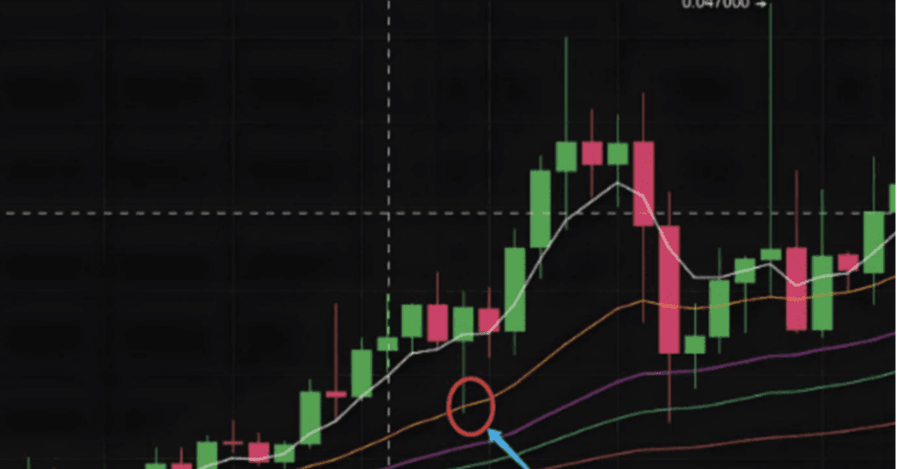
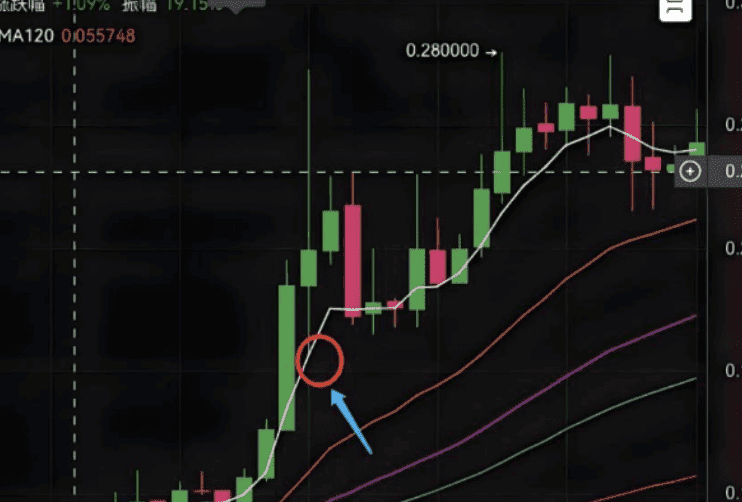
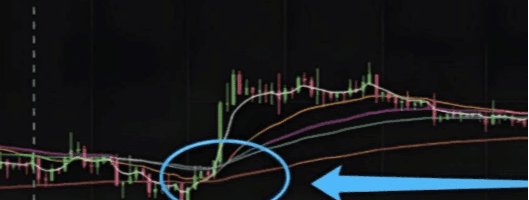
Let’s talk about a trading strategy: Every dip during an upward trend presents an opportunity to enter the market, and every rise during a downward trend gives a signal to exit. Let’s look at a few charts to get a feel for it:
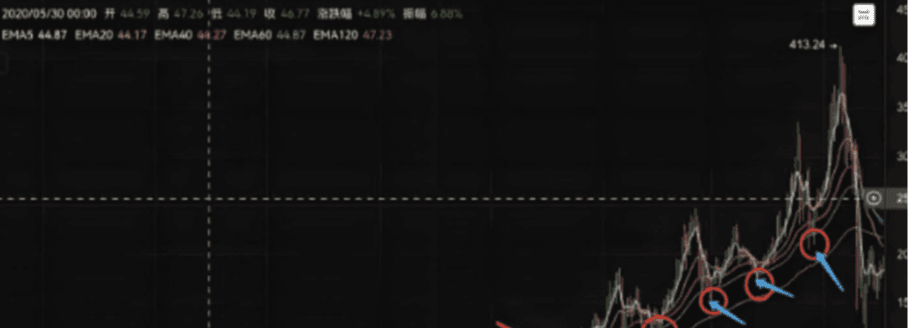
First, think of a question: does such a powerful market maker have weaknesses?
Yes, this weakness is the market maker's throat, and what we need to do is hit it right.
When a market maker infiltrates a currency pair and begins to collect chips, it is unlikely that this currency pair will set new lows; you will know: oh, this market maker has started to infiltrate. Even if there are sporadic events that hit new lows, they will quickly bounce back. Once the main force collects enough chips, they must initiate a price increase. Even if many retail investors jump on board at this time, the market maker must raise the price because they have enough chips. What we need to do is ride this wave and share the profits.
The previously mentioned bottom-fishing position is precisely located at the market maker's throat.
So when does the trend start? When a currency pair no longer sets new lows, it indicates that market makers have entered, signaling that an upward trend has begun. This is the trend.
Remember, once the trend kicks off, every dip provides an entry opportunity that should not be missed.
There will be many retail investors following during the upward process. The purpose of the downturn is to wash out, but the reality is that when prices rise, you buy at high points, and during washouts, you panic at low points and sell at a loss, pulling up your trading records to see how absurd it is.
Remember, during an upward trend, every dip is merely a washout. Do not think that every drop means the currency is failing, that it’s going to zero, or that it will be delisted; it is just a washout. A washout is at most a false move; why be afraid of false moves? Even if you do not know where to buy or sell, as long as you have this concept in your mind, you have already surpassed 80% of retail investors. At least the candlestick has a large framework in your eyes; as long as there is a large framework, you will have confidence, and the rest is patience.
Some might say, this is because the candlestick chart has already formed; how do you know if it hasn’t formed yet?
Do not be stubborn, do not get stuck in a narrow mindset; think, what is the logic of this process!
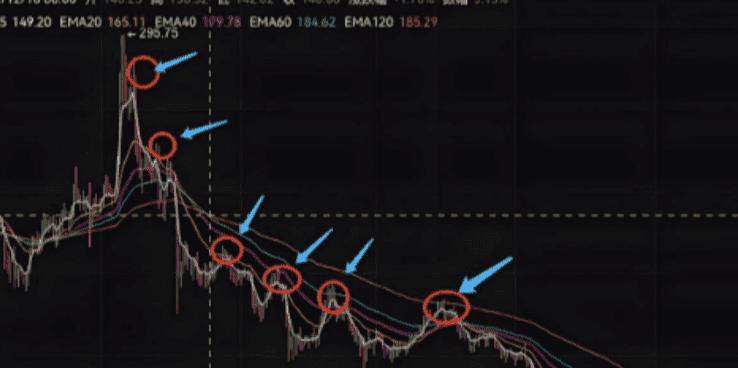
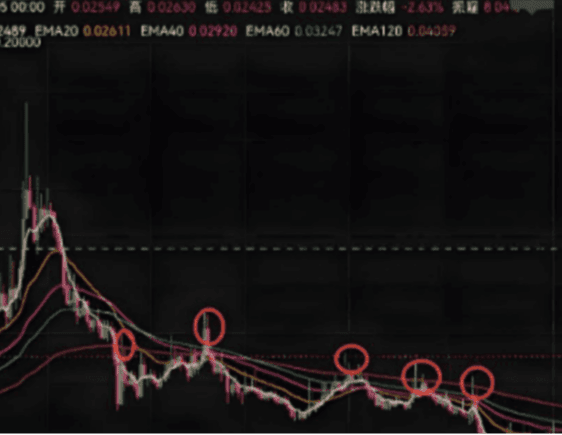
As the saying goes, the one who can buy is an apprentice, but the one who can sell is a master. Market makers often act subtly to prevent you from noticing they are exiting, so the difficulty of exiting compared to bottom fishing increases significantly. The reality is, if you, as a retail investor, happen to be at a high point, that's your luck. You can't consume the entire journey from fish head to fish tail; consuming a segment is enough for you to digest. Exiting before the market makers do is crucial for securing your profits.
As for how to judge if it's a top, one way is to look at volume, and another is to see if the currency price will set new highs again. This will be discussed in a later article specifically focused on how to judge the market maker's top.
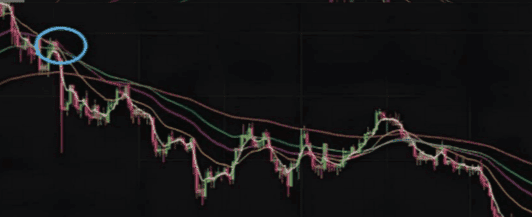
The trading method mentioned at the beginning also includes an ultimate skill: the spike.
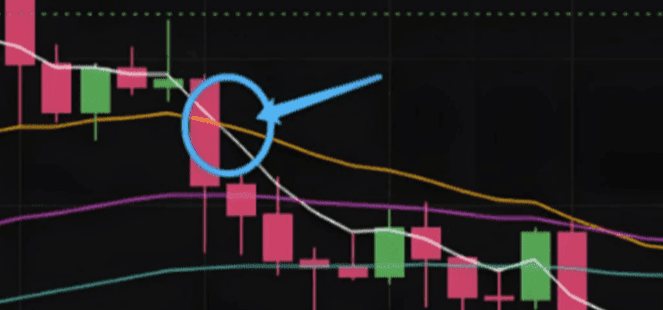
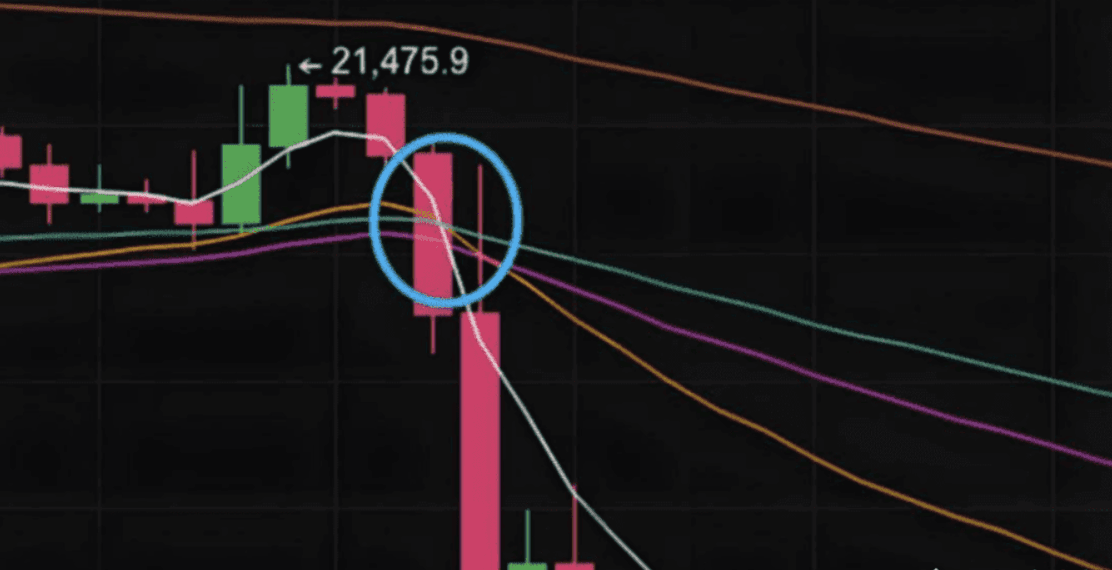
Among these washout techniques, I particularly love the spike, especially large spikes. When I see such spikes, it instinctively excites me. Because I know exactly what the main force wants to do at this moment, I call this pattern a slingshot: the tighter the slingshot is pulled back, the farther it will shoot. For example:
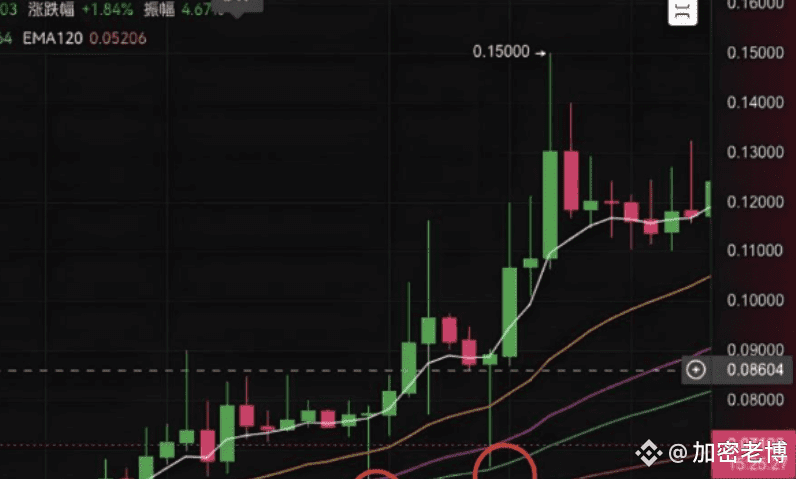
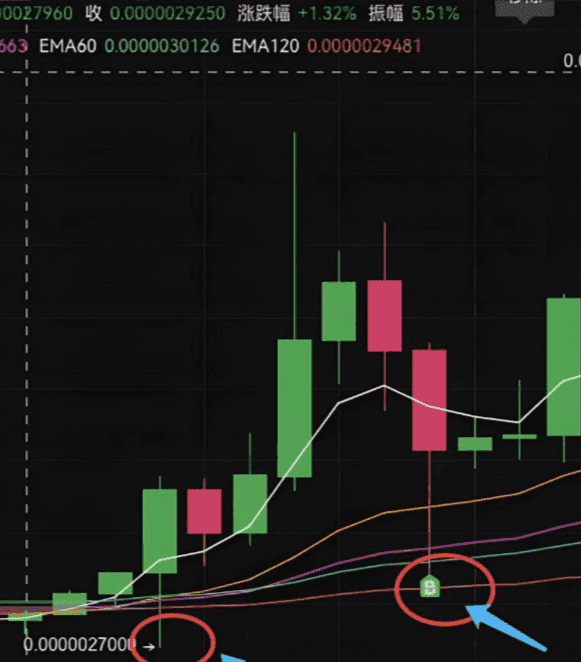
So, are spikes scary? Not at all; they can even be somewhat charming, but only if they occur during an upward trend. Conversely, when the currency price reaches two or three times the profit, it can even reach ten or a hundred times the profit in the cryptocurrency market. It is no exaggeration to say that even if you can secure 50% during this process, you are already at the peak of the retail investor pyramid. Once: the price no longer sets new highs, be cautious. Remember these 12 words. Once an avalanche occurs, it will be catastrophic; every rise is an opportunity to escape. Don’t hope for a little more rise; don’t hesitate, or it could be a long-term loss. There is an extremely dangerous operation within this: trying to catch a rebound. The returns are low, but the risks are extremely high; it's like trying to take chestnuts from the fire, which is not worth the trouble.
Seven: Trading strategies in cryptocurrency market manipulation. Let's first take a look at how resistance and support levels are formed.
It can be said that resistance levels are formed by the collective strength of retail investors; in this area, retail investors are still very united. When a peak is littered with retail investor losses, these losses will become numb and indifferent.
An interesting phenomenon is that whether in the stock market or cryptocurrency market, after many declines, it becomes inconsequential; a slight rise makes you anxious to sell, fearing profit retraction. The real approach is to cut losses timely and hold onto the trend patiently for harvest. After enduring hardships for decades, grabbing just a couple of points is pure waste of time!
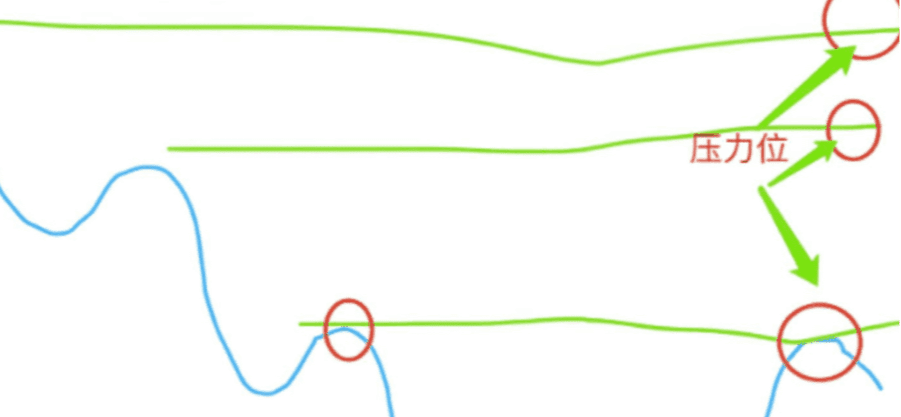
When the price returns to this position again, people will scramble to exit their positions. People really only learn to cherish after losing something. After waiting so long, this point has come back; can you not be excited? Due to the massive selling pressure from exiting positions, this resistance level is formed and possesses suppressive power.
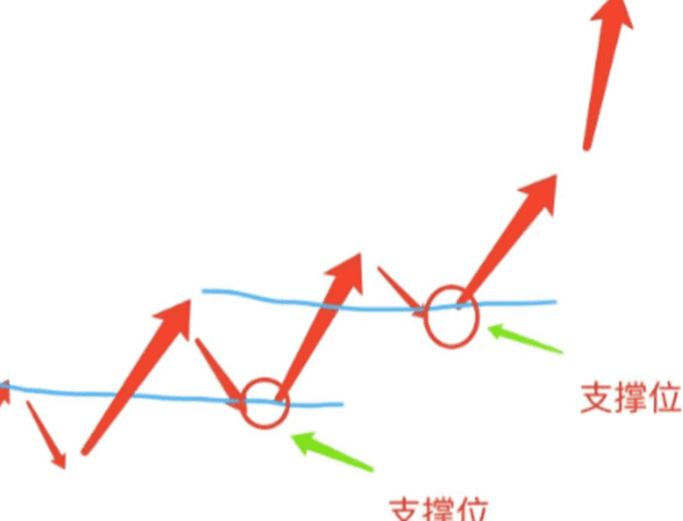
So how are support levels formed?
The same principle applies; support levels often only function within an upward channel. When previous high points see many retail investors chase higher prices, when the coin price retraces to that level again, due to the market's bullish sentiment, selling volume becomes minimal, thus forming an effective support level. Prices often rebound from this point.
The above is also a common tactic used by some market makers: penetrate, withdraw, pressure, and pull back. However, under the mechanisms of the cryptocurrency market, some market makers have reduced such plays, using them only once or twice before the price reaches the ceiling.
Remember, there are no absolute support levels, nor absolute resistance levels. Support and resistance only function within a fixed trend; there are no unbreakable resistance levels, nor are there support levels that cannot be broken. Therefore, merely drawing lines is of no use; the trend is the overall framework; without a framework, any indicator lacks judgment.
How to judge the trend? You can refer to the basic logic introduced in previous articles. If you understand it, you won't ask this question again. Some might say, I can just buy a robot; do I need to look at the trend? It directly gives buy/sell strategies.
I can tell you: all the strategy trading robots, or various single and composite indicators, like Bollinger Bands, Volume Oscillator, Triple Indicator Average, etc., you will find that even if you learn them, you still don’t understand because all trading strategies share a commonality: lagging. Trading signals are given only after the candlestick has formed; what’s the use of that?
Let’s talk about strategy trading robots, especially those so-called trading tools on the market where the system automatically gives buy/sell signals. At first glance, the signals provided are impressive. If you think that way, I also think your intelligence is impressive; if you don’t cut your losses, who else will? I have also experimented with many trading strategies in forex systems, and the results were all artificial intelligence failures. My nickname, Night Watchman, is also the name of a powerful private fund; however, it becomes just another AI failure if removed from human operation.
Think about it simply: if one day artificial intelligence could do candlestick analysis, the financial system would be on the brink of collapse; all trading strategies would either cut losses or require human judgment to work. Only these two types exist, so valuable strategy systems are used by insiders, while worthless ones are used to cut losses.
Eight: Basic indicators for market manipulation in the cryptocurrency market.
What should a normal market contain?
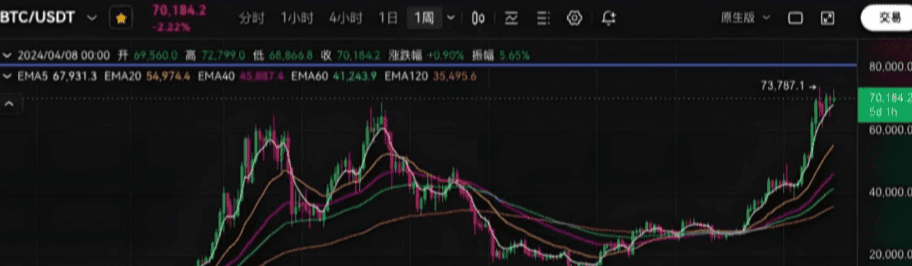
Generally, the entire market is divided into two main parts, with the option to focus solely on the main chart based on personal habits. Let's look at the main chart first: What indicators are typically used on the main chart? Personally, I prefer the Exponential Moving Average (EMA), though some use the Simple Moving Average (MA). What is the difference between MA and EMA? A simple explanation of MA is that it averages several days of stock prices and connects them into a line. For example, the 5-day moving average: average the prices from the first to the fifth day to produce one value, then average the prices from the second to the sixth day to produce another, and so forth, connecting these values into a line to form the 5-day moving average.
How to understand? If the current price is above the 5-day moving average, it means that market buying power has been relatively strong over these five days. Conversely, it indicates that market buying power has been continuously decreasing. Five days is too short; what if we change it to a 120-day moving average? This means that if the market price stands above the 120-day moving average, it indicates that the buying power over these 120 days has been continuously rising. What signal does this send? Short-term buying may be volatile, but long-term buying will form a trend. Thus, the 120-day moving average plays a role in judging medium to long-term trends.
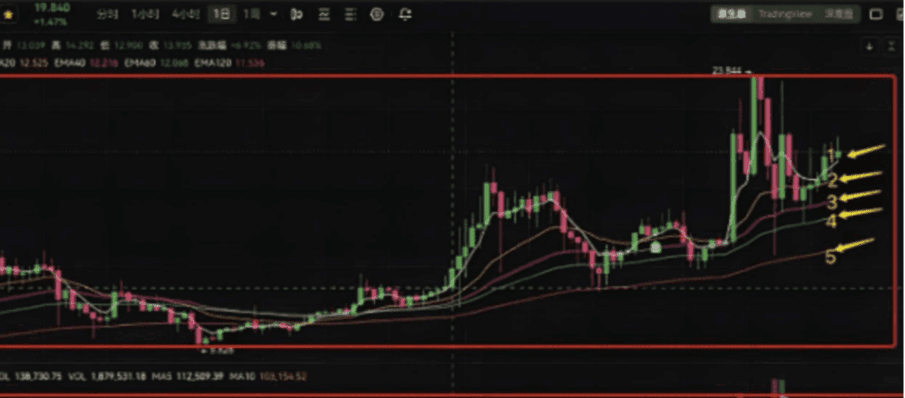
If the price successfully rises above the 120-day moving average, it indicates a potential medium to long-term upward trend ahead. This is the significance of moving averages. What about EMA? It is an algorithm based on MA, and the calculation is relatively complex. Its characteristic is to increase the sensitivity of MA, allowing the average to adjust quickly during significant short-term price changes. In the chart, 12345 respectively represent EMA5, 20, 40, 60, and 120-day lines. Personally, I choose EMA because it is smoother than MA, visually appealing, and enhances judgment accuracy. The difference is not significant; I recommend the latter for short-term trading. The relationship between moving averages and price: price is like a playful dog, while the moving average is like a leash. When the dog runs too far, tension builds between the leash and the dog. However, the moving average only cares about the price and not about volume combinations, so market makers create various traps for both bullish and bearish scenarios using moving averages.
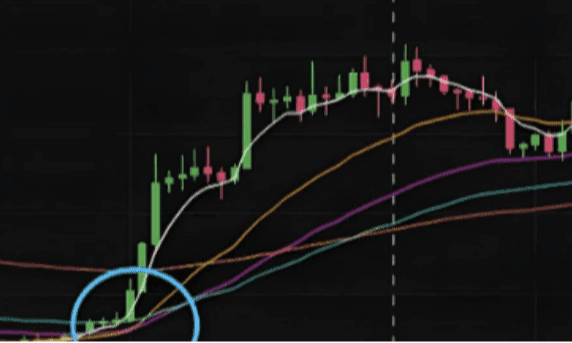
Remember: discussing price without considering volume is just fooling around. Take a look at the perfect arrangement of these moving averages:
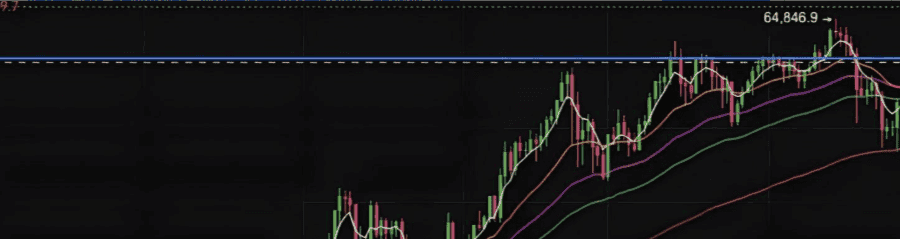
Situations where moving averages provide support.
Situations where moving averages exert pressure. Take a closer look. How can we use moving averages to help us judge better? What do indicators derived from moving averages like: golden cross, death cross, price support, price pressure, golden spider, and death spider mean respectively? Golden Cross: A crossover formed when a short-term moving average crosses above a long-term moving average, providing support for short-term prices. As illustrated:
In the chart, there are two golden crosses: one formed when the 5-day moving average crosses above the 10-day moving average, and another when the 5-day crosses above the 20-day moving average, resulting in a short-term price rise. The 5-day golden cross indicates that those who bought within 5 days are willing to pay above the average price of 10 days, thus short-term demand exceeds supply, and the price naturally rises.
In the chart, the crossover formed when the 5-day moving average crosses below the 10-day moving average is called a death cross, which exerts pressure on the price in the short term. Golden crosses and death crosses play a role in judging the next trend to a certain extent. However, they also have lagging effects, and if they are short-term moving averages, they have even more limitations. How can we enhance their power? Multiple crossovers appearing simultaneously: golden spider and death spider.
The chart shows a typical death spider: the 5-day crosses below the 10-day and 20-day moving averages, while the 10-day crosses below the 20-day, forming a shape reminiscent of a spider with six legs. It carries a strong bearish warning.
Conversely, when the 5-day crosses above the 10-day, the 5-day crosses above the 20-day, and the 10-day crosses above the 20-day, the resulting shape is called a golden spider. The appearance of a golden spider indicates the arrival of a bullish trend. The spider's appearance often foreshadows the trend for the time ahead because it involves three periods simultaneously. How long the trend lasts depends on the periods of the moving averages involved. The same principle applies; as long as there is a moving average crossover, it has a lagging characteristic. How to enhance its stability and longevity? Thus, it extends further: price support and price pressure. Price support: Formed when the 5-day moving average crosses above the 10-day moving average, the 10-day moving average crosses above the 20-day moving average, and the 5-day moving average crosses above the 20-day moving average, forming a triangle of three intersection points that supports prices for a certain period ahead.
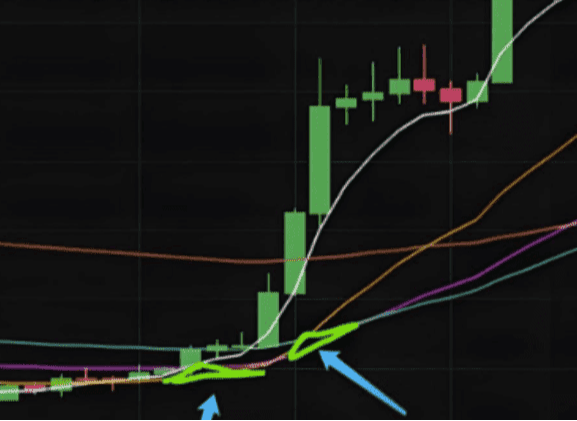
Not only did it form price support, but it also created a double price support. It has been proven that a long upward trend lasting three months followed.
Price Pressure: The triangular area formed by the intersection of the 5-day moving average crossing below the 10-day moving average, the 5-day crossing below the 20-day, and the 10-day crossing below the 20-day has a suppressive effect on prices for a certain period in the future.
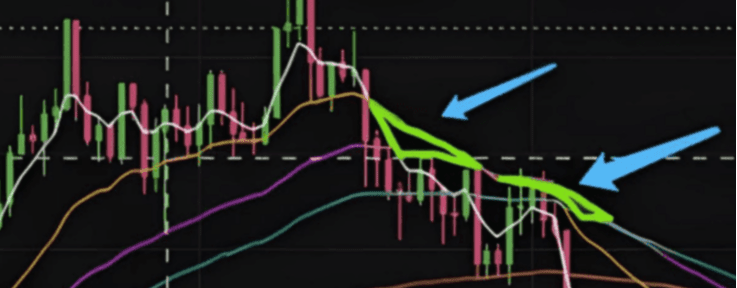
This is also a double price pressure pattern. Under this price pressure, the price has fallen for an entire year.
Therefore, typically the beginning of a trend is often preceded by a price support or price pressure pattern. Two price support or pressure patterns have higher stability. When such patterns appear, bulls can enter at low points, and vice versa. Note: except for sideways and fluctuating markets.
The above is a summary of over ten years of practical experience and techniques in cryptocurrency trading. It may not be applicable to everyone; each person needs to adapt and summarize based on their own practice. As a trader, the most frightening thing is not the technical issues you face, but rather your insufficient understanding, falling into these trading traps without realizing it! There is no invincible trading system, only invincible users of trading systems! This is the truth; trading systems ultimately return to the individual!
I am Mu Qing, having experienced multiple bull and bear markets across various financial fields, with rich market experience. Here, I penetrate the fog of information to discover the real market. Seize more opportunities for wealth and identify genuinely valuable opportunities; don’t miss out and regret it!
Mu Qing only engages in real trading; the team still has positions to get on board quickly.

