In short
When you open any chart on a trading platform, you will notice colored bars at the bottom of the chart representing trading volume, but many beginners do not know its importance or how to use it.
---
1️⃣ What is trading volume?
Trading volume is the total amount of currency that has been bought and sold in a specific time period.
For example: If 1000 Bitcoins were traded in one day, this is the trading volume for that day.
---
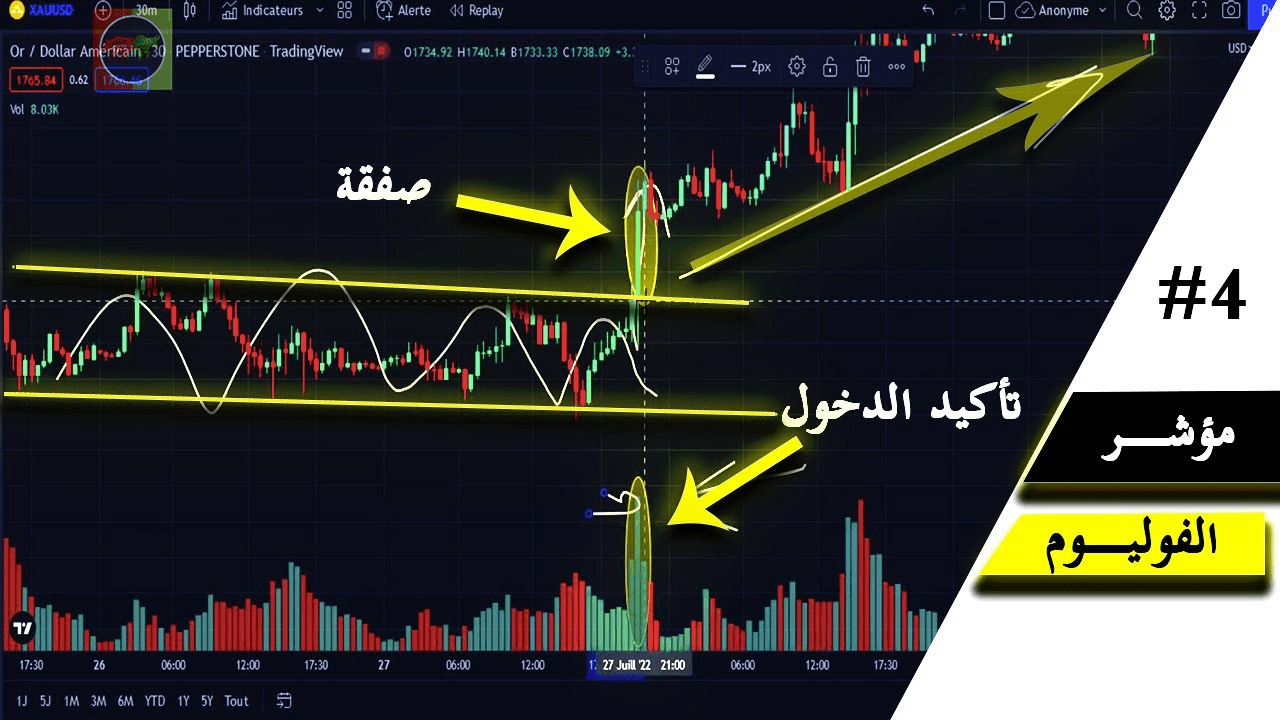
2️⃣ How is it displayed on the chart?
It usually appears as vertical bars below the chart:
Green bar = larger trading volume in buy transactions.
Red bar = larger trading volume in sell transactions.
---
3️⃣ Why is trading volume important?
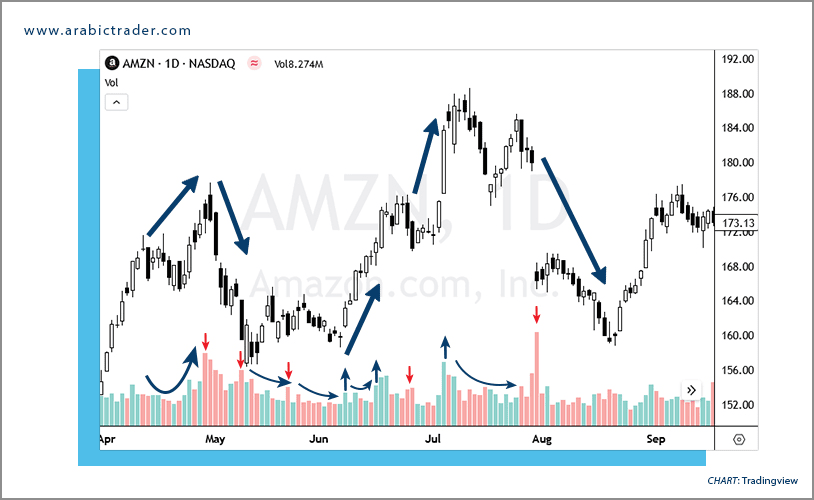
Confirming the trend: If the price rises with high trading volume, it often means that the trend is strong and real.
Identifying false movements: If the price moves a lot but with weak trading volume, the rise or fall may just be a misleading movement.
Identifying reversal points: Sometimes a significant increase in trading volume at strong support or resistance means that the price may change direction.
---
Trading volume is a simple yet powerful tool for understanding market strength and the authenticity of price movements.
Don't just look at the price... trading volume is the voice that tells you what is happening behind the scenes.
In short, this is a series aimed at simplifying and explaining some trading and technical analysis concepts for beginners.
That's it, follow me for more.
With my regards ♥♥♥
