

Ethereum traded sideways between $1,850 and $4,150 in 2024 before breaking out in early 2025 on strong momentum.
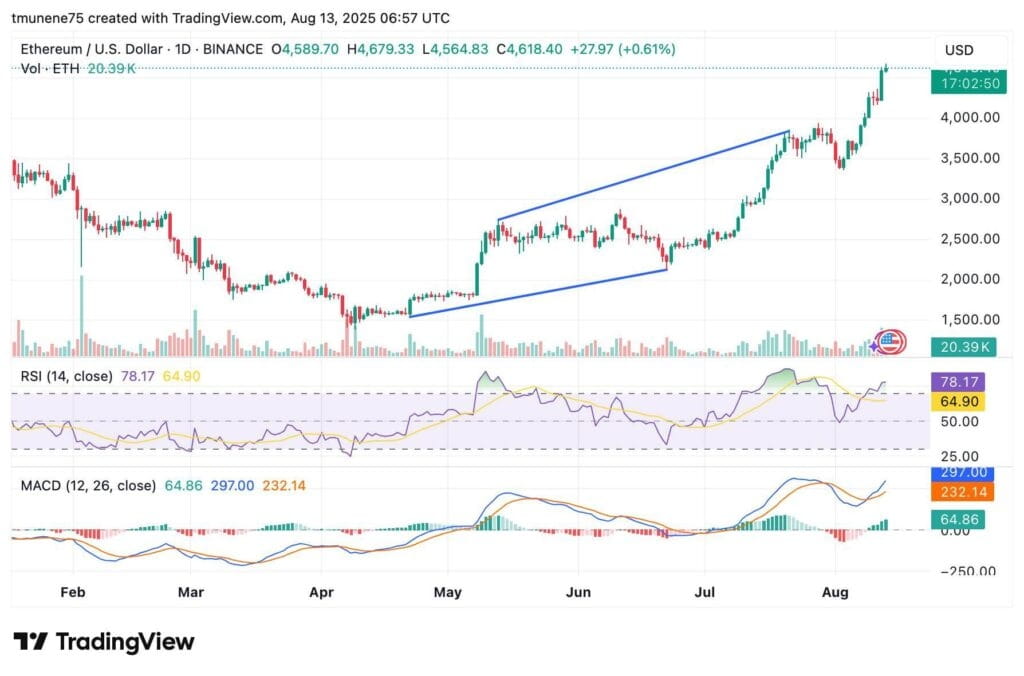
RSI at 78.17 signals strong momentum but hints at a possible short-term cooling before the next upward leg.
MACD’s bullish crossover above $3,800 supports the projection of a rally toward $10,000–$13,000 by mid-2025.
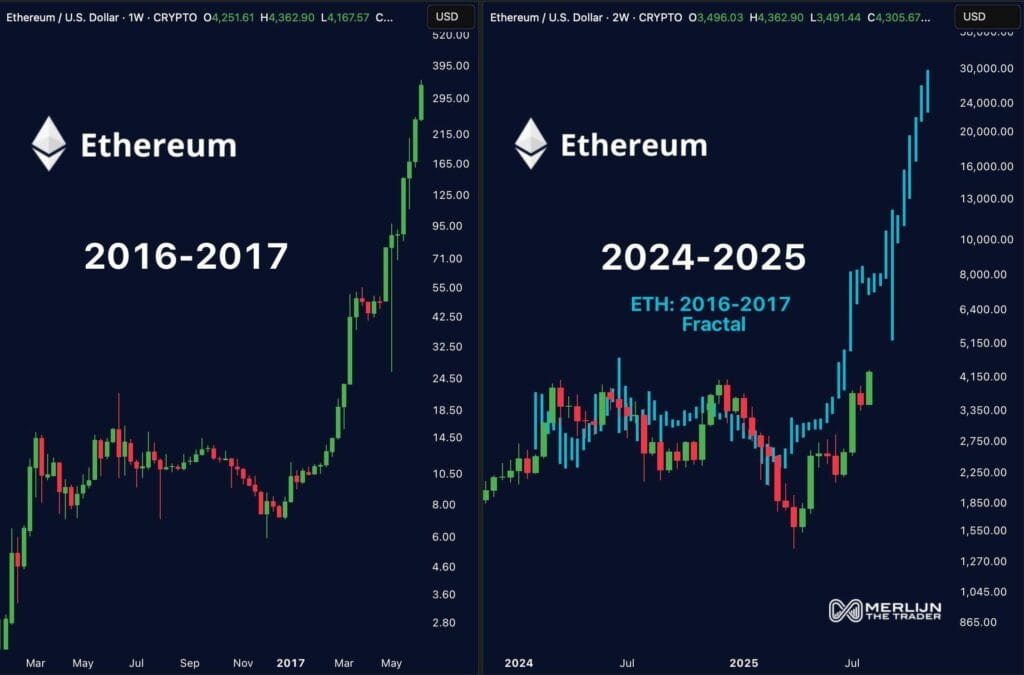
Ethereum is showing technical patterns that some analysts say resemble its explosive 2016–2017 market phase. Analyst Merlijn The Trader compared the current setup to the last breakout, noting that in the previous cycle, retail investors drove the rally.
This time, he stated, activity extends to both retail traders and institutional firms, supported by expanding global adoption. He emphasized that once Ethereum’s price breaks decisively, the move could be fast, leaving little potential for late entries.
Historical Pattern Suggests Potential Large Scale Upside
Between 2016 and early 2017, Ethereum traded in a tight range between $6 and $20 before breaking sharply higher. The breakout sent prices from around $10 to more than $395 in a sustained rally with minimal retracements.
Weekly market data from that period showed accelerating gains, with large green candles and strong buying momentum dominating the trend. In the current cycle, Ethereum traded sideways between $1,850 and $4,150 for most of 2024.
 Ethereum price outlook chart, Source: Merlijn The Trader on X
By mid 2025, it broke above this range, forming a pattern similar to the earlier cycle but on a larger scale. The technical projection based on this pattern outlines potential gains toward $10,000–$13,000 by late 2025. If buying strength continues at the current pace, analysts see further upside possibly reaching $20,000–$30,000 in an extended rally phase.
Technical Indicators Point to Strong Momentum
Ethereum’s breakout above $4,000 has been supported by rising trading volume, indicating strong accumulation rather than speculative exhaustion. Volume spikes have aligned with large bullish candles, supporting the upward move.
 ETH/USD 1-day price chart, Source: TradingView
The RSI is at 78.17, placing it in overbought levels. While this suggests strong momentum, it also raises the possibility of short term cooling. In April, similar RSI levels were followed by minor corrections before the trend resumed.
The MACD line is at 297.00, well above the signal line at 232.14. The histogram is at 64.86, confirming a bullish crossover that occurred in late July as Ethereum moved past $3,800.
Price Scenarios for the Coming Months
A bullish extension would have Ethereum advance towards $4,800–$5,000 before reaching new all time highs. Ongoing above $5,150 would include the possibility of a multi thousand dollar increase in the near future.
Failure to hold above $4,150–$4,300 would initiate a pullback, which could extend the range extension phase before a further breakout attempt. Currently, price structure, momentum indicators, and volume patterns are positive.
The post Analyst Predicts Ethereum Could Repeat Historic Rally with Unstoppable Global Momentum appears on Crypto Front News. Visit our website to read more interesting articles about cryptocurrency, blockchain technology, and digital assets.
