Bitcoin (BTC) and Ripple (XRP) are maintaining a stable position just below key resistance levels; a breakout through this mark could trigger a new wave of increases. Meanwhile, Ethereum (ETH) bulls are dominating the market, pushing prices above $4,500 and nearing the target of conquering the historical peak of $4,868.
Bitcoin could break out if it closes above the psychological level of $120,000.
On Monday, Bitcoin (BTC) reached the important psychological resistance level of $120,000 before pulling back slightly. The next day, the world's largest cryptocurrency continued to attempt to break through this barrier but has not yet succeeded. As of Wednesday afternoon, BTC was fluctuating around $119,500, indicating that the market is in a phase of fierce tug-of-war.
If it can close the session above the $120,000 mark, Bitcoin is likely to extend its upward momentum towards testing the record peak of $123,218. Breaking this mark will open up a 'price exploration zone,' with the next target set at the psychological milestone of $125,000.

Current technical signals are leaning towards the bulls: the Relative Strength Index (RSI) on the daily chart reached 59, surpassing the neutral threshold of 50, reflecting that upward momentum still prevails. Additionally, the MACD indicator recorded a bullish cross on Monday, signaling a buy and reinforcing bullish expectations.
Conversely, if BTC continues to fail at the $120,000 threshold and corrects, the nearest support area around $116,000 on the daily chart will serve as a 'support point' for the price.
Ethereum bulls are targeting the historical peak of $4,868.
Ethereum had an impressive breakout when it surpassed the $4,000 mark on Saturday, then continued to soar, closing above the peak of December 9, 2021, at $4,488 on Tuesday. By Wednesday afternoon, this cryptocurrency still maintained its upward pace, trading around $4,640.
If the bullish momentum continues, ETH is likely to challenge the record of $4,868 set on November 10, 2021.
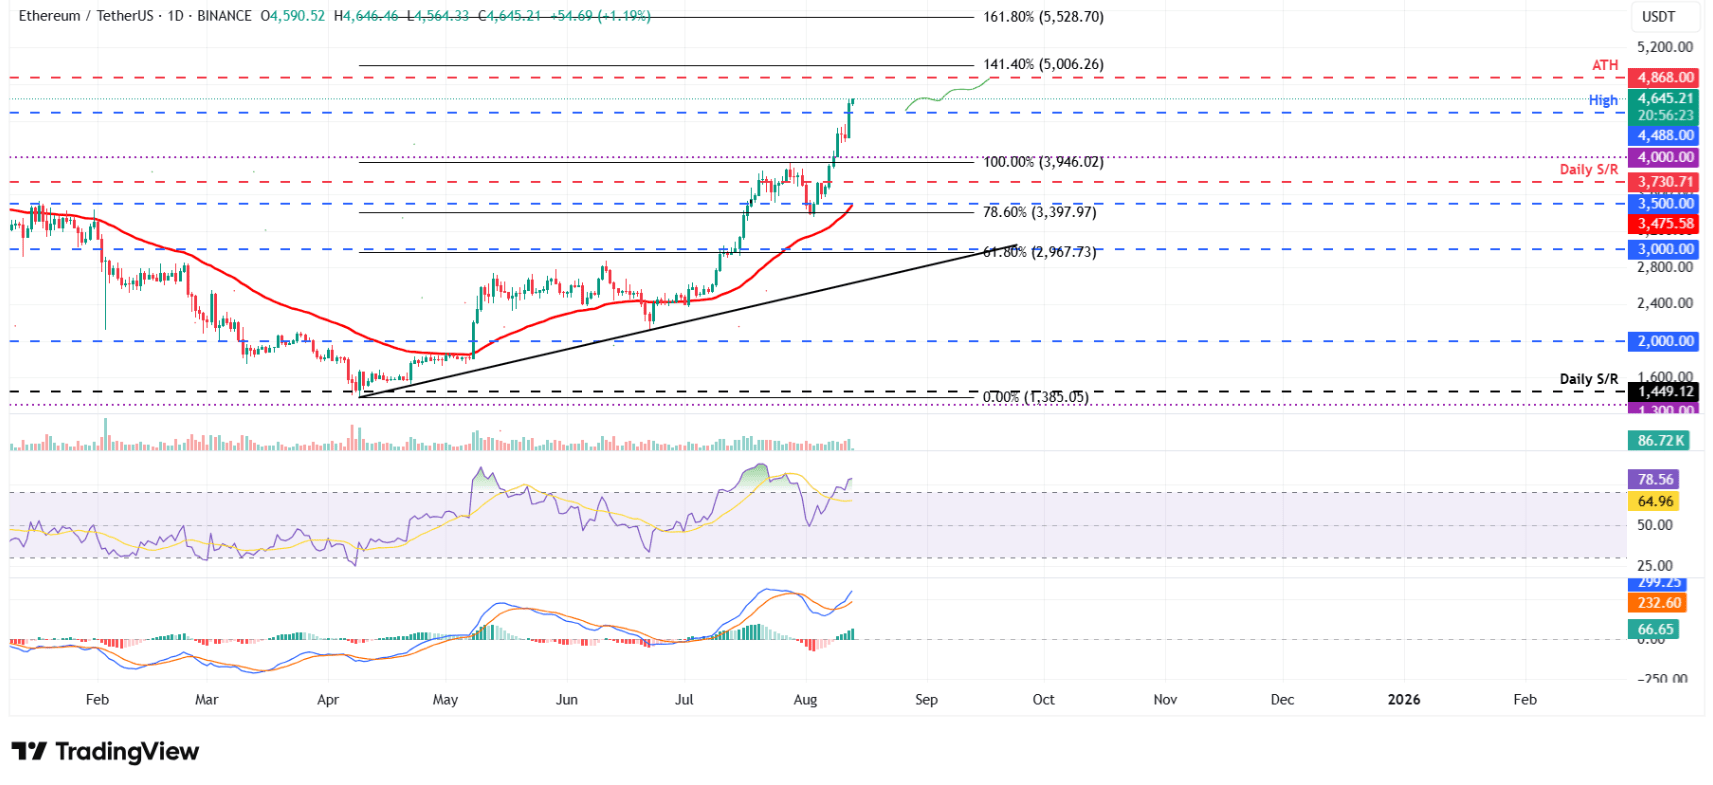
On the daily chart, the RSI reached 78 — well above the overbought zone and still trending upward, reflecting strong demand. At the same time, the MACD indicator has formed a 'bullish cross' since Saturday, with the green histogram bars expanding, reinforcing confidence in a bullish scenario.
However, in the event of a correction, the $4,488 mark will be the most notable support area.
XRP could reach a new peak if it breaks the resistance at $3.40.
XRP's price was halted at the resistance level of $3.40 on the daily chart on Friday, then lost 5% of its value within 5 days. However, the downtrend paused when XRP surged 4.41% on Tuesday, closing at $3.26. As of Wednesday afternoon, the price continued to fluctuate around $3.22.
If it breaks and closes above $3.40, XRP could trigger a new surge, heading straight for the historical peak of $3.66.
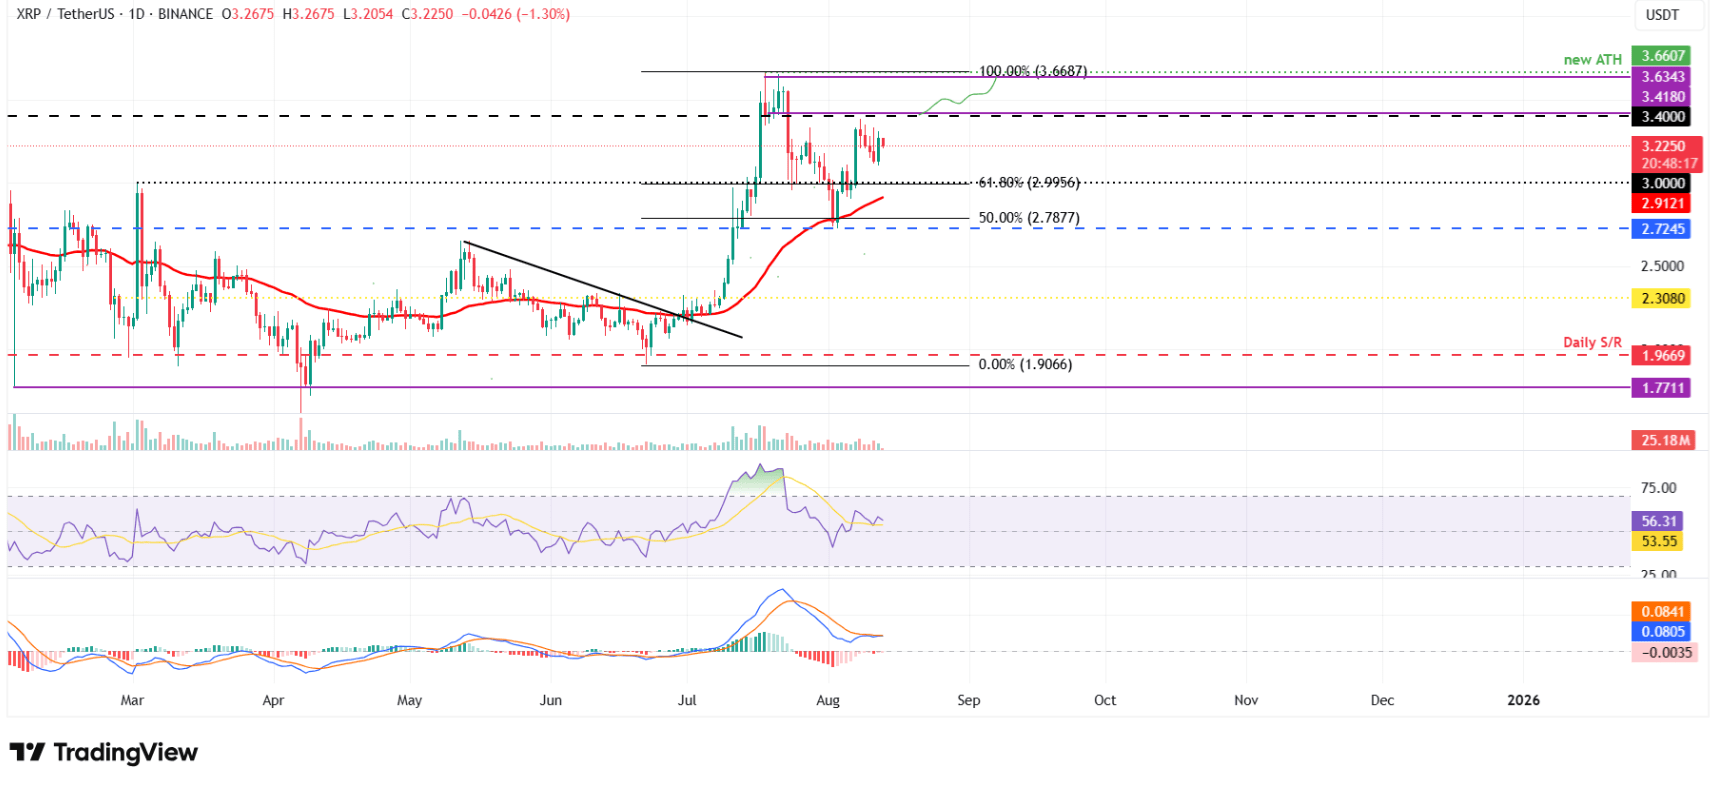
On the daily chart, the RSI index reached 56 — surpassing the neutral threshold of 50 — indicating that upward momentum is gradually increasing. At the same time, the MACD lines are narrowing their gap, reflecting investor hesitation. To reinforce the upward trend, the MACD needs to form a bullish cross similar to what ETH and BTC have recently shown.
Conversely, if it continues to fail at $3.40 and faces selling pressure, XRP could retreat to the 61.80% Fibonacci retracement level around $2.99.