

The price of Ethereum is at $4,403 on August 12, 2025, at 10:45 AM Eastern Time, supported by a market capitalization of $530.27 billion and a 24-hour trading volume of $43.98 billion. The day's range extends from $4,196 to $4,435, highlighting high volatility as traders test key resistance levels.

Ethereum
On the daily chart, Ethereum (ETH) maintains a strong upward trend, with the price rising from around $2,112 to a recent high of $4,435. Higher lows and highs reinforce the upward trend, but small candles near the peak suggest short-term hesitation. The $4,000 level remains a strong support zone, while $4,435 acts as immediate resistance. A period of accumulation or slight adjustment is likely before another breakout attempt, especially as momentum indicators like the moving average convergence divergence (MACD) and momentum both indicate buying strength.
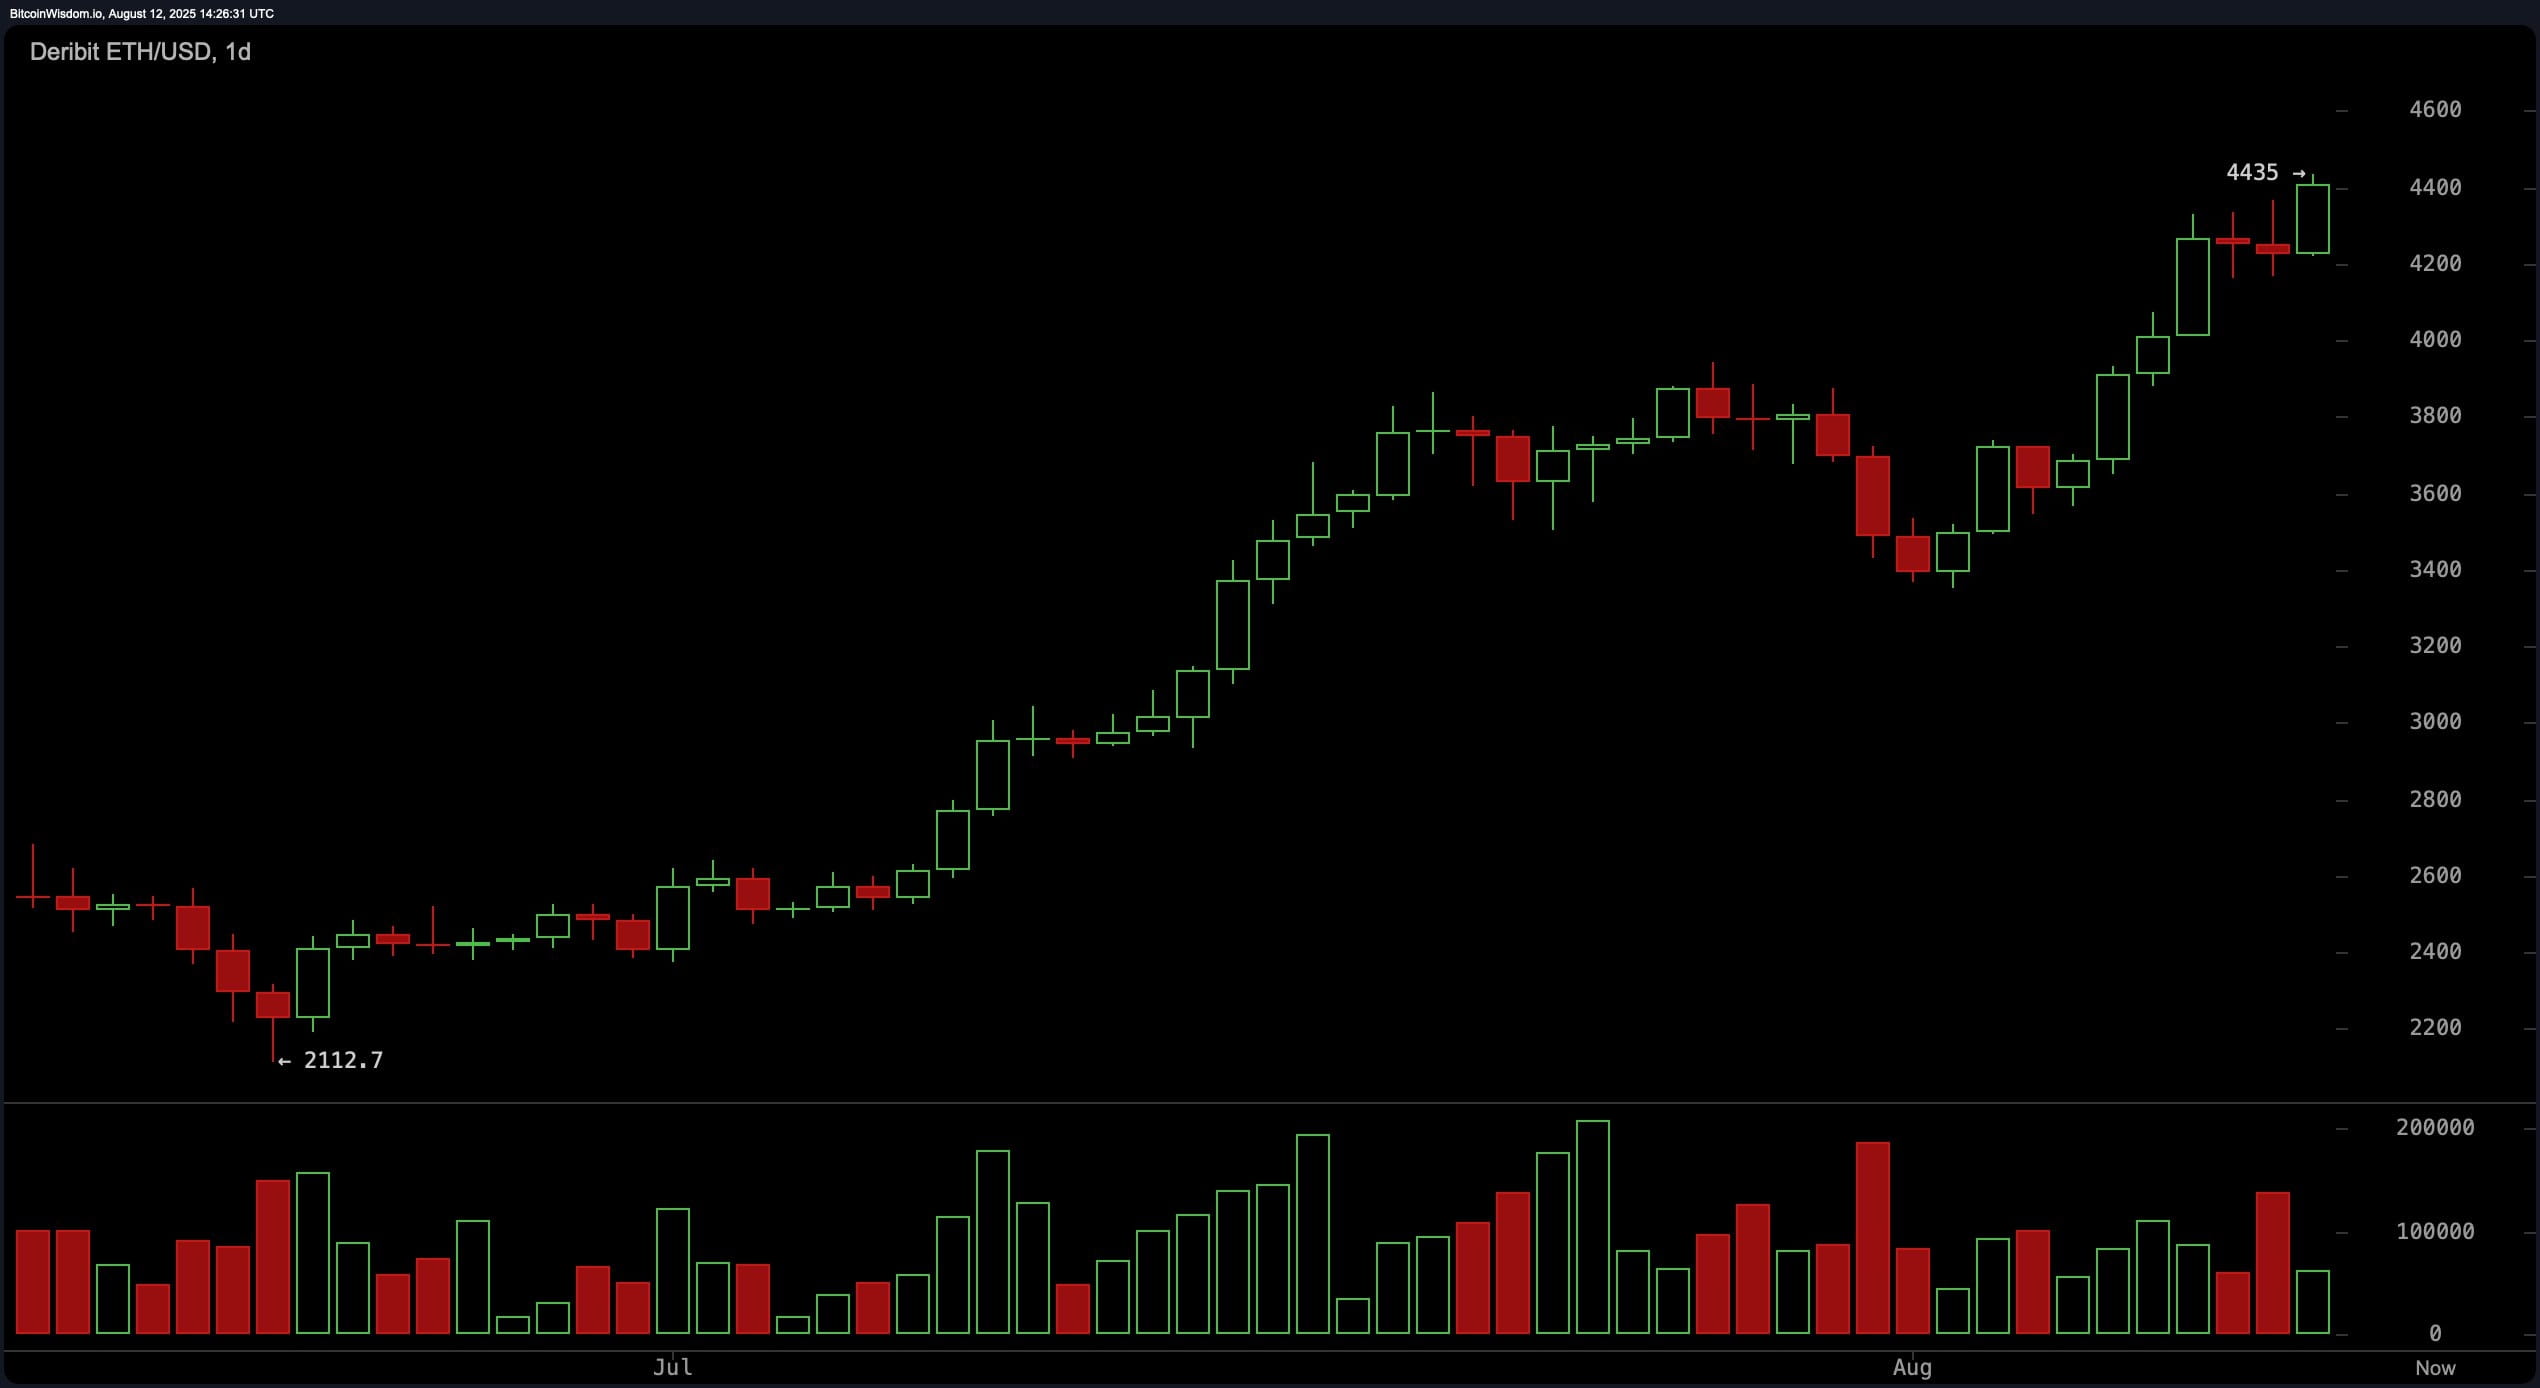
ETH/USD 1-Day Chart via Deribit on August 12, 2025.
The 4-hour Ethereum chart shows a strong rally from $3,351 to $4,435, with a significant breakout above $4,300 triggering an increase in buying volume. This move indicates strong participation from bulls; however, the price may retrace to the $4,300–$4,320 range to confirm it as support. If buyers defend this area, the path toward re-testing and potentially breaking above $4,435 will be strengthened. The exponential moving averages (EMA) and simple moving averages (SMA) across all timeframes, from 10 to 200, remain in the buy zone, reinforcing the bullish trend.
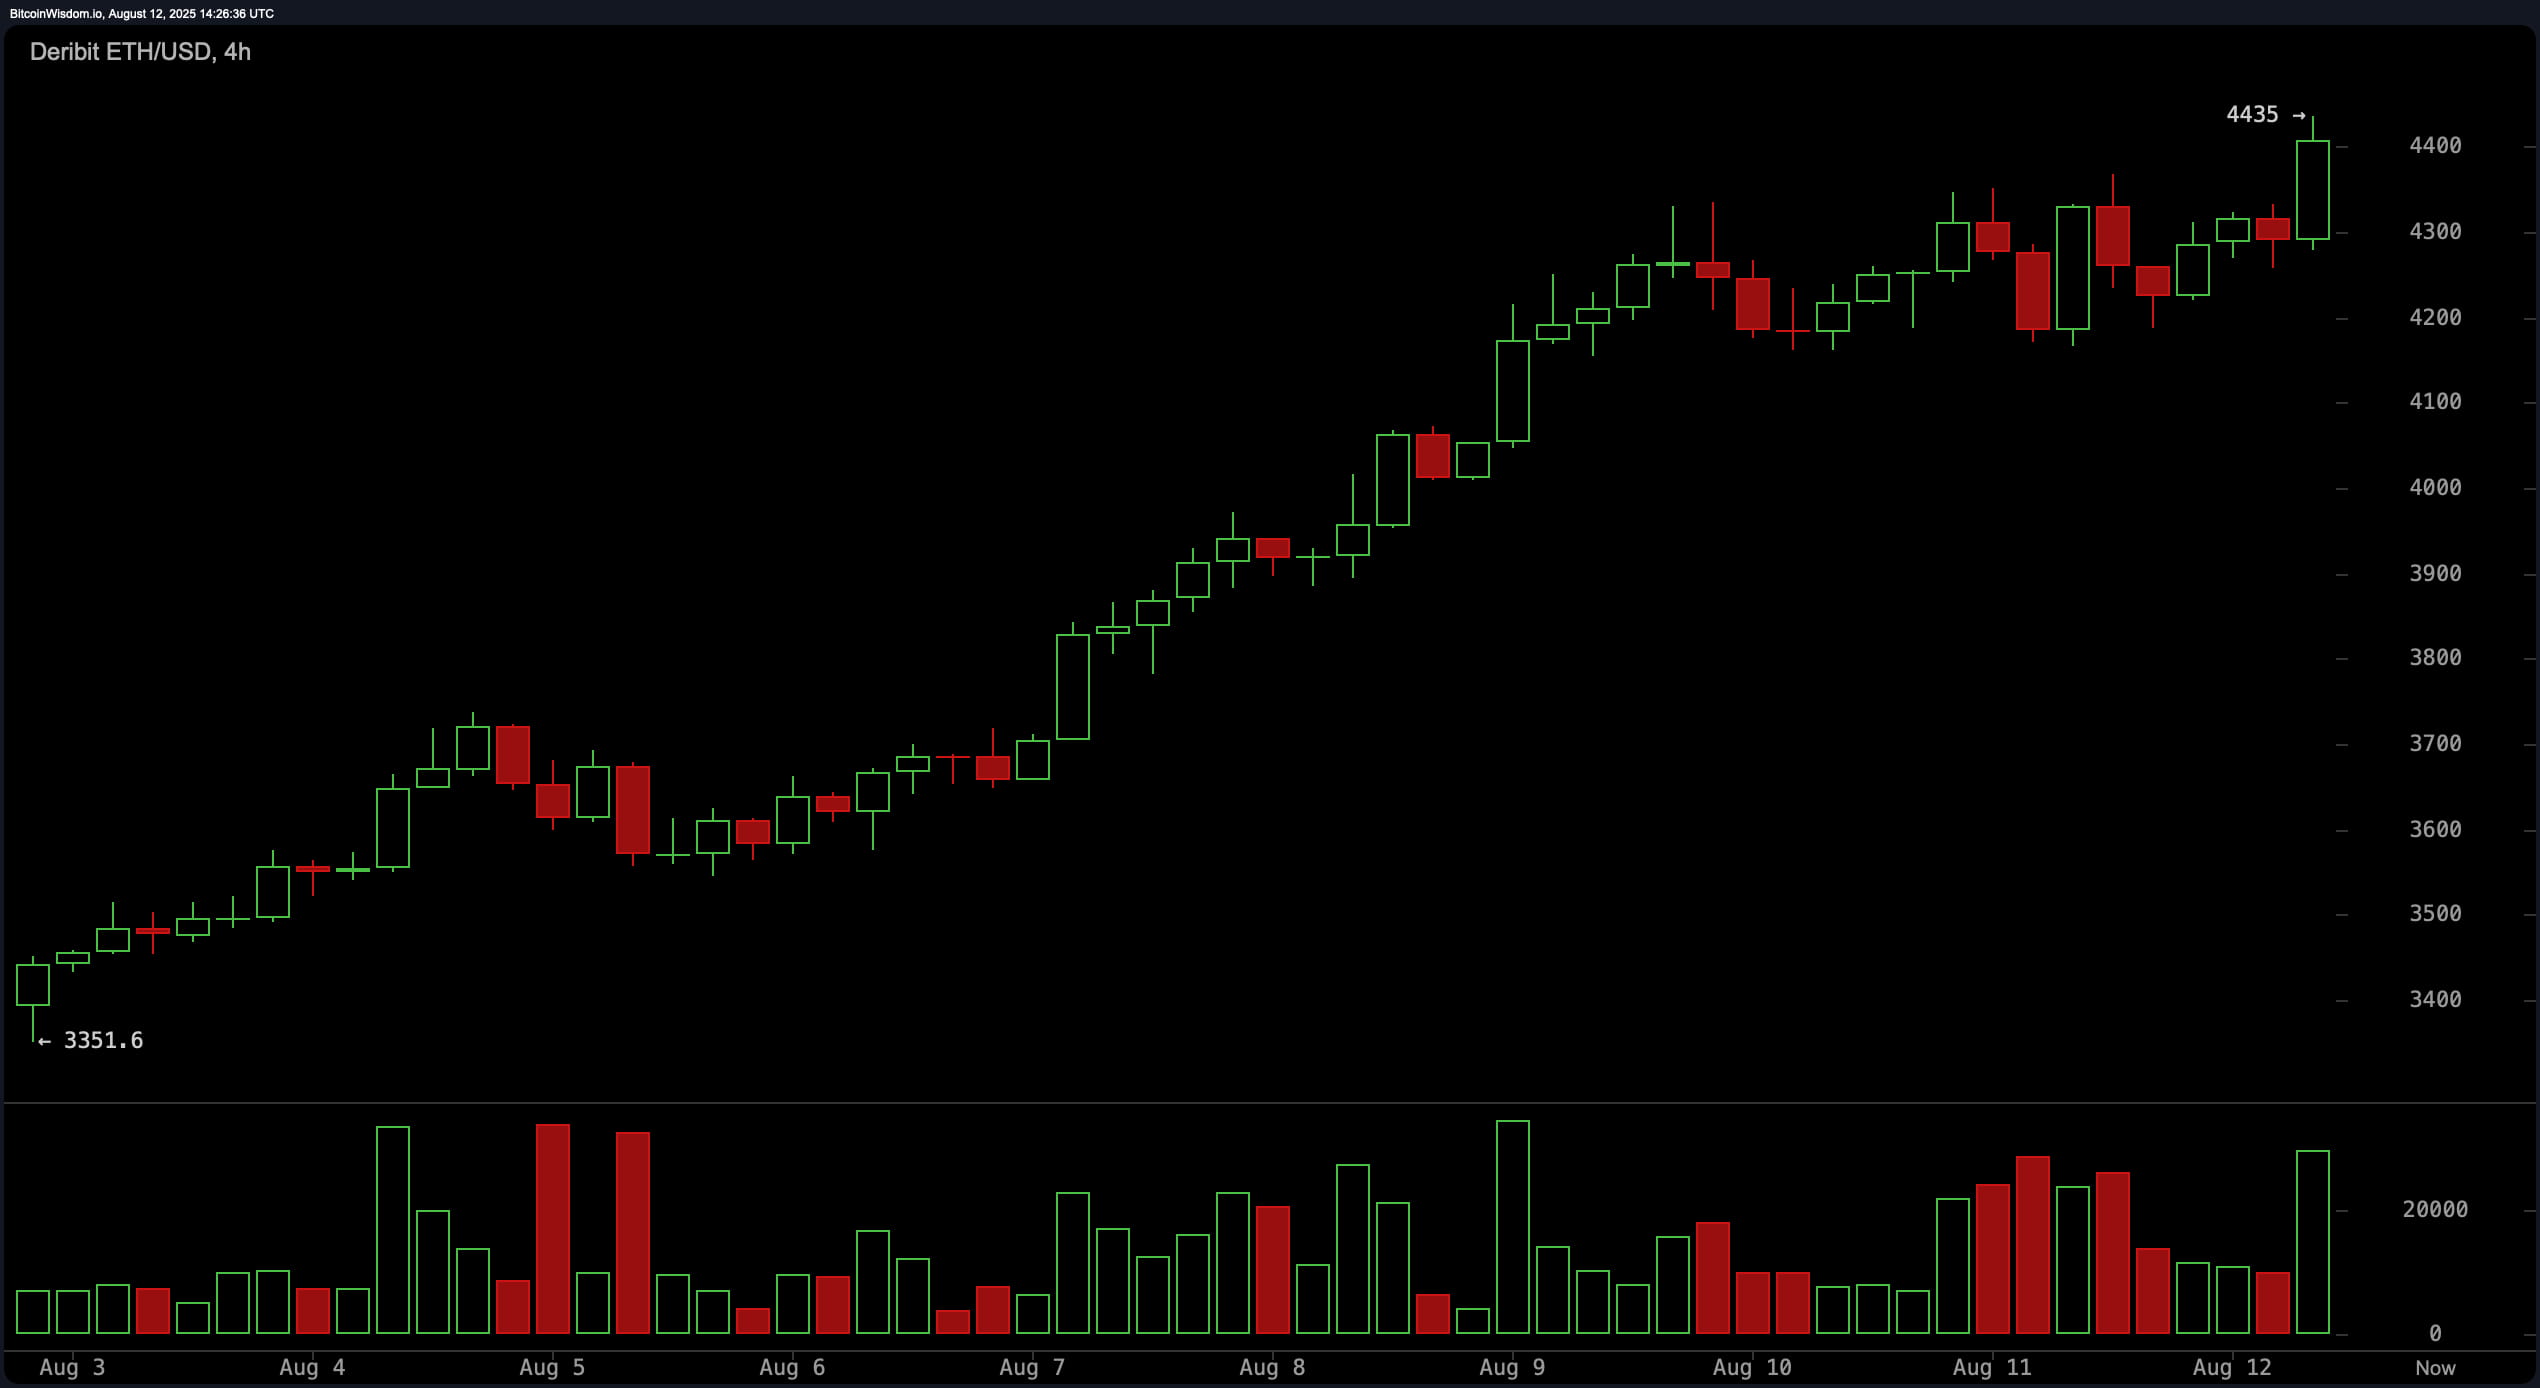
ETH/USD 4-Hour Chart via Deribit on August 12, 2025.
On the 1-hour chart, Ethereum experienced a rapid push to $4,435, followed by moderate profit taking. A large green candle accompanied by high volume underscores strong buying interest, although sellers quickly emerged at resistance. The subsequent consolidation shows day traders waiting for a decisive breakout. A clear move above $4,435, supported by volume, could trigger momentum trades toward the psychological $4,500 mark, while failing to hold could lead to short-term adjustments.
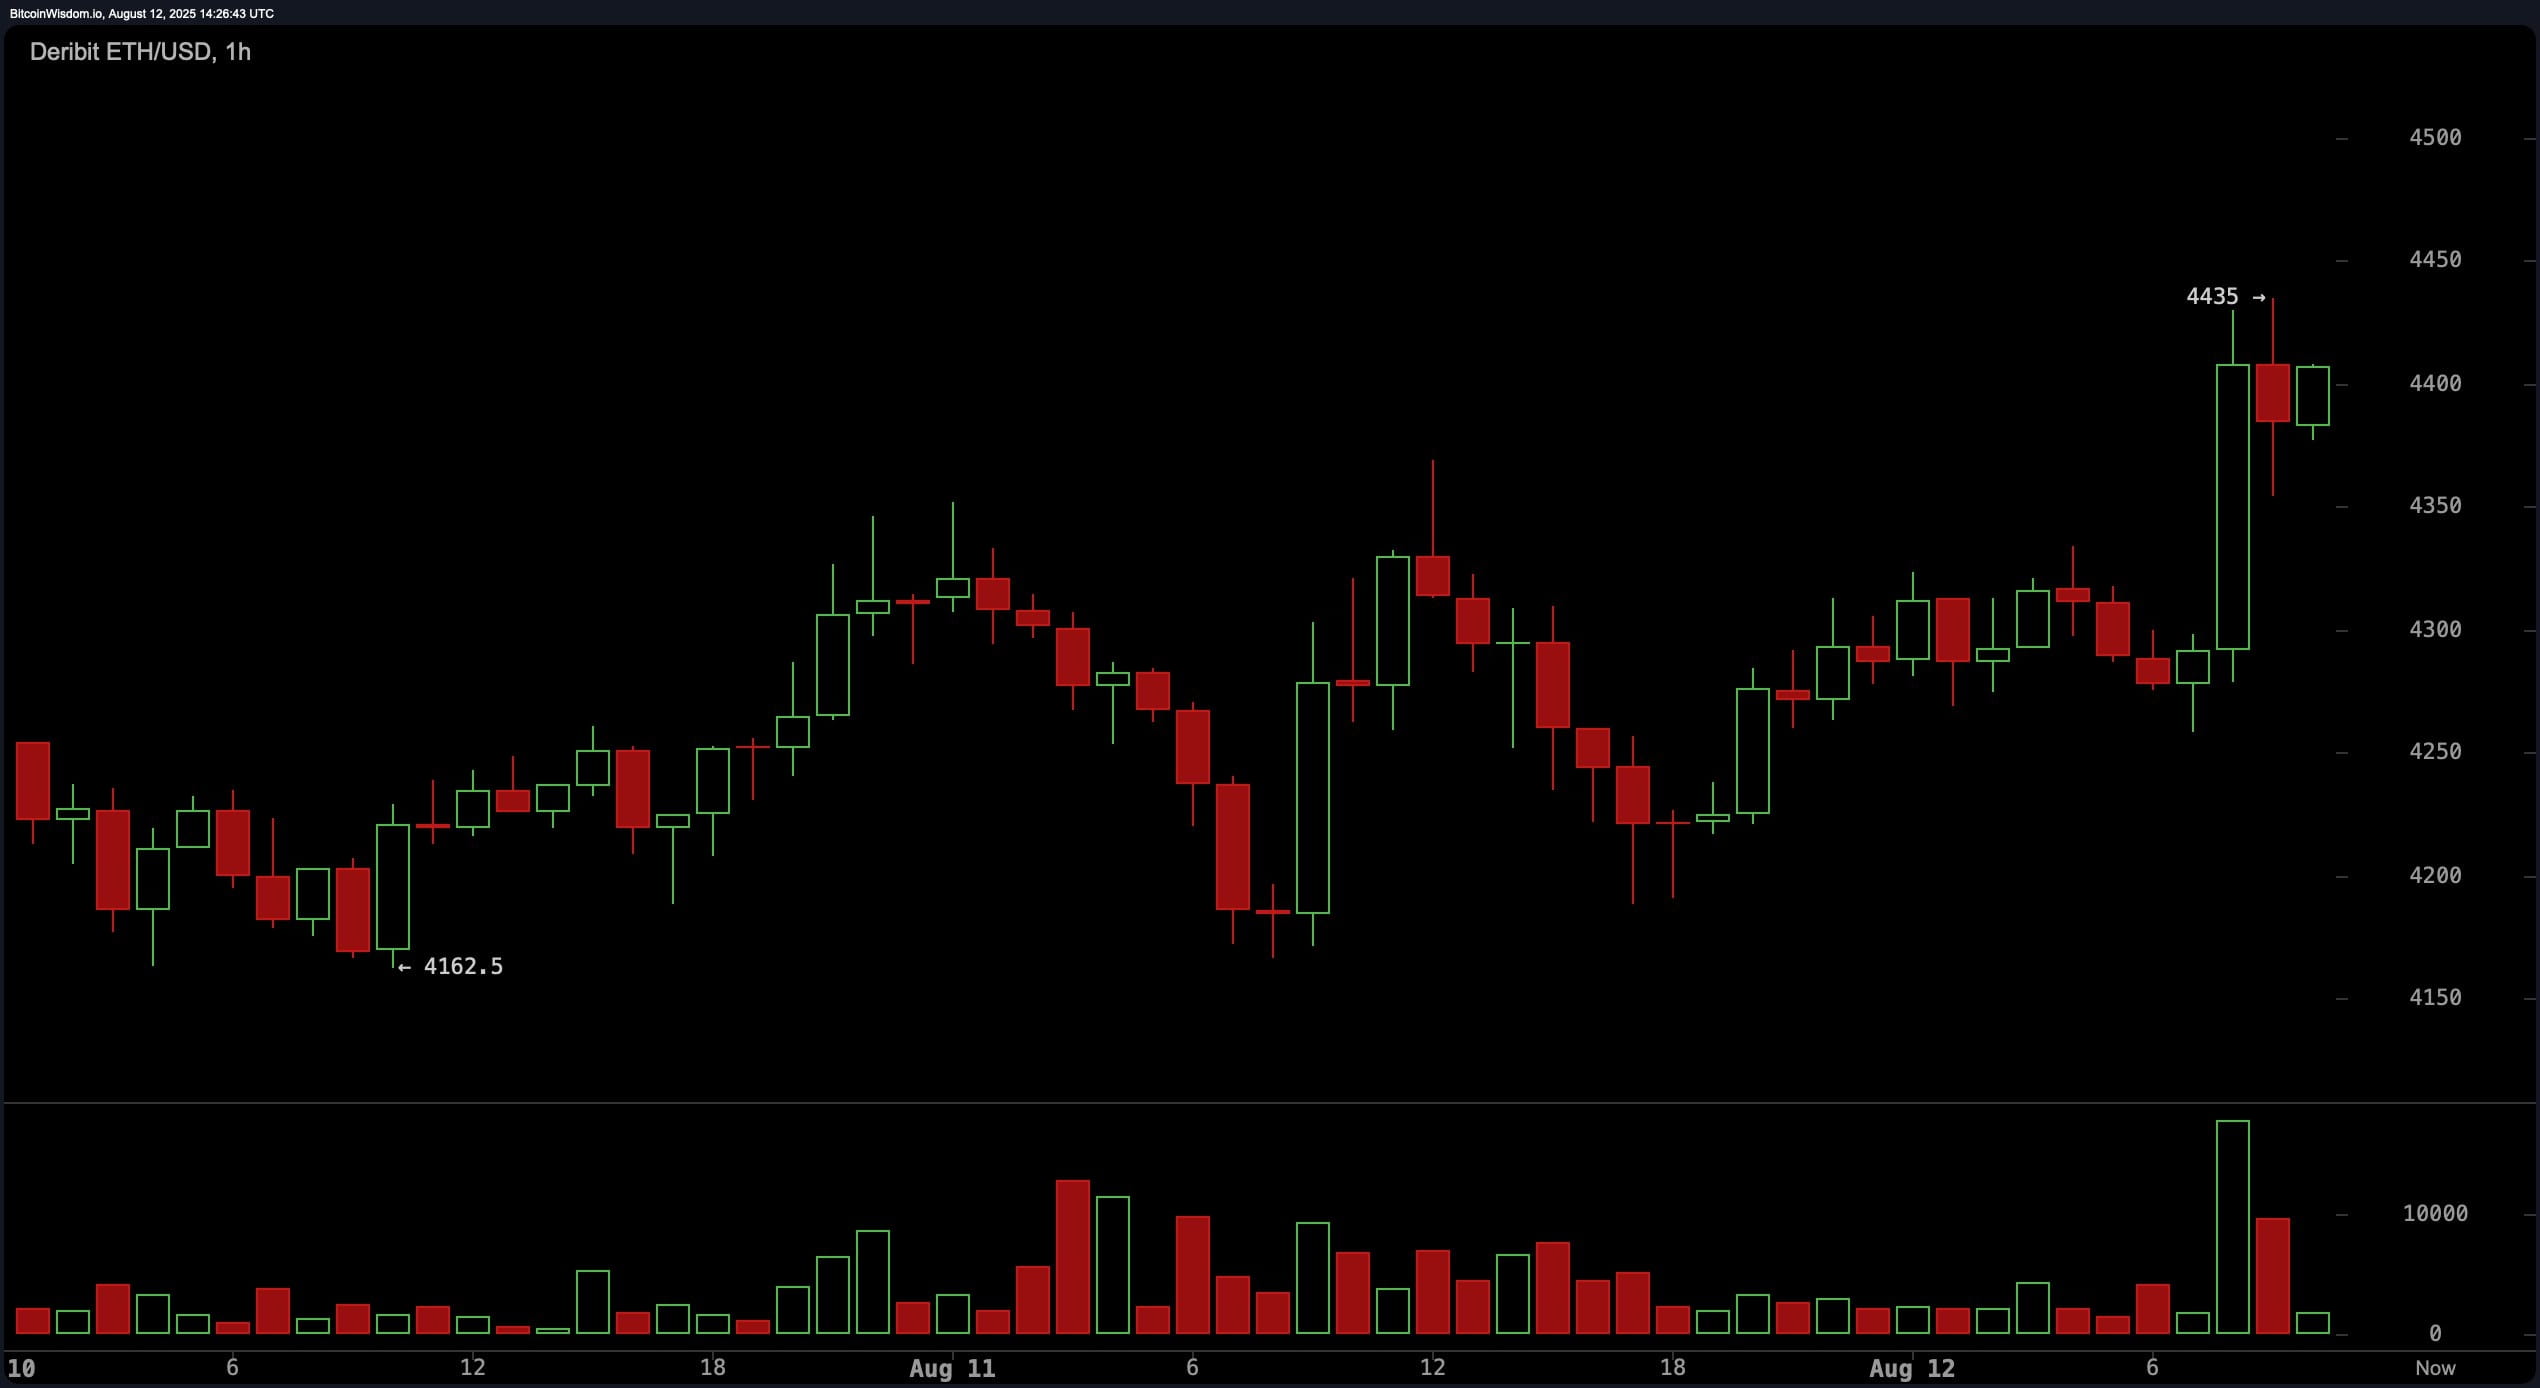
ETH/USD 1-Hour Chart via Deribit on August 12, 2025.
The oscillators present a mixed picture. The relative strength index (RSI) at 74.8 and stochastic at 91.6 both register neutral, reflecting a prolonged but not exhausted bullish momentum. The commodity channel index (CCI) at 178.1 signals sell, indicating short-term caution, while the average directional index (ADX) at 43.8 shows a strong trend without clarity on direction. Momentum at 1,007.5 and MACD at 254.9 both indicate buying pressure, consistent with the prevailing bullish structure.
From a strategic standpoint, the upward trend remains intact across all timeframes, but $4,435 is a key inflection point. Swing traders may look for long positions on a confirmed pullback to $4,300, while tighter traders may position to take quick profits on a breakout above resistance. Risk management remains crucial, with stop points set below $4,300 for swing trades and just under the breakout low for tight trades, due to the market's high volatility.
Bullish Rating:
The multi-timeframe bullish structure of Ethereum, with strong support at $4,300 and ongoing buy signals from both exponential moving averages (EMA) and simple moving averages (SMA) indicates that this asset is well-positioned for another upward move. A confirmed breakout above $4,435 could quickly open the path toward the psychological $4,500 level and beyond.
Bearish Rating:
Despite the dominant bullish trend, the sell signal from the commodity channel index (CCI), prolonged oscillators, and resistance pressure at $4,435 increase the risk of a short-term correction. Failing to hold above $4,300 could lead to deeper profit-taking around the $4,000 support zone.