

XRP is trading at $3.06 with a market capitalization of $181.57 billion and a 24-hour trading volume of $11.35 billion. This digital asset is moving within an intraday price range of $3.06 to $3.34, reflecting high volatility amid ongoing bearish pressure.
XRP
On the 1-hour chart, XRP shows signs of short-term consolidation after a sudden drop from $3.34 to $2.97. Despite a temporary recovery to around $3.15, the price is currently fluctuating between $3.07 and $3.10, indicating a lack of commitment from buyers. A notable spike in volume during the bearish candle shows significant selling pressure, possibly from institutional players. Attempts to push the price higher have faced rejection at $3.15, establishing this level as short-term resistance. The coin appears to be forming a base near $3.05, with bullish momentum only recovering if the $3.12 level is reclaimed.
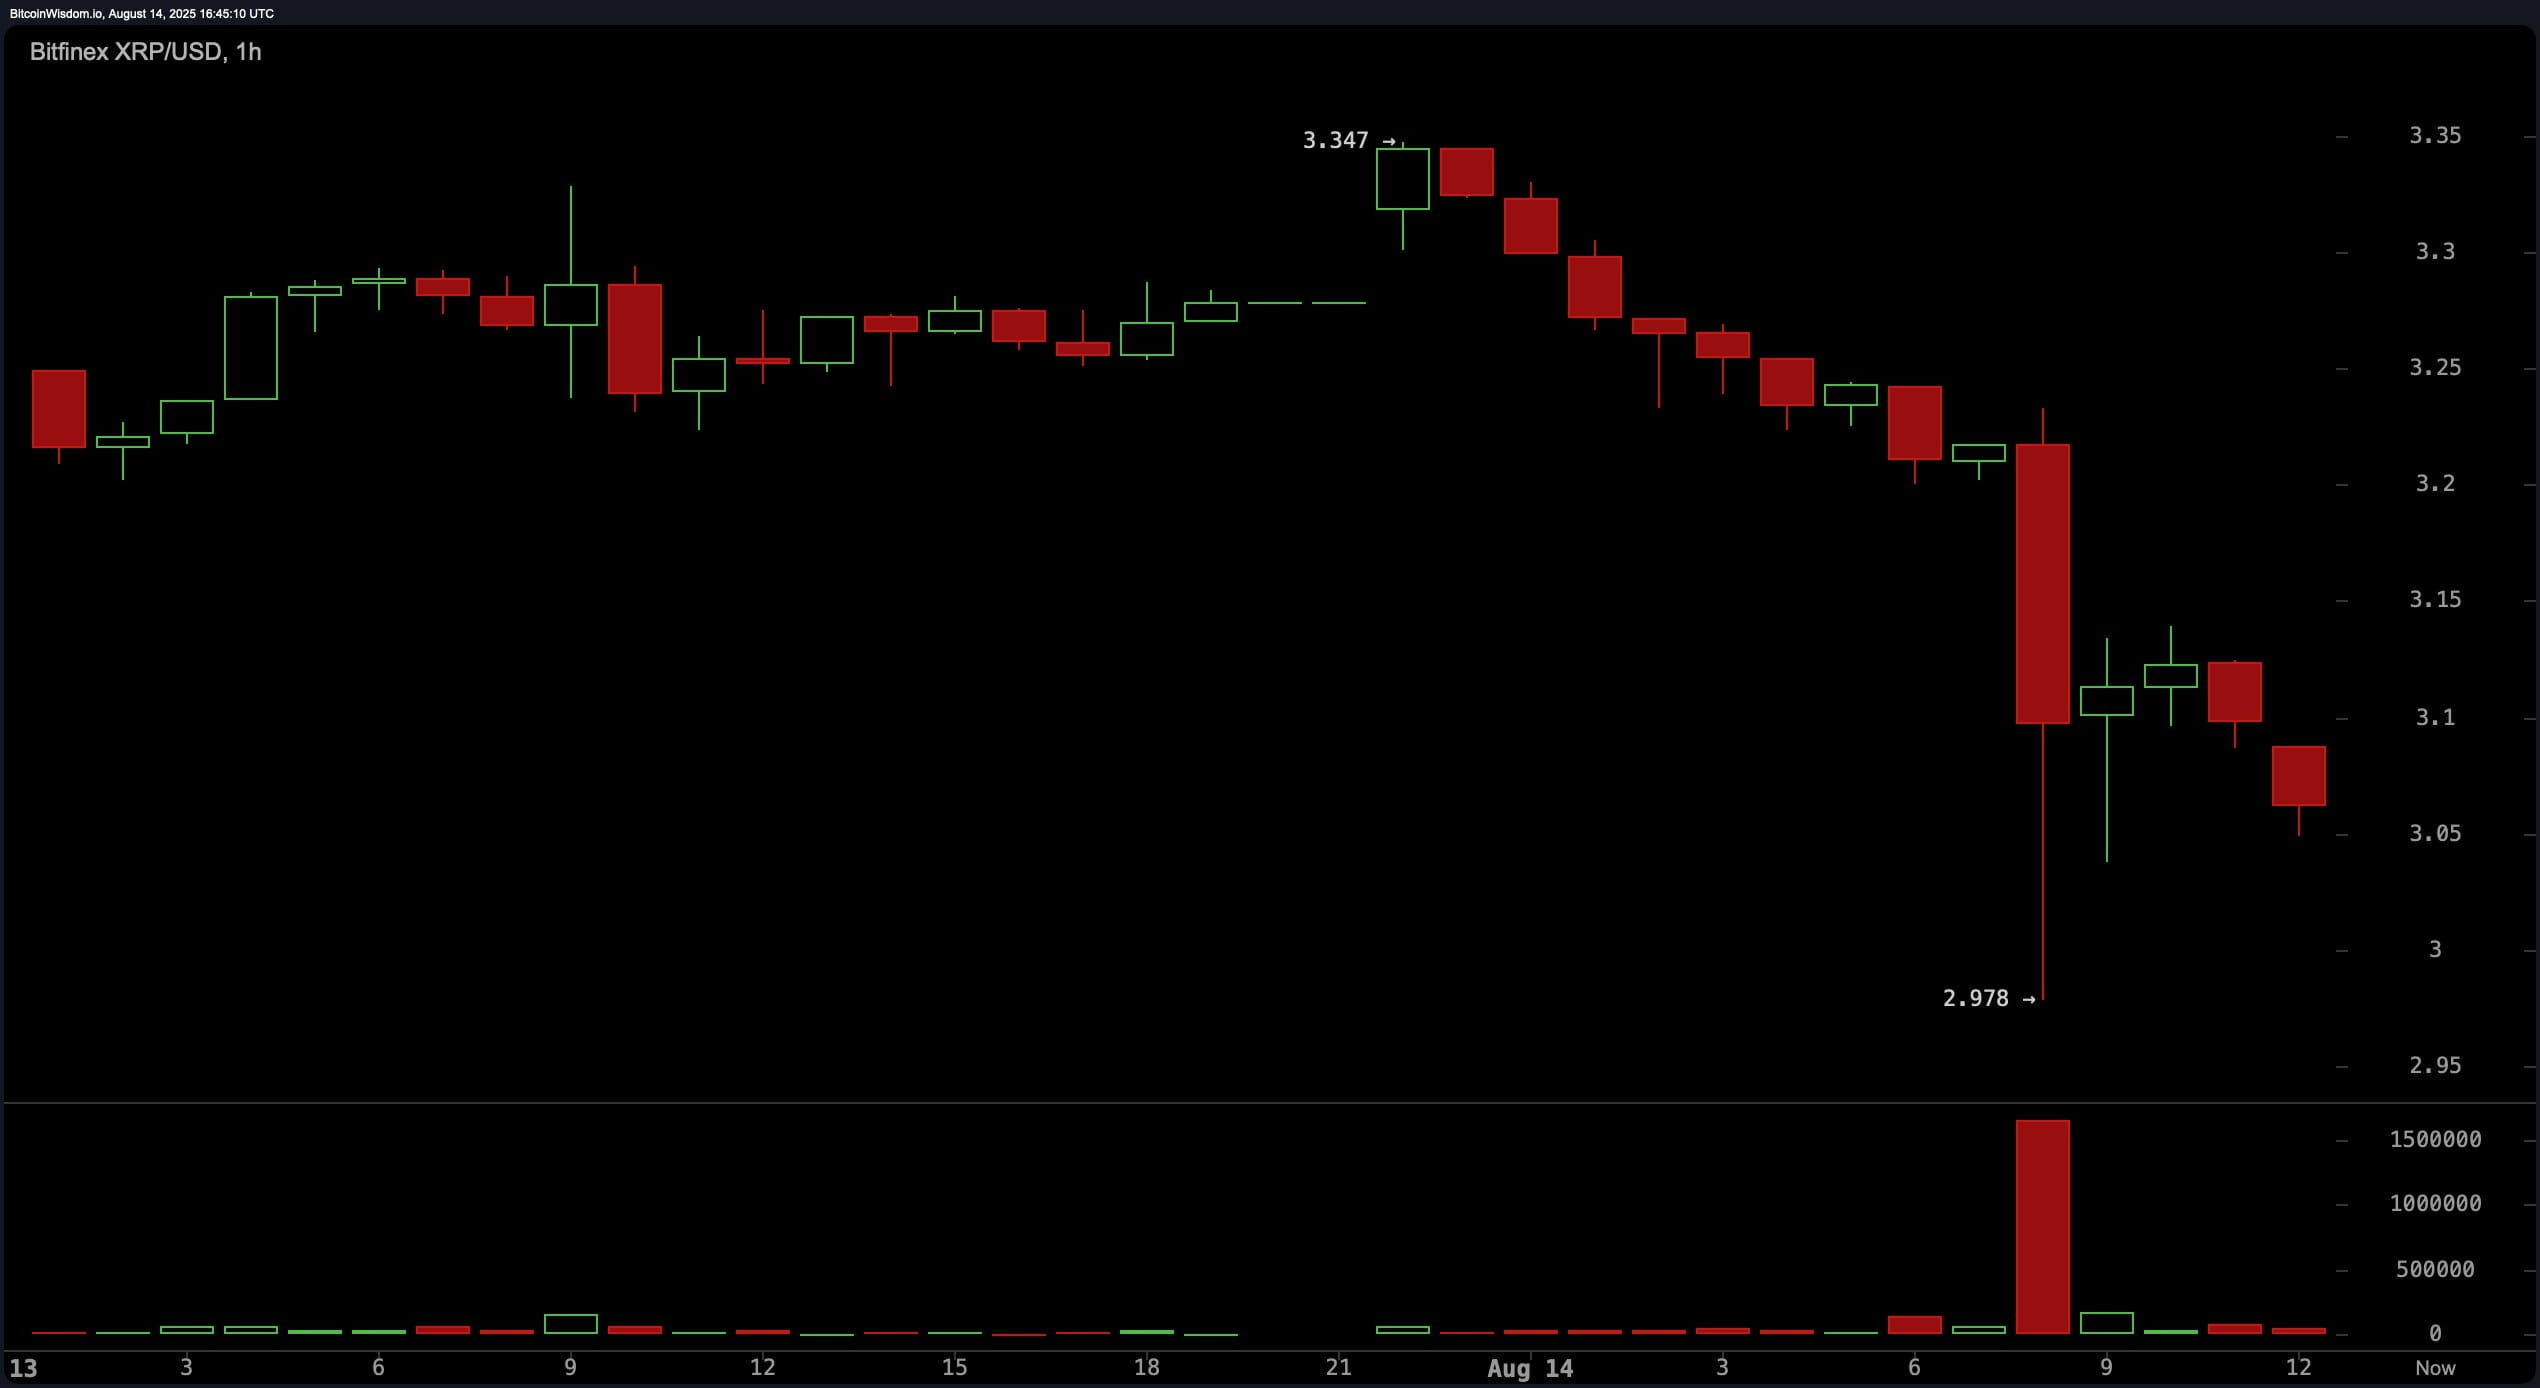
XRP/USD on the 1-hour chart on Bitfinex on August 14, 2025.
On the 4-hour chart, a broader bearish structure is supported, with XRP experiencing a sharp decline from around $3.30 to $2.98 in a decisive candle. Although there was a small recovery attempt, the price remains capped below $3.10, confirming a pattern of lower highs and lower lows. Red candles with high volume indicate sellers' control, while weak recoveries suggest a lack of commitment from buyers. Traders may find speculative opportunities around $2.95–$3.00 with tight stops below $2.90. Resistance is tightly set from $3.15 to $3.30, where failed bullish attempts are likely to encounter profit-taking.
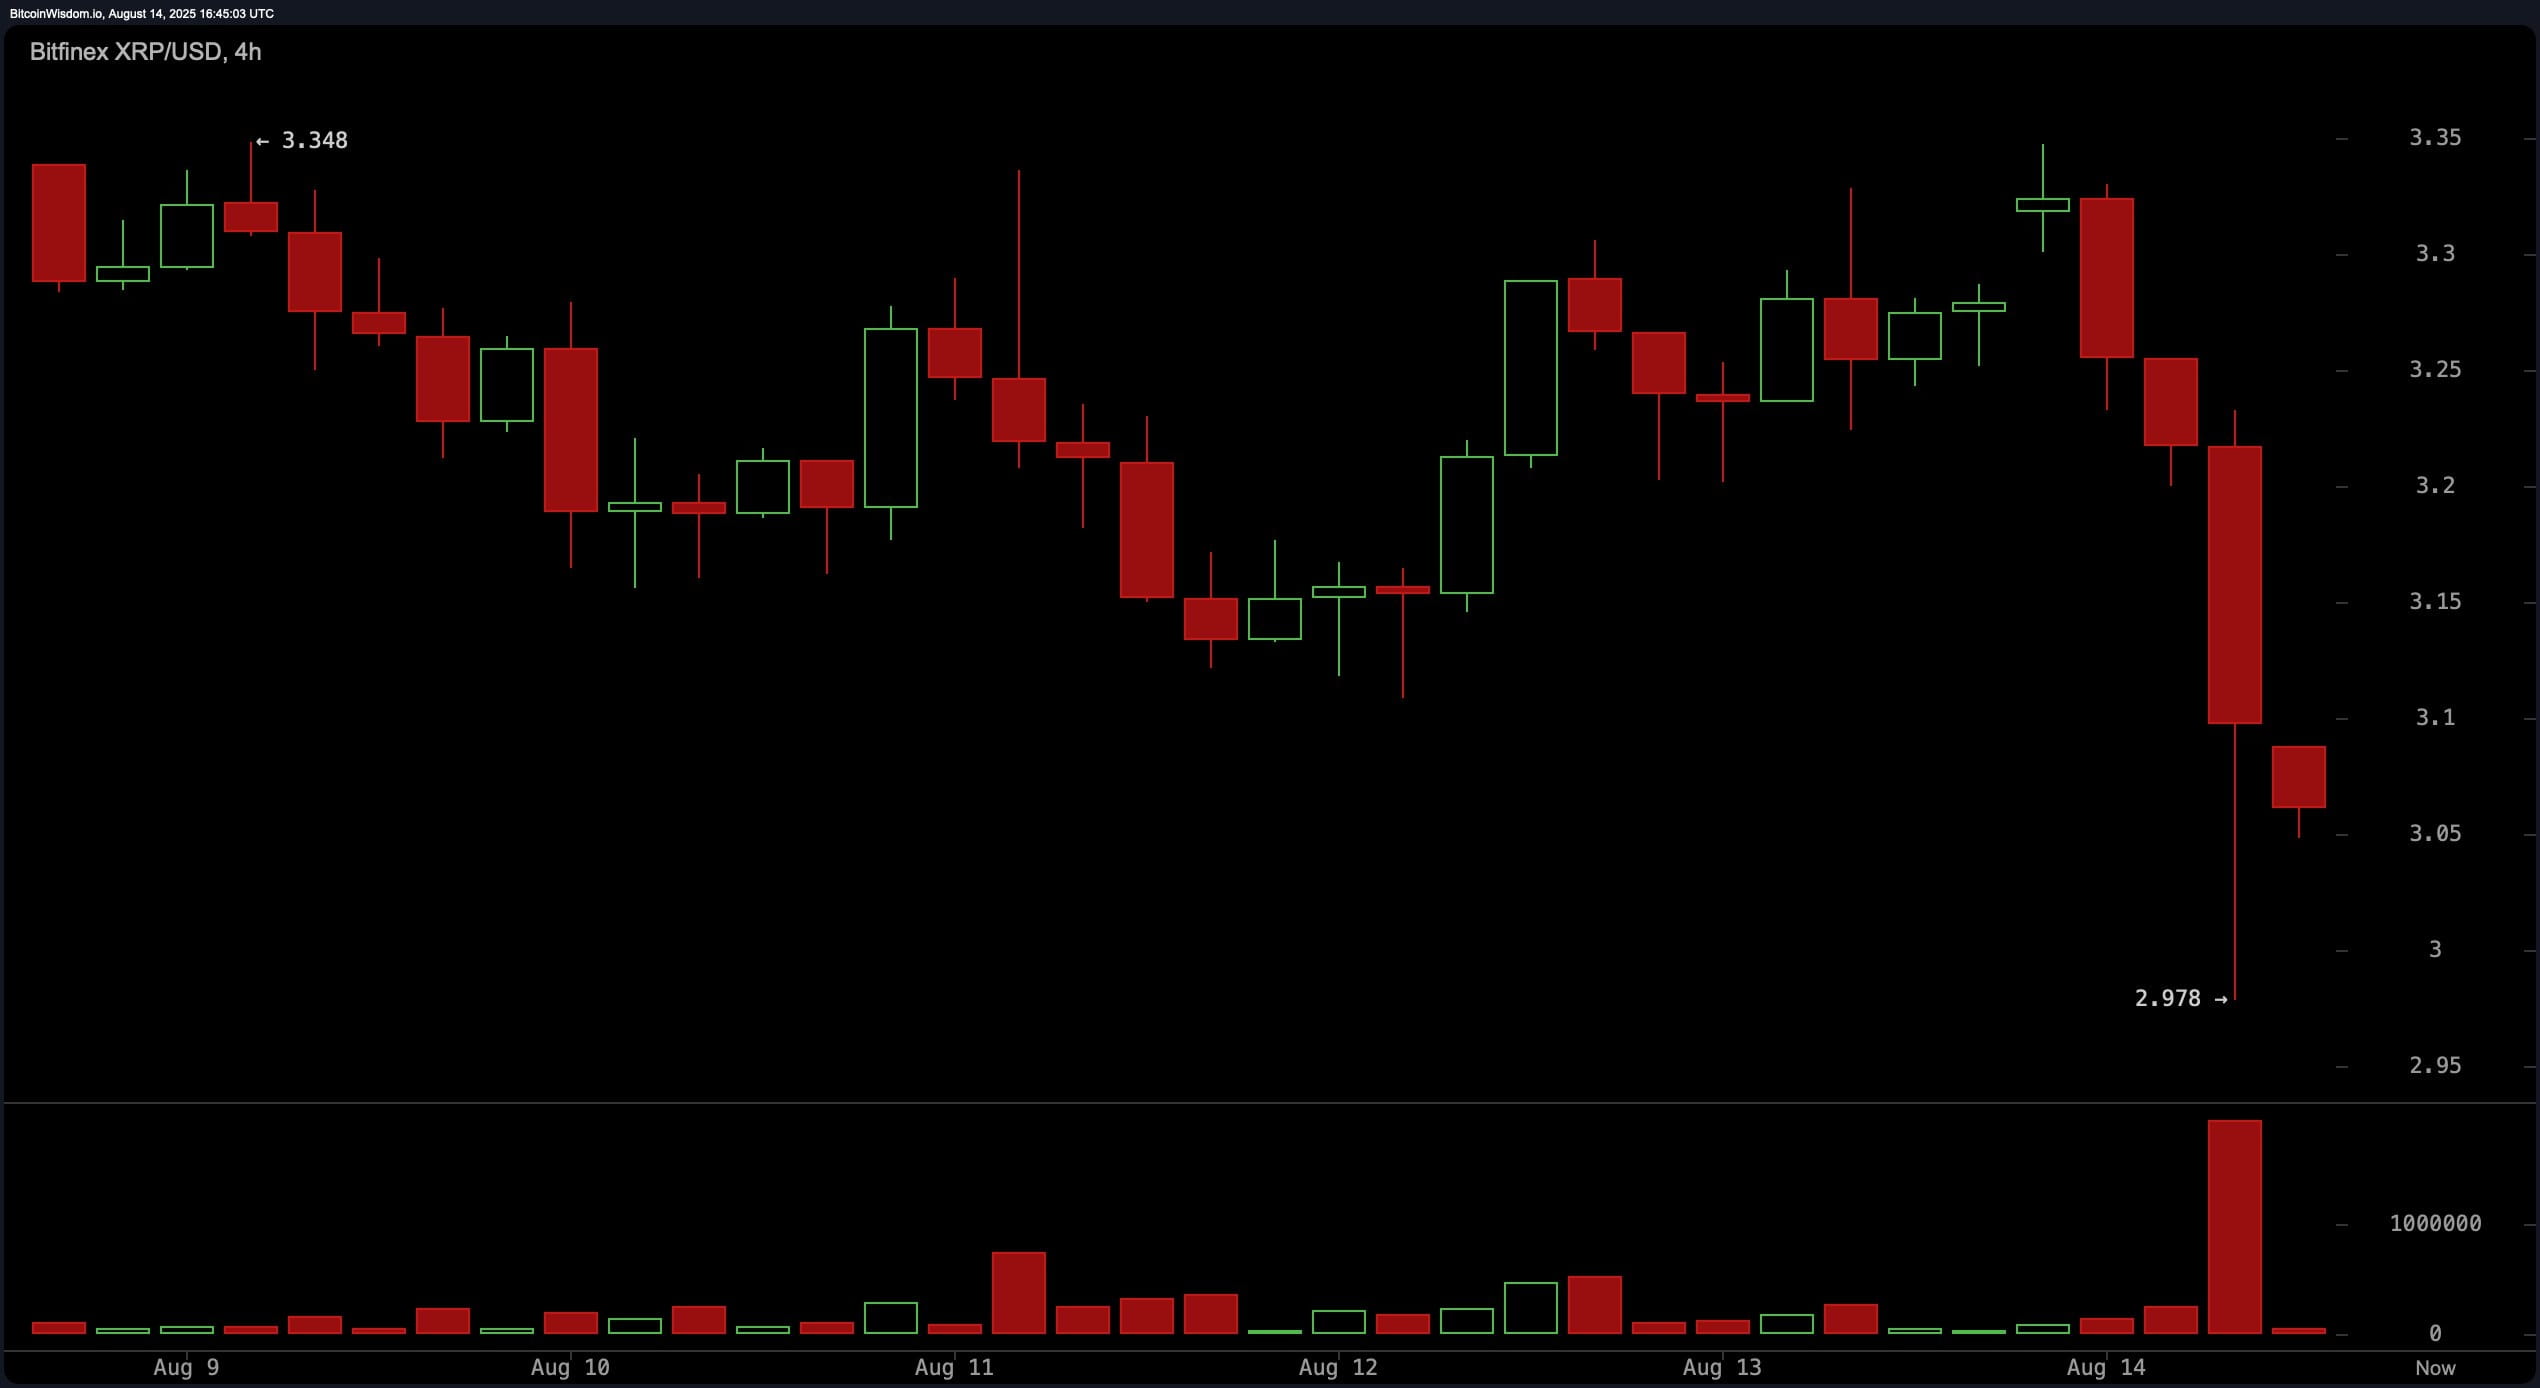
XRP/USD on the 4-hour chart on Bitfinex on August 14, 2025.
Daily chart analysis further confirms a bearish structure. After peaking near $3.66, XRP underwent an extended multi-day correction, breaking below the $3.10 support zone with high volume. The current structure reveals a double top pattern around $3.65—a classic bearish reversal pattern—intensifying the warning. The most recent red candle has also surpassed previous familiar lows, reinforcing the bearish case. Short-term resistance is set at $3.25–$3.35, while strong support lies at $2.80–$2.90, a level where buyers may consider re-entering if the price stabilizes.
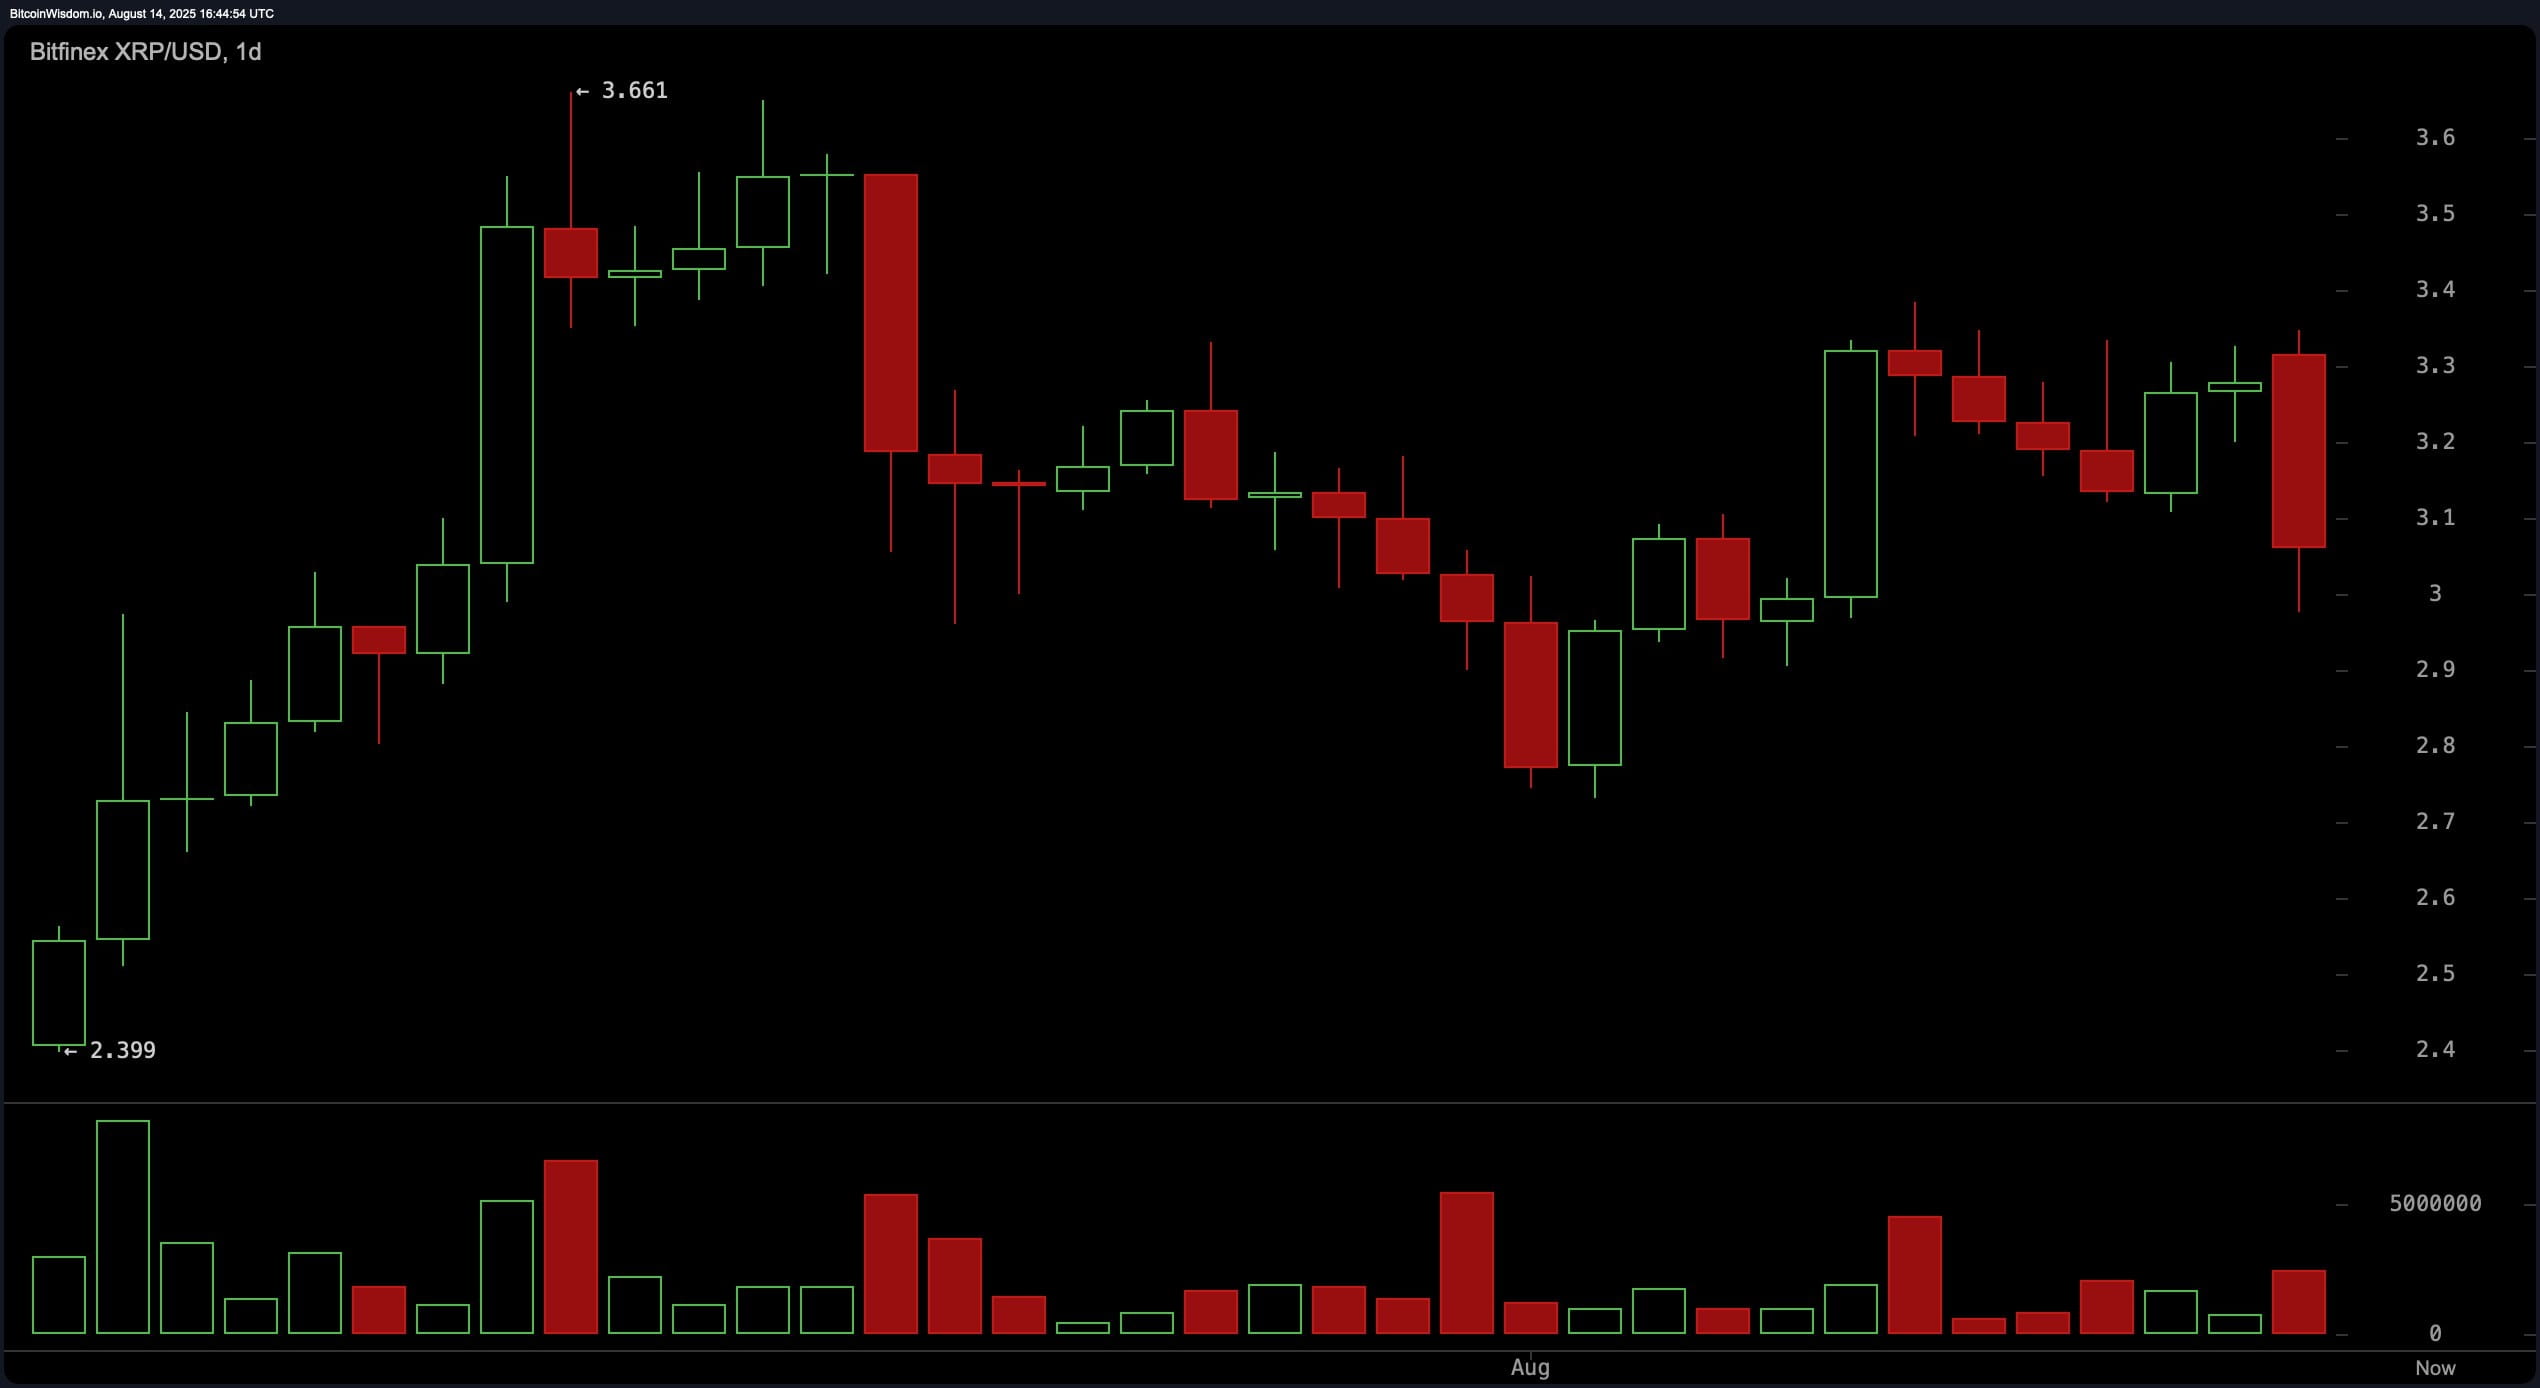
XRP/USD on the 1-day chart on Bitfinex on August 14, 2025.
Oscillators are presenting a mixed but cautious outlook. The Relative Strength Index (RSI) is at 49.42, indicating neutral conditions, while the Stochastic Oscillator stands at 72.47, also in neutral territory. The Commodity Channel Index (CCI) is at 13.67 and the Average Directional Index (ADX) is at 28.93, both reflecting a market lacking clear directional strength. The Awesome Oscillator (AO) reads 0.07297 with no clear momentum bias. However, bearish signals are emerging from the momentum indicator at -0.00636 and the Moving Average Convergence Divergence (MACD) at 0.06964, both indicating selling pressure.
Moving Averages (MAs) continue to confirm the current bearish trend. Short-term indicators like the Exponential Moving Average (EMA) and Simple Moving Average (SMA) over 10 and 20 periods—EMA(10) at $3.16212 and SMA(10) at $3.17122, EMA(20) at $3.12245 and SMA(20) at $3.11169—are signaling bearish action. Only the EMA over 30 periods, EMA(30) at $3.05865, provides a bullish signal, while its simple counterpart, SMA(30) at $3.18784, remains bearish. Long-term moving averages from 50 to 200 periods are firmly in bullish territory, with EMA(200) at $2.42118 and SMA(200) at $2.45647, indicating strong support below the current price level.
Bullish Verdict:
XRP's current consolidation at key support levels, combined with long-term moving averages signaling continued bullish potential, suggests that the broader bullish trend remains intact. If buyers can reclaim the $3.12 to $3.25 range with strong volume, a new bullish push towards $3.34 and beyond remains within reach, supported by institutional buying as prices decline.
Bearish Verdict:
The dominance of bearish price structures on the intraday and daily charts, combined with weak momentum indicators and fixed resistance at $3.15 to $3.35, indicates the risk of further bearishness. Unless the price decisively reclaims the $3.25 level, the path of least resistance remains downward, with the potential to revisit the $2.90 to $2.95 support zone likely in the near future.
