In the last 24 hours, the price of Bitcoin Cash (BCH) has increased by about 4%. This is a development that often attracts the attention of traders, especially when it occurs amid signals of market correction.
The question now is whether BCH can capitalize on this upward momentum to move towards the next major target.
Let's examine the key price levels of Bitcoin Cash, the technical indicators show why the bulls are in control of the market and what the money flow reveals about the next move.
The important price milestones of Bitcoin Cash and the journey towards $665
Currently, BCH is trading around $616, just above $607 – an important resistance level both psychologically and technically, which has often acted as a reversal point in previous growth phases.
If successful in breaking through and holding above $607, BCH has the chance to move straight to $665, equivalent to an increase of about nearly 10% from the current price.
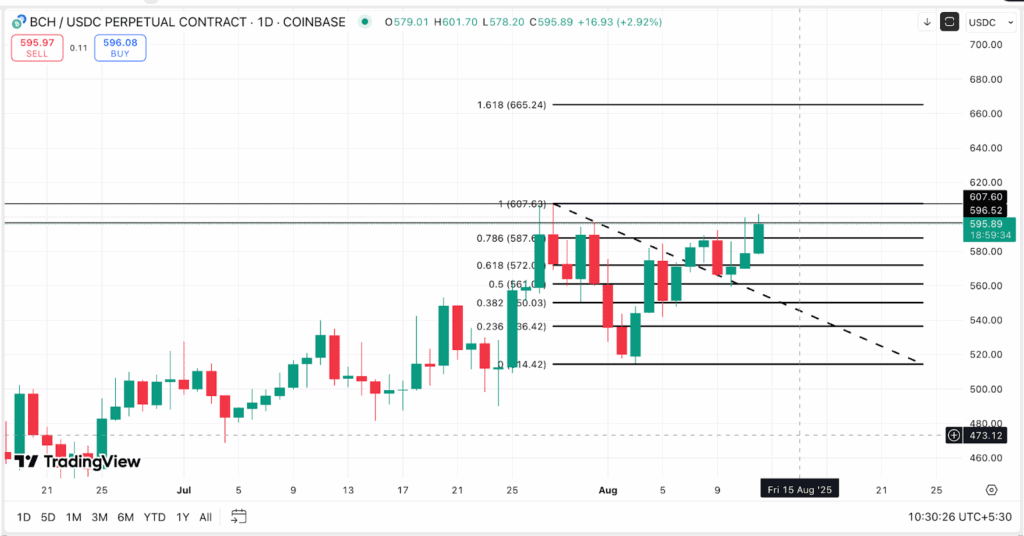
This target is determined based on the Fibonacci extension levels, a popular tool that helps traders predict the next price zone when the price surpasses resistance.
Notably, BCH has created higher highs on the chart, indicating that buying pressure is still increasing rather than weakening. Overall, this trend will create a breakout if the right market conditions converge.
Bulls are in control: A perspective from technical indicators
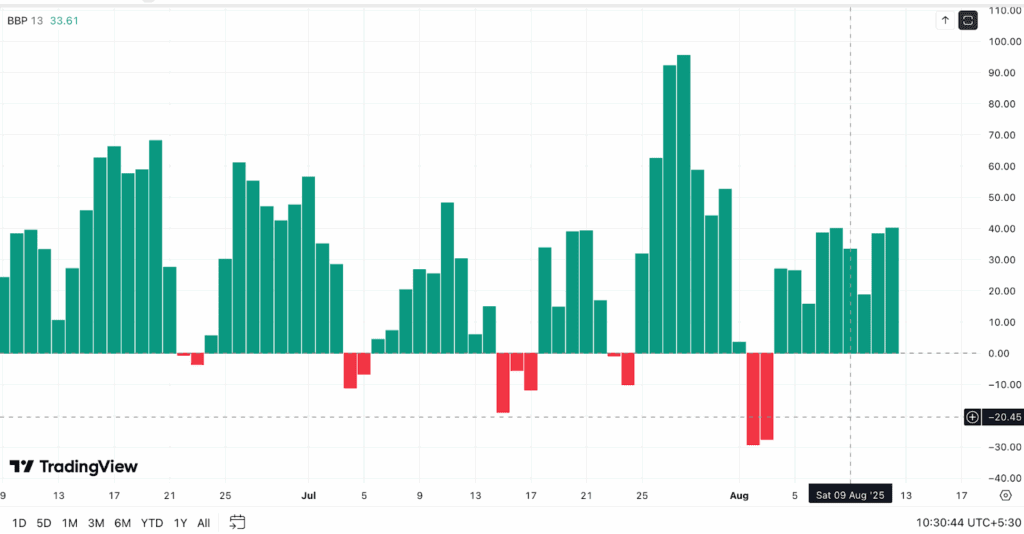
Looking deeper into technical signals, the Bull Bear Power (BBP) indicator is currently still firmly in the green zone, reflecting sustained buying strength over selling for a long time, not just in the recent session.
The last time BBP reached a similar level, BCH broke through important resistance and maintained its upward momentum.
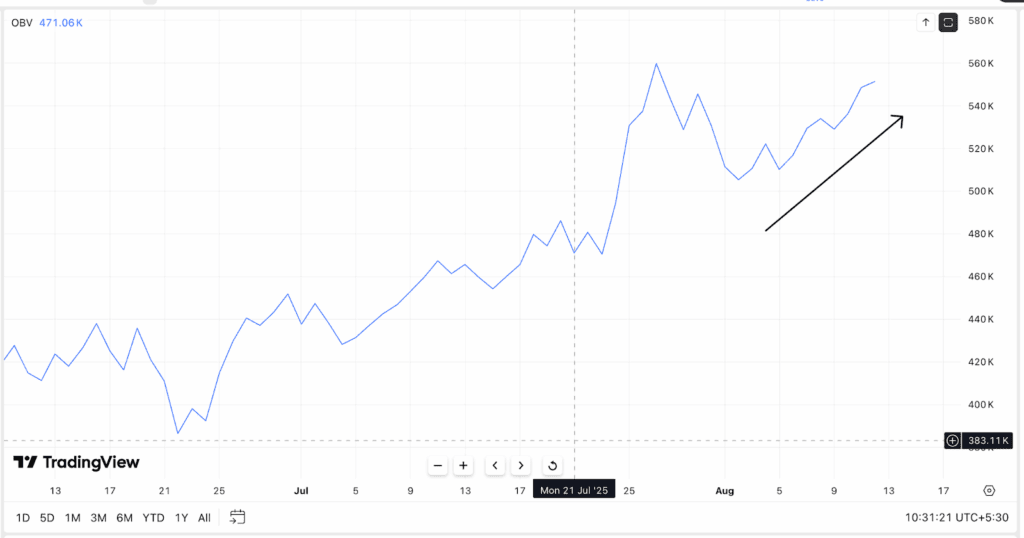
The On-Balance Volume (OBV) indicator also shows a similar story. OBV measures the money flow in/out based on trading volume, and with BCH, this index has been continuously rising, setting new highs in recent weeks. This is a sign of a price increase led by the spot market.
In other words, people are actually buying BCH in the market rather than just betting on it through derivatives. Price increases led by the spot market are often healthier and more sustainable.
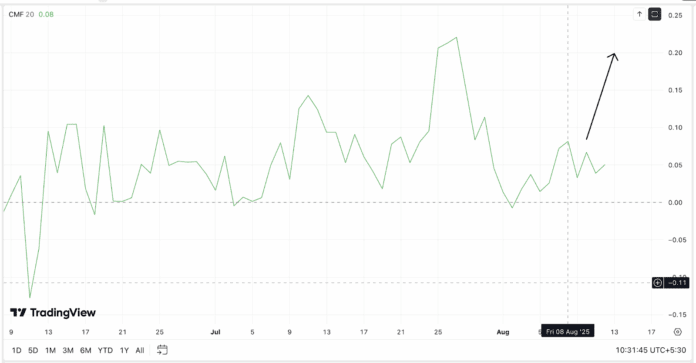
However, the Chaikin Money Flow (CMF) has not really strengthened yet, currently at 0.05 — a positive level but much lower than the threshold of 0.22 when BCH previously hit $607. If the CMF rises again, it could be the catalyst for BCH to break resistance.
CMF measures the money flow into or out of the market. If this index rises again, it could provide momentum for the price increase and help BCH surpass the resistance level.
The money flow in/out on exchanges and market position
The net flow, the amount of BCH flowing in or out of exchanges, is also worth monitoring.
In the past few days, according to data from Coinglass, the daily net capital flow on the exchange has decreased. If this trend continues and turns negative, it means that more BCH is leaving exchanges than flowing in.
This is often a positive signal, as it indicates that traders are moving their funds into long-term storage instead of keeping them on exchanges ready to sell.
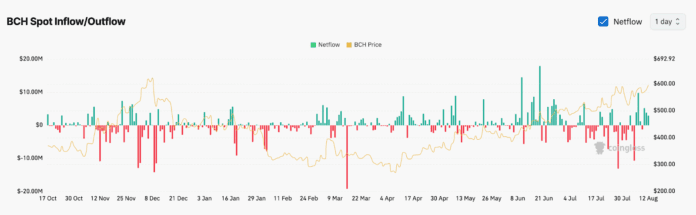
In the past, whenever the capital flow reversed on exchanges, the price of BCH often surged.
This time, if the net capital flow turns red, a similar move could happen again. Additionally, BCH is one of the few altcoins that have increased in price while the market corrects, so the potential for a breakout could become stronger.
Traders need to closely monitor the $607 level. If this level is broken, supported by a rising CMF and a strong OBV, the price could quickly move towards $665.
Conversely, if BCH cannot break through the $607 level and the CMF remains weak, we may see a short-term retreat.
