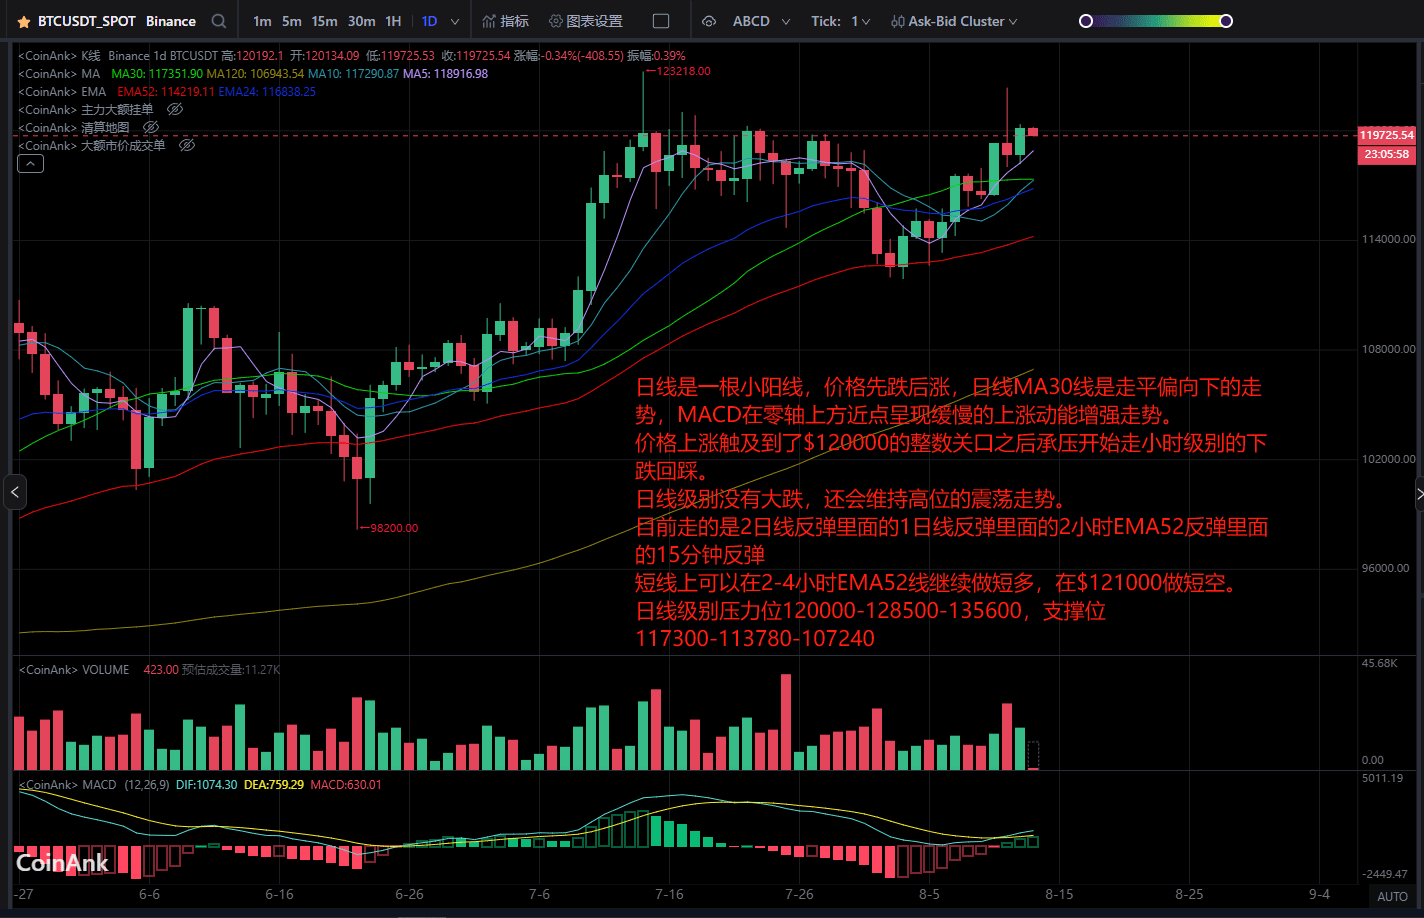
The daily chart shows a small bullish candle, with the price first dropping and then rising. The daily MA30 line is flat with a downward tendency, and the MACD above the zero line is showing a slow increase in upward momentum.
The price rose and touched the integer level of $120,000, after which it faced resistance and began to decline at the hourly level.
There has been no significant drop at the daily level, and it will maintain a high-level oscillating trend.
Currently, the price is rebounding from the 1-day line within the 2-day line rebound, which is inside the 2-hour EMA52 rebound, and within the 15-minute rebound.
In the short term, one can continue to go long on the 2-4 hour EMA52 line and go short at $121,000.
At the daily level, the resistance levels are 120,000 - 128,500 - 135,600, and the support levels are 117,300 - 113,780 - 107,240.