
Date: Tue, Aug 12, 2025 | 05:58 PM GMT
The cryptocurrency market is in full bullish swing as Ethereum (ETH) broke above the $4,500 mark for the first time since 2021. This 24% weekly surge has boosted sentiment across the sector, fueling strong rallies in major memecoins — and Pepe (PEPE) is among the standout gainers.
$PEPE has jumped 4% today, extending its weekly gains to 19%. More importantly, its latest price action is forming a familiar pattern that could hint at its next move.
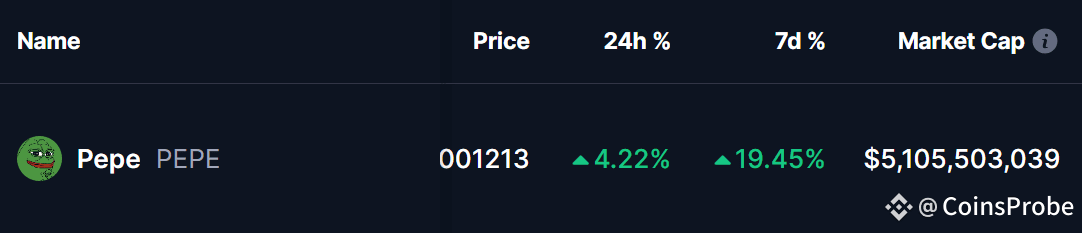
Source: Coinmarketcap
Familiar Pattern Points to Potential Downside
On the daily chart, PEPE remains confined within a broad symmetrical triangle — a pattern often associated with consolidation before a decisive breakout. However, in the short term, the signals lean cautious.
A notable fractal pattern, strikingly similar to the one seen in mid-June, is taking shape again. Back then, PEPE broke below its 25-day moving average (first blue circle) and failed to reclaim it. That rejection triggered a sharp 35% sell-off, driving the price toward the triangle’s lower boundary near $0.0000084.
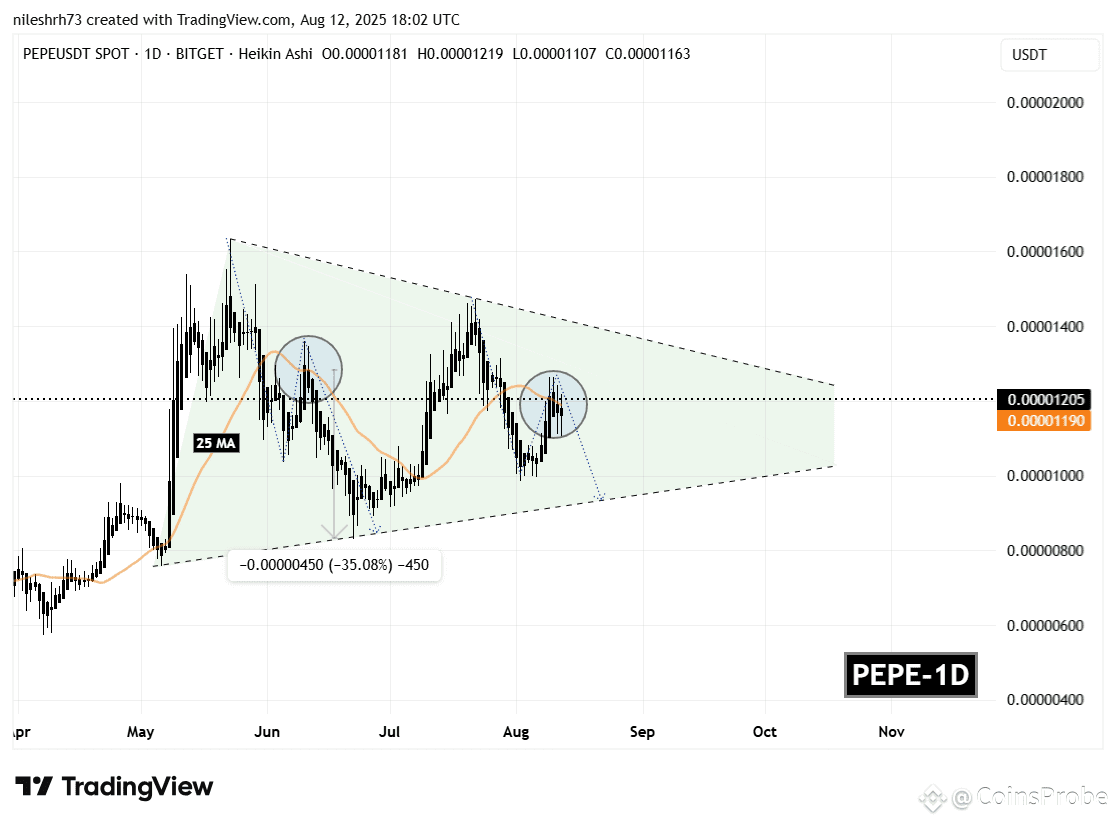
Pepe (PEPE) Daily Chart/Coinsprobe (Source: Tradingview)
Now, the second blue circle marks another crucial battle zone at the 25-day MA, currently sitting near $0.00001190. Price action is showing signs of weakening at this level, raising the possibility that history could repeat itself.
What’s Next for PEPE?
If the 25-day MA at $0.00001190 fails to hold, the bearish fractal would be confirmed, potentially setting the stage for a drop toward the triangle’s lower trendline near $0.0000093 — about 22% lower from current prices.
On the flip side, if bulls reclaim momentum and push PEPE above its recent swing high of $0.00001265, the bearish scenario would be invalidated, possibly opening the door for a fresh move toward the pattern’s upper resistance.
Disclaimer: This article is for informational purposes only and should not be taken as financial advice. Always conduct your own research before making investment decisions.

