$ETH The price of Ethereum was $4,403 on August 12, 2025, at 10:45 AM Eastern Time, supported by a market capitalization of $530.27 billion and a trading volume of $43.98 billion over 24 hours.
The intraday range was from $4,196 to $4,435, highlighting increased volatility as traders tested key resistance levels.
========
On the daily chart, Ethereum (ETH) maintains a steady bullish trend, with the price sharply rising from about $2,112 to its recent high of $4,435.
Higher highs and lows reinforce the uptrend, however, small candles near the top indicate short-term uncertainty.
The level at $4,000 remains a strong support zone, while $4,435 serves as immediate resistance.
A consolidation phase or slight pullback is likely before a new breakout attempt, especially when momentum indicators, such as the moving average convergence divergence (MACD) and the momentum itself, both signal buying strength.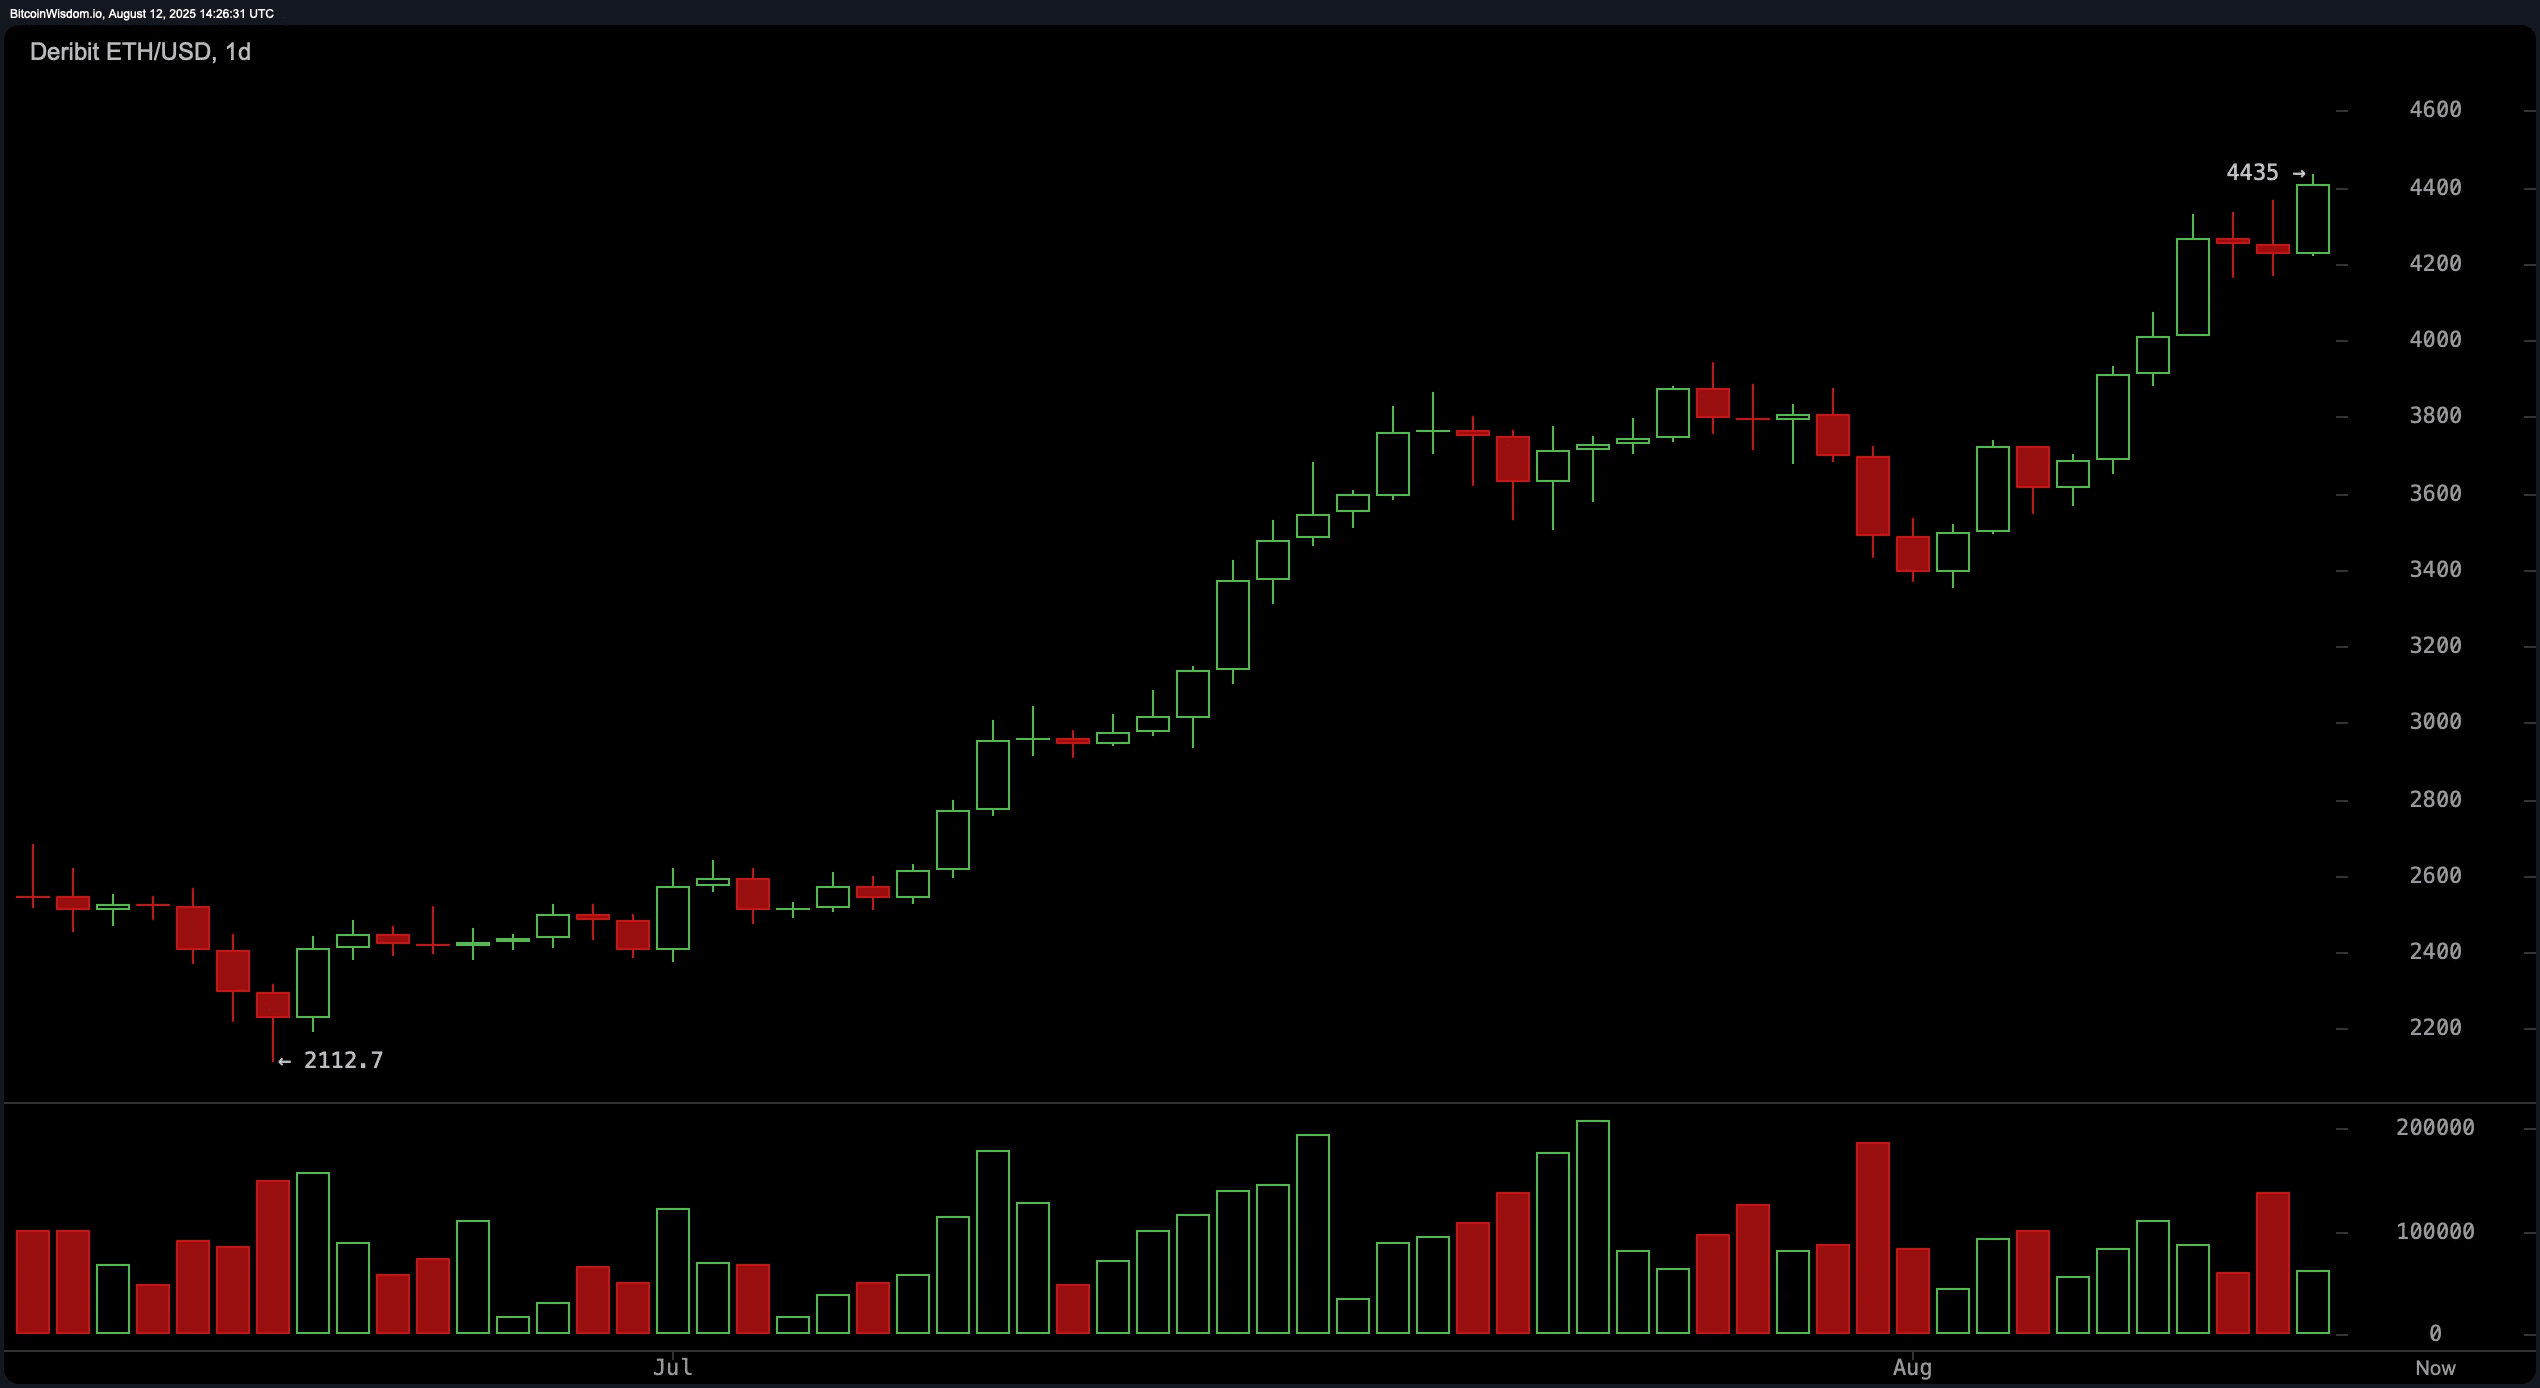
==========≈
The 4-hour chart of Ethereum shows strong growth from $3,351 to $4,435, with a critical breakout above $4,300 triggering an increase in buying volumes. This movement indicates active participation from bulls, but the price may return to the range of $4,300–$4,320 to confirm it as support.
If buyers defend this area, the path to retesting and a potential breakout at $4,435 strengthens. Exponential moving averages (EMA) and simple moving averages (SMA) across all periods, from 10 to 200, remain in the buying zone, reinforcing the bullish sentiment.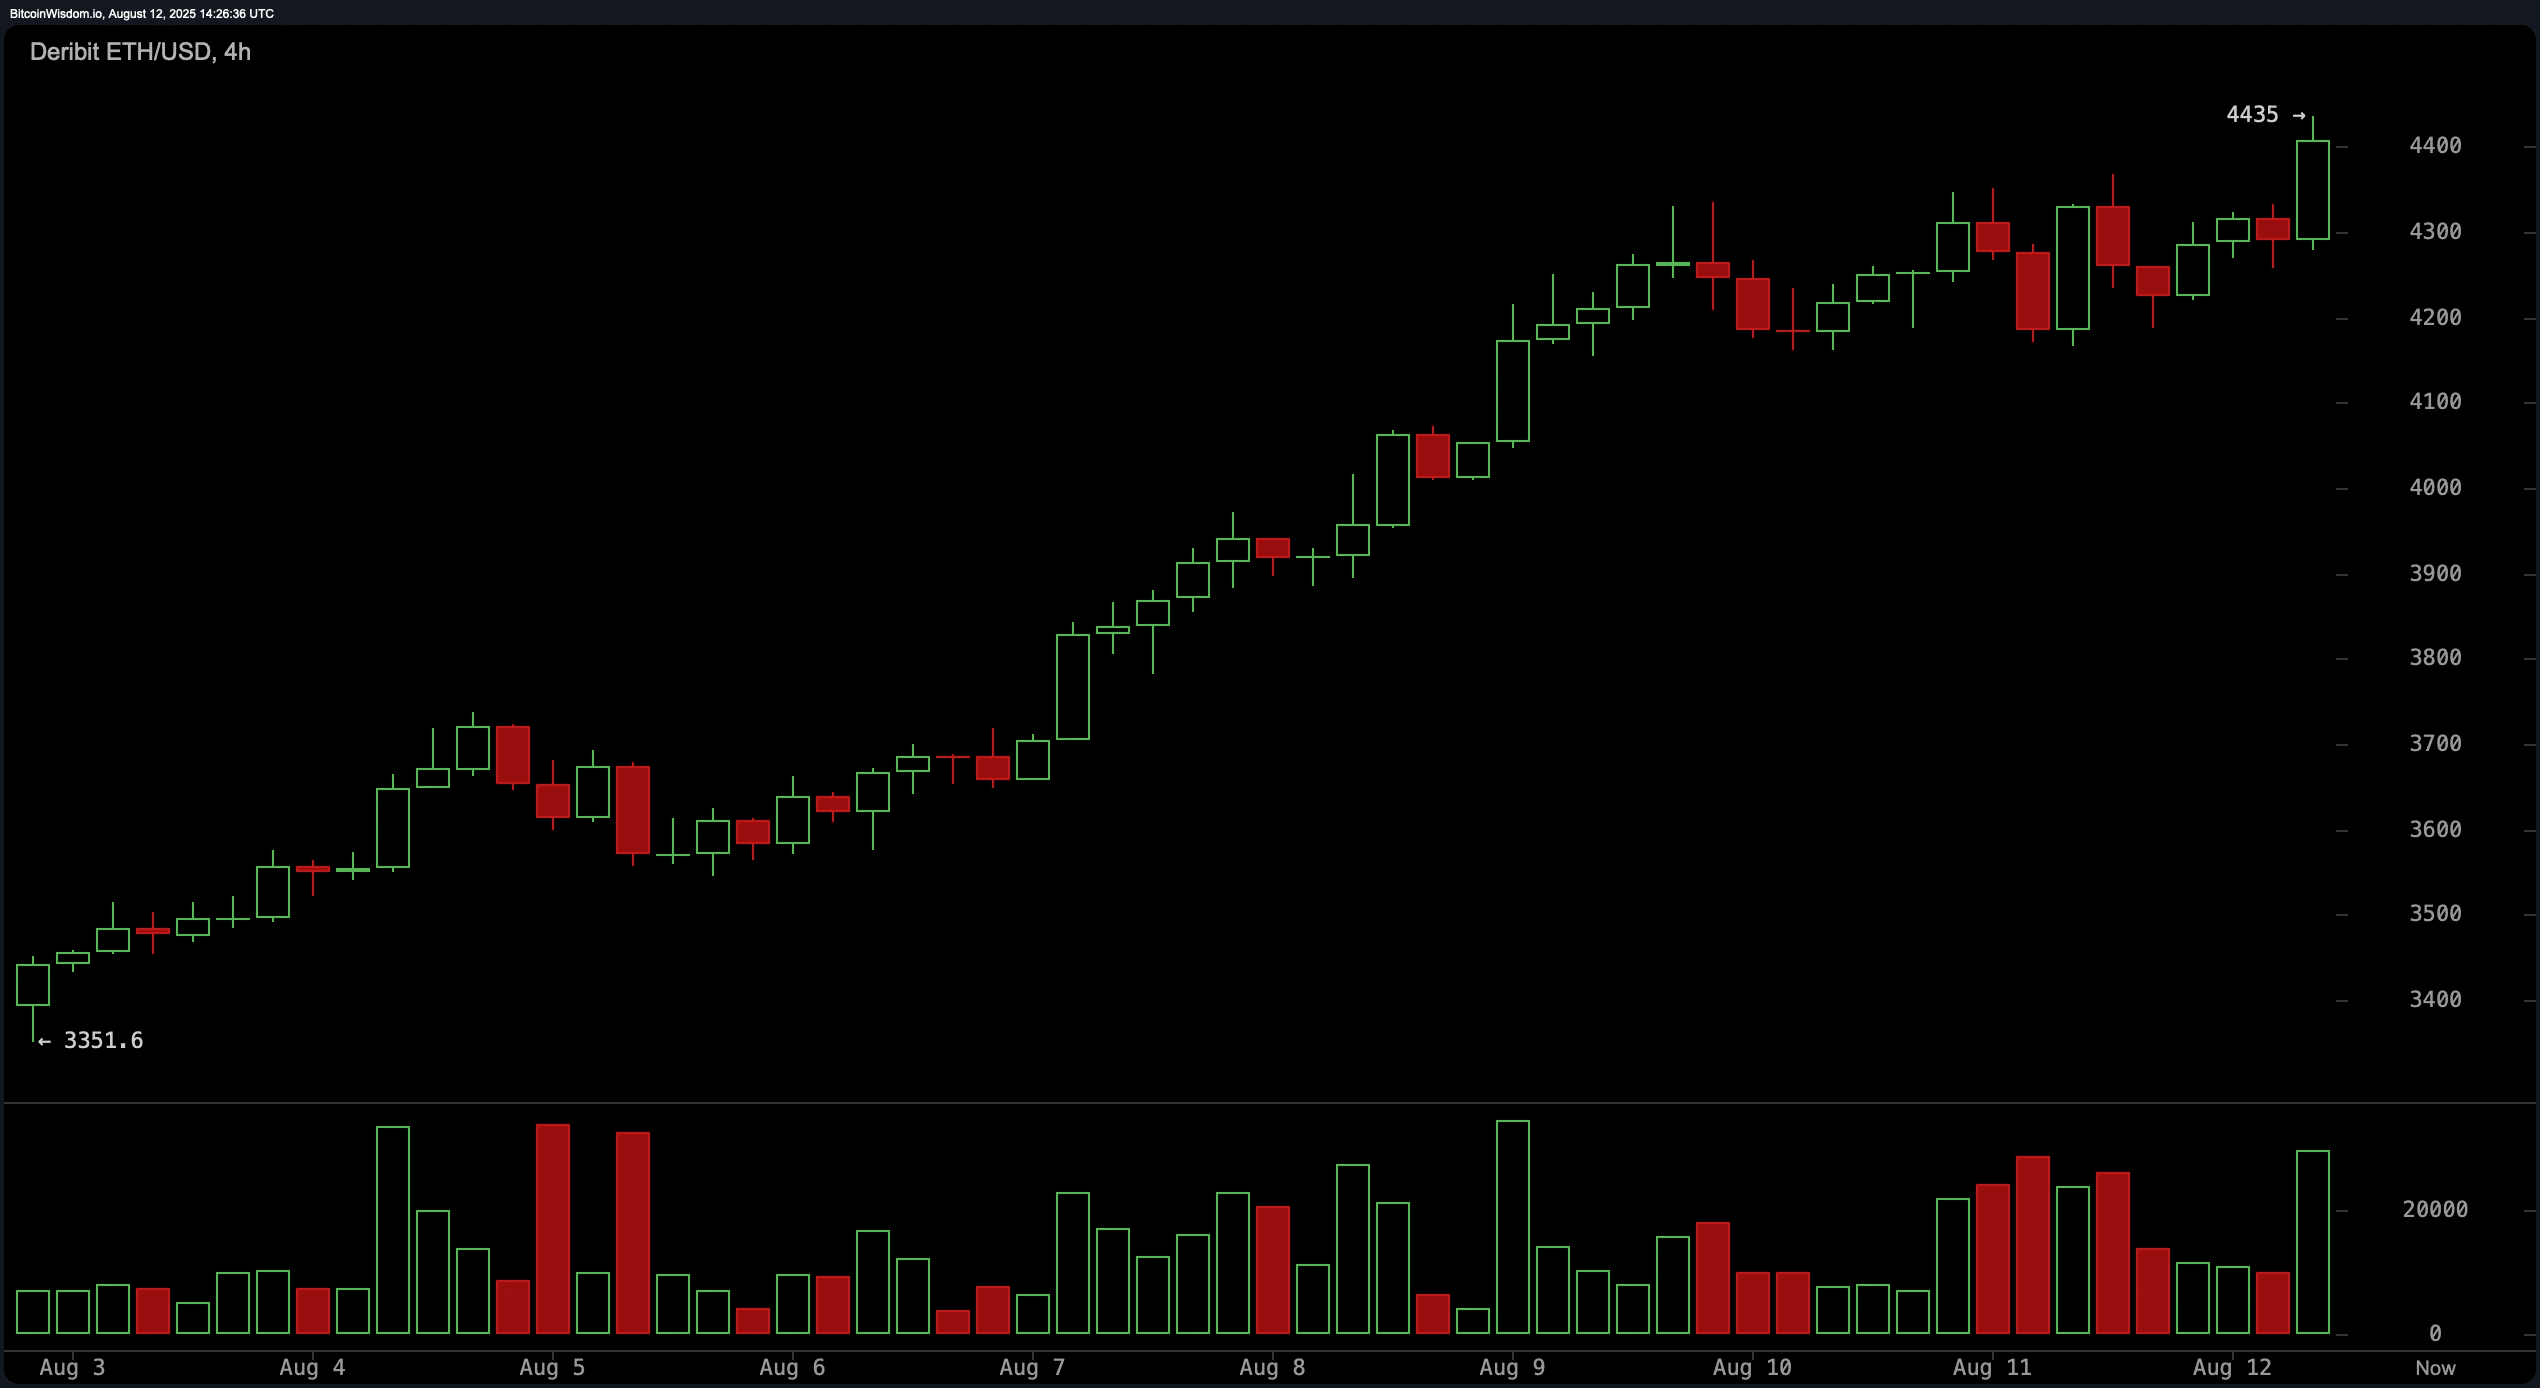
===========
On the hourly chart, Ethereum showed a sharp jump to $4,435, followed by a moderate profit reduction.
A large green candle with high volume underscored aggressive buying interest, although sellers quickly emerged at resistance.
The subsequent consolidation suggests that intraday traders are awaiting a decisive breakout. A clean move above $4,435, supported by volume, could lead to momentum plays up to the psychological mark of $4,500, while failure to hold could trigger short-term pullbacks.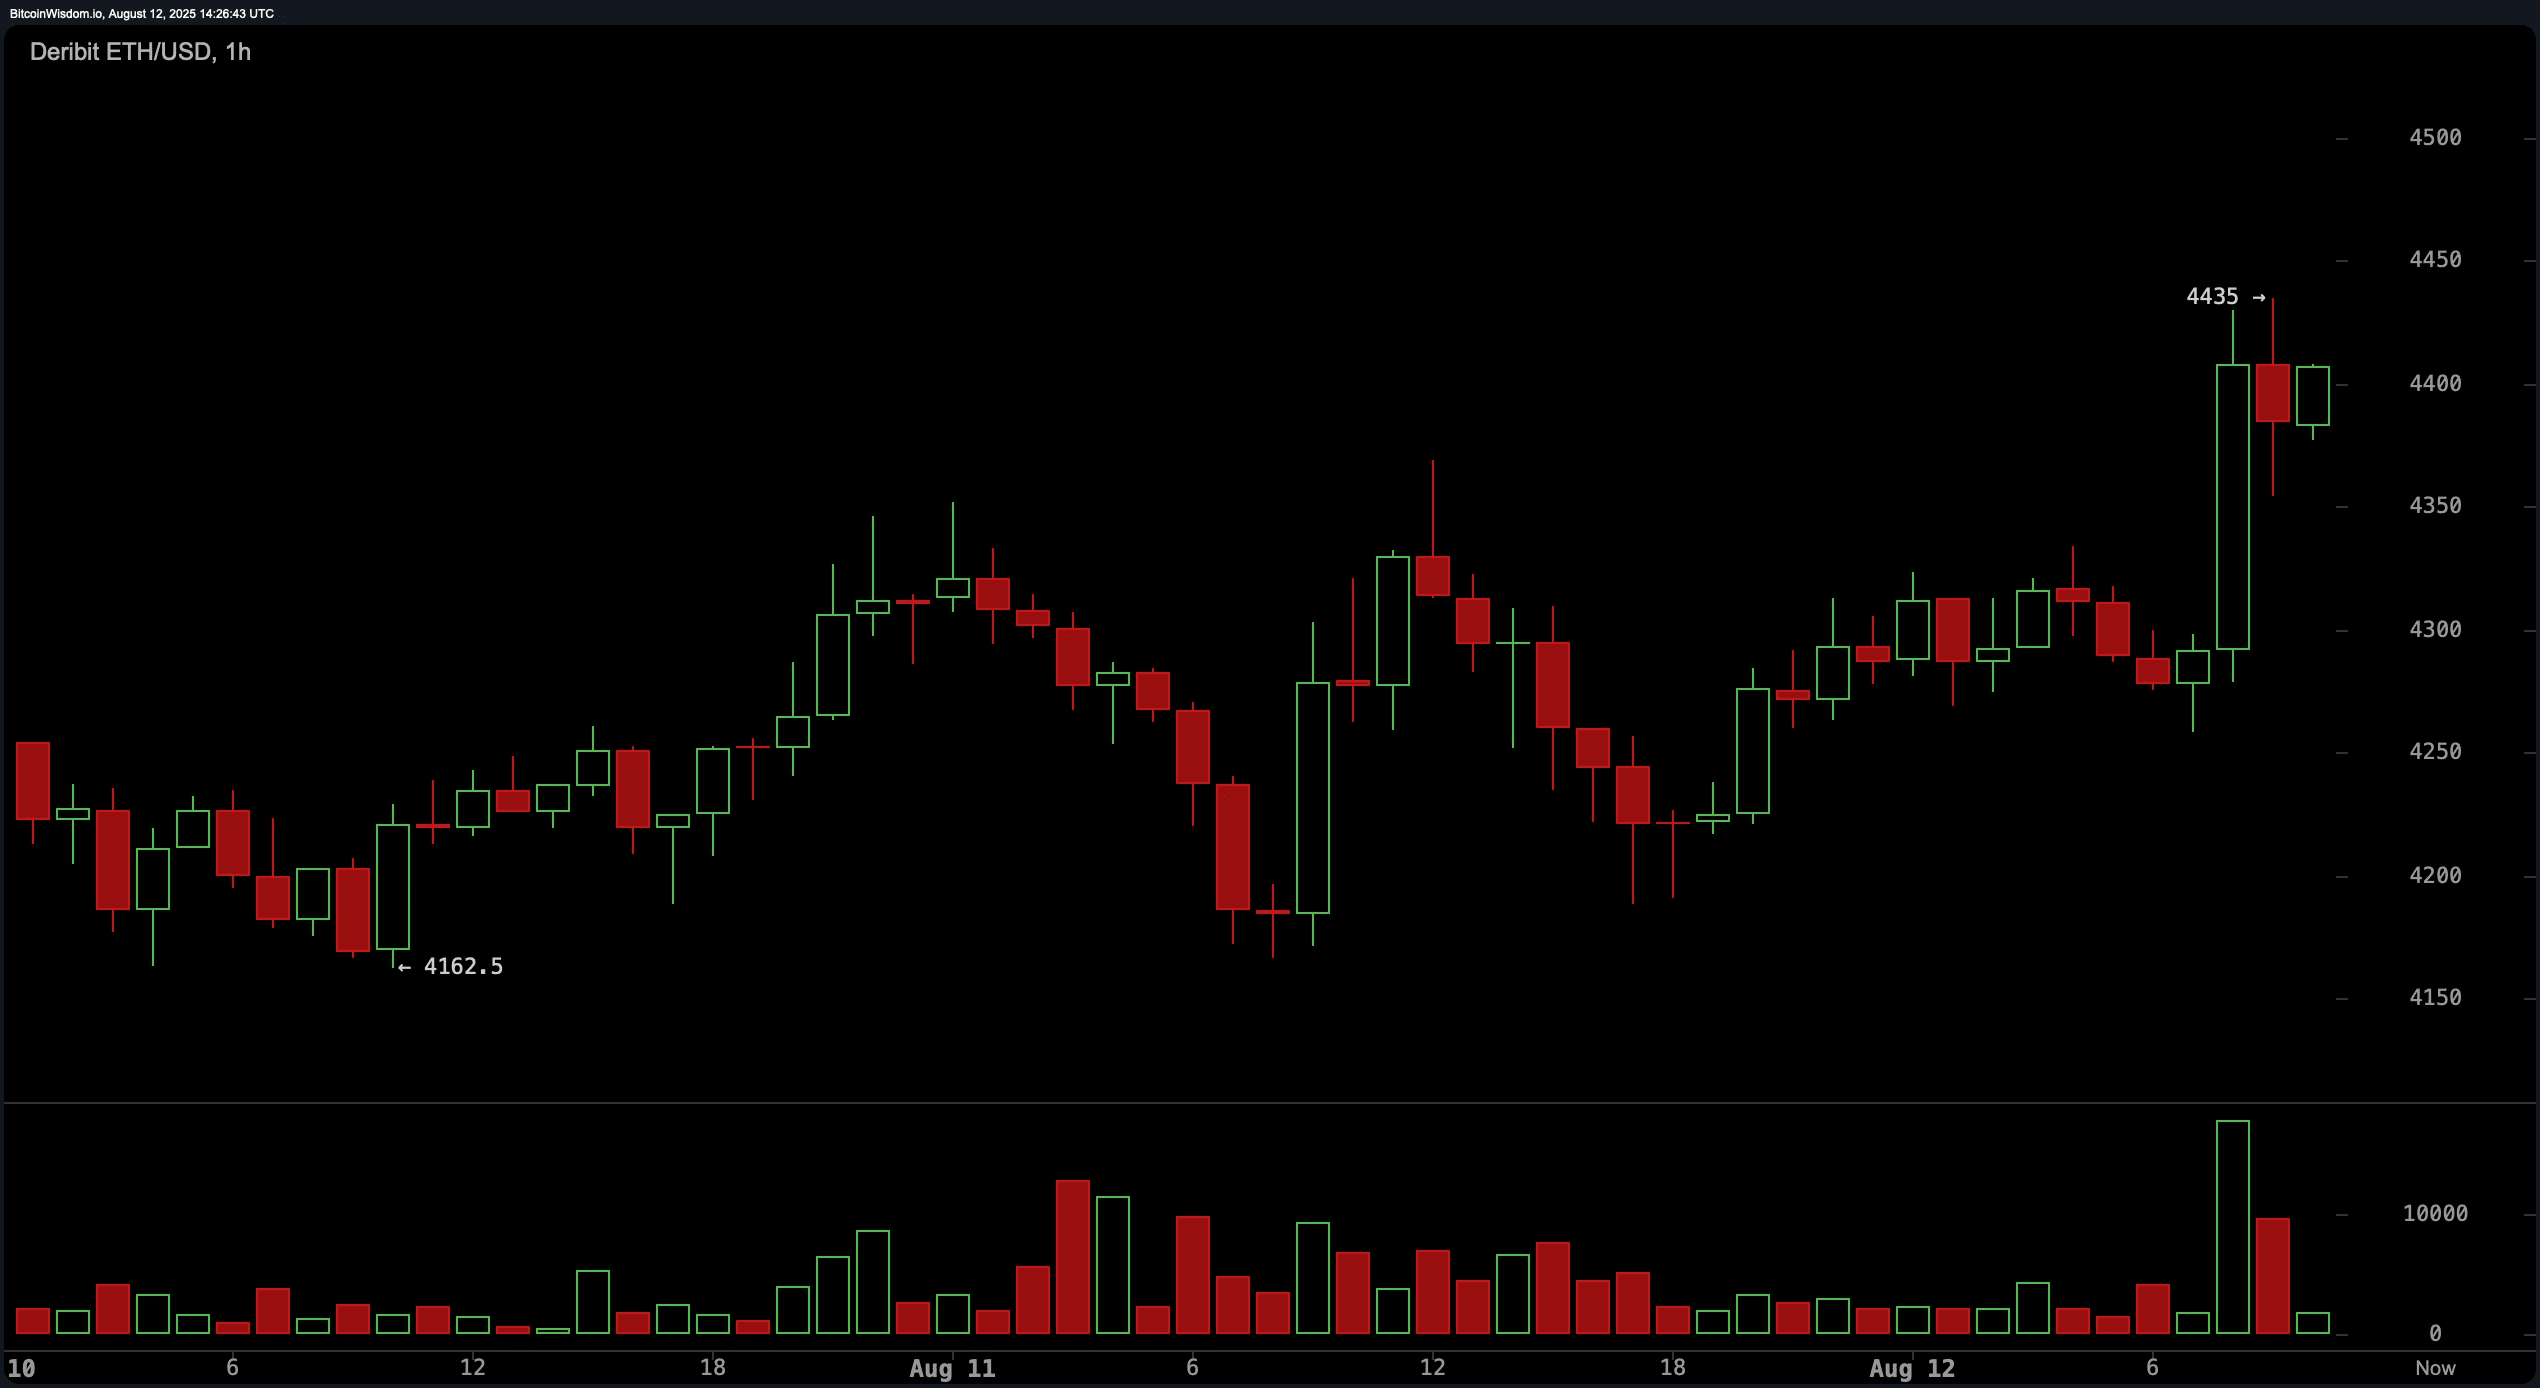
===========
Bullish verdict:
The multi-timeframe bullish structure of Ethereum, strong support at $4,300, and consistent buy signals from exponential moving averages (EMA) and simple moving averages (SMA) suggest that the asset is well-positioned for further growth.
A confirmed breakout above $4,435 could quickly open the path to the psychological level of $4,500 and above.
==========
Bearish verdict:
Despite the prevailing uptrend, the sell signal from the commodity channel index (CCI), oversold oscillators, and resistance at $4,435 raise the risk of a short-term pullback.
Failure to hold above $4,300 could lead to deeper profit-taking towards the support zone at $4,000.
