🟢 Part 1 – What Are Indicators
Ever seen charts full of lines and colors and thought:
“Bro what is even going on here??” 😵💫
You’re not alone. I’m new too — and I just started learning indicators. Learn what I learn
No confusing stuff. Just real talk for everyday traders.
🔍 Coming up next:
✅ RSI (Why it tells you when to enter/exit)
✅ Moving Averages (To find trends easily)
✅ MACD (That double-line thing on everyone’s chart)
And many more
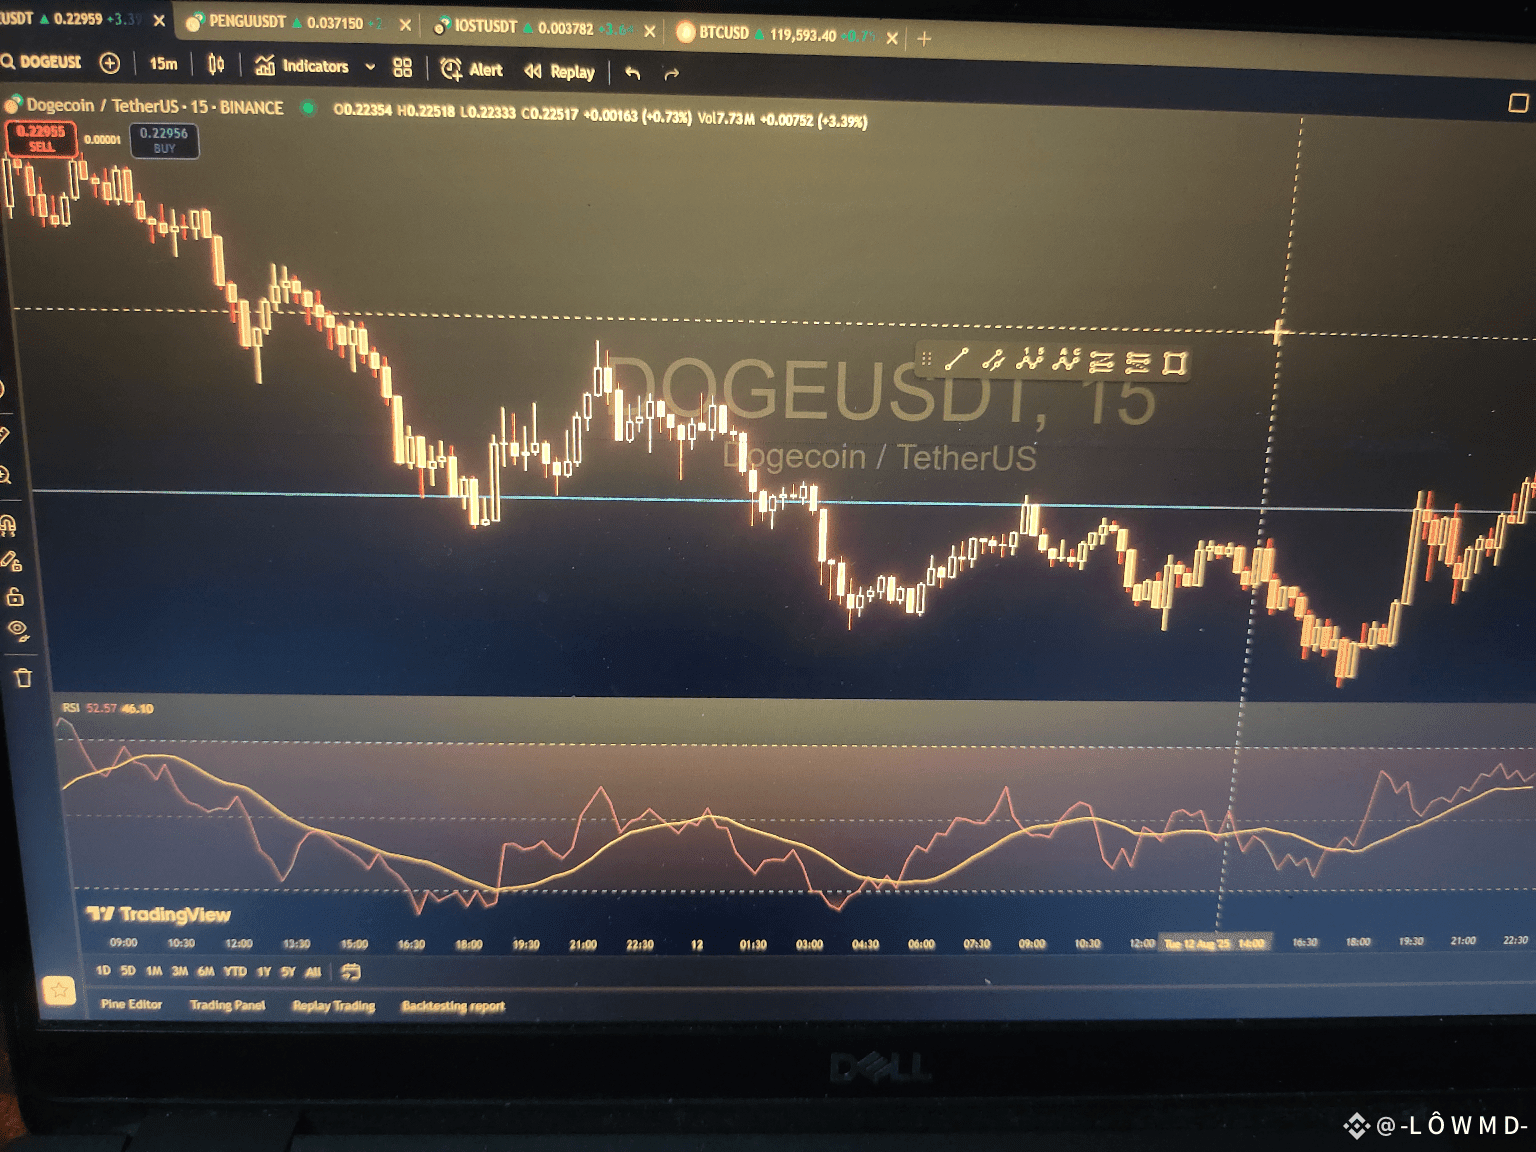
🟢RSI — The Emotion Detector of Crypto Charts
RSI = Relative Strength Index.
It’s just a number between 0 and 100, but it tells you when a coin might be:
📉 Oversold (RSI below 30) → price might bounce
📈 Overbought (RSI above 70) → price might dump
Example:
You see $PEPE with RSI at 25? Might be a buy-the-dip opportunity.
RSI at 85? Chill bro... someone’s FOMOing too hard 🥵
The beauty of RSI?
It's not magic — but it's one of the easiest ways to spot momentum
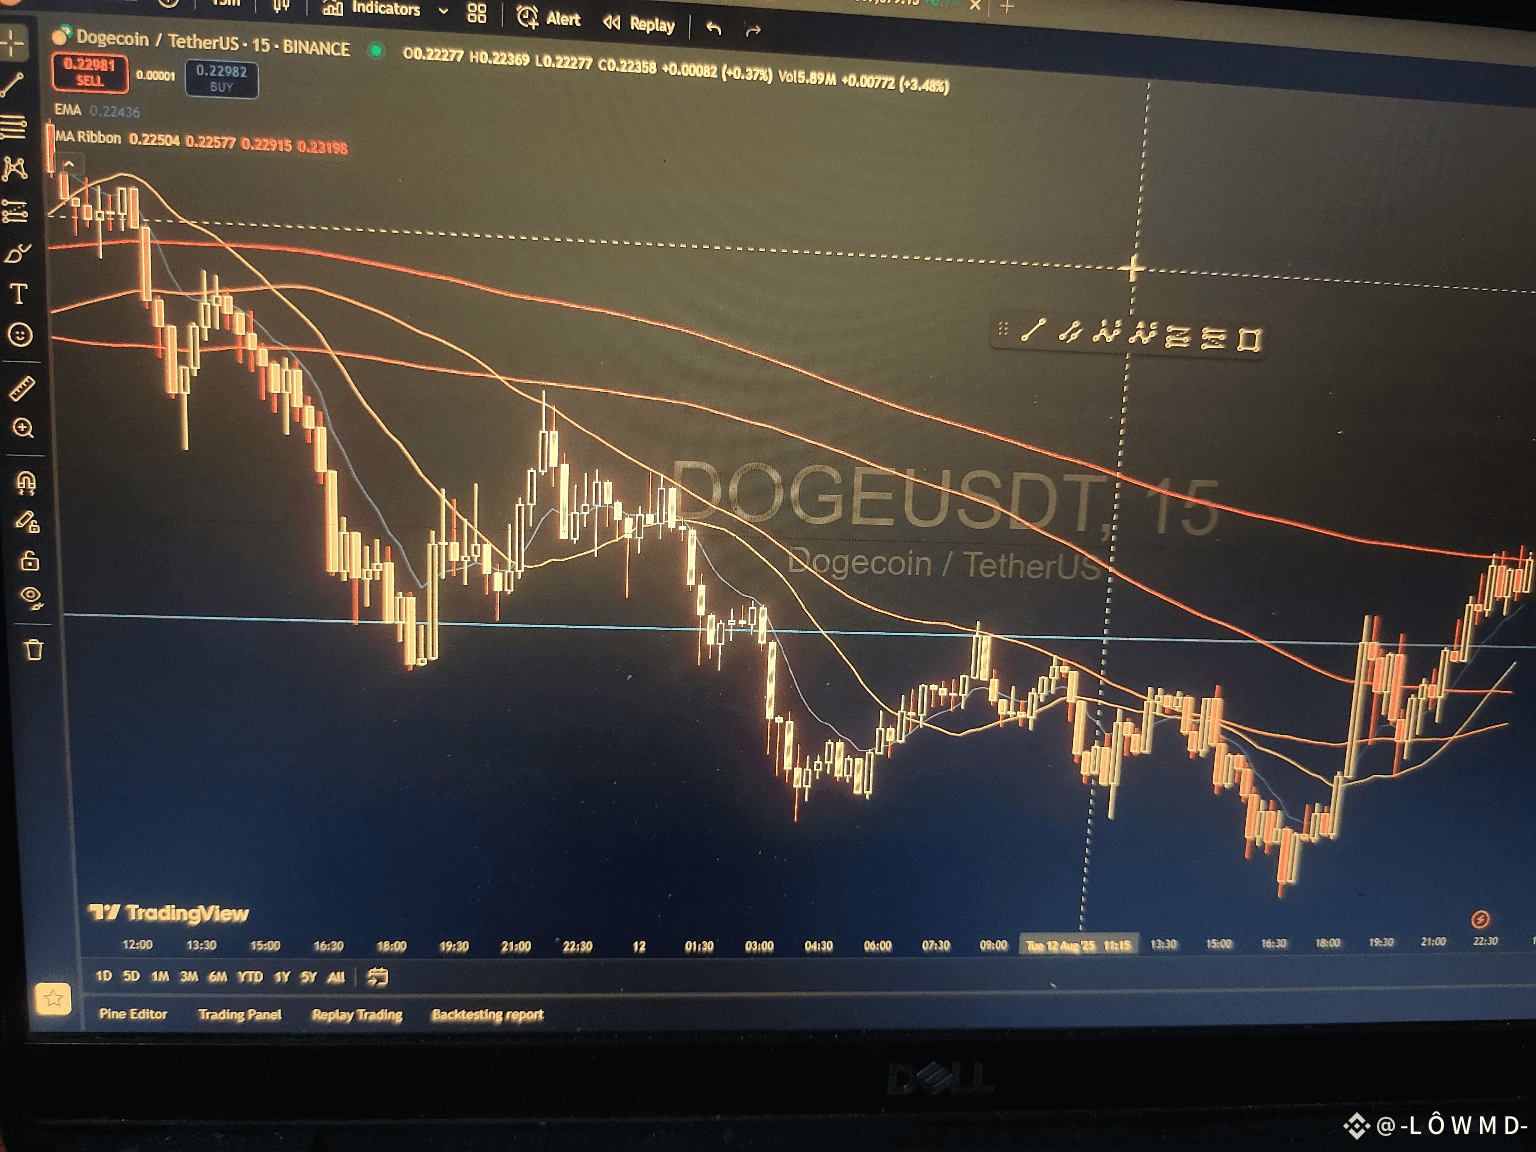
🟢Moving Averages
Moving averages are one of the most widely used tools in technical analysis. They help smooth out price data, making it easier to identify the underlying trend.
Types of Moving Averages
Simple Moving Average (SMA): Calculates the average price over a specific period. Best for identifying long-term trends.
Exponential Moving Average (EMA): Gives more weight to recent prices, making it more responsive to current market movements.
How Traders Use Them:
Trend Direction: Price above the moving average often indicates an uptrend; price below may suggest a downtrend.
Golden Cross: A shorter-term MA (e.g., 50-day) crossing above a longer-term MA (e.g., 200-day) is considered a bullish signal.
Death Cross: The opposite of the Golden Cross; often interpreted as a bearish sign.
Pro Tip: Combining different moving averages (dual or triple crossover strategies) can help filter out false signals and confirm trends more effectively.
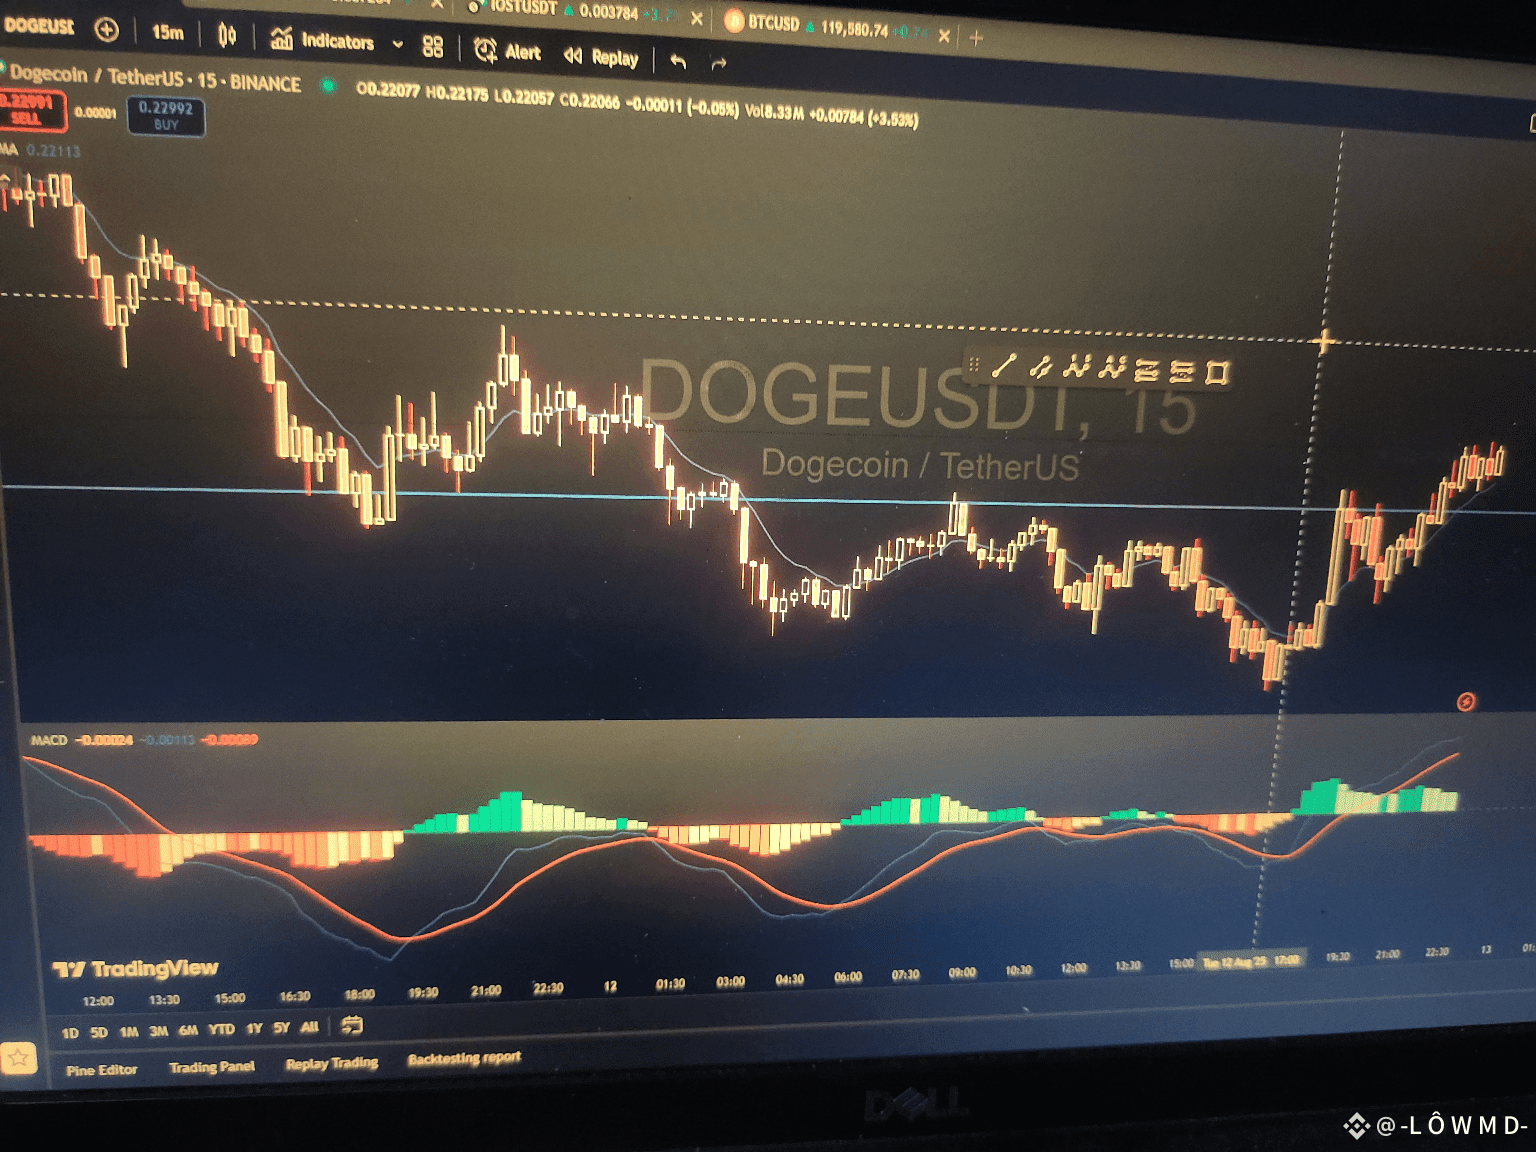
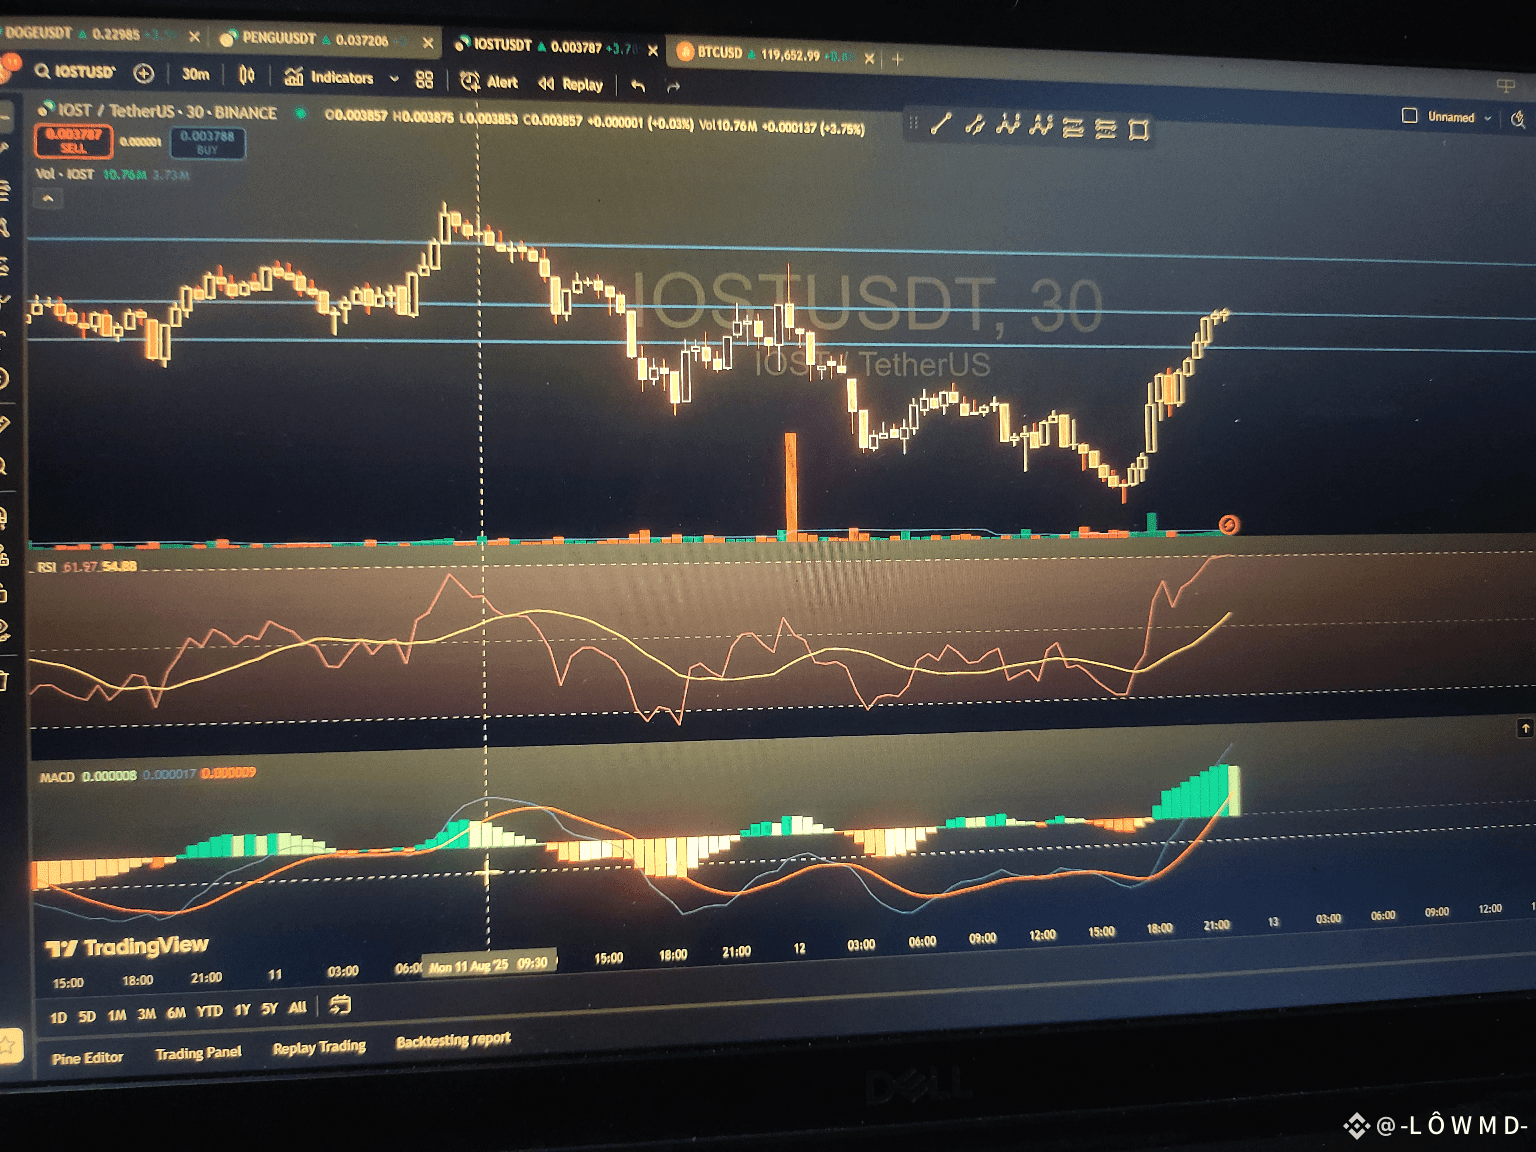
🟢The MACD
(Moving Average Convergence Divergence) is one of the most popular indicators for spotting trend changes and momentum in trading.
It’s made up of 3 main parts:
1️⃣ MACD Line – Difference between two EMAs (usually 12 & 26).
2️⃣ Signal Line – 9-period EMA of the MACD Line.
3️⃣ Histogram – Shows the gap between MACD and Signal lines.
How traders use it:
✅ Bullish Signal – MACD crosses above the Signal line.
✅ Bearish Signal – MACD crosses below the Signal line.
✅ Histogram expanding = strong momentum; shrinking = weaker momentum.
⚠️ Pro tip: Always combine MACD with other indicators like RSI or support/resistance for higher accuracy.
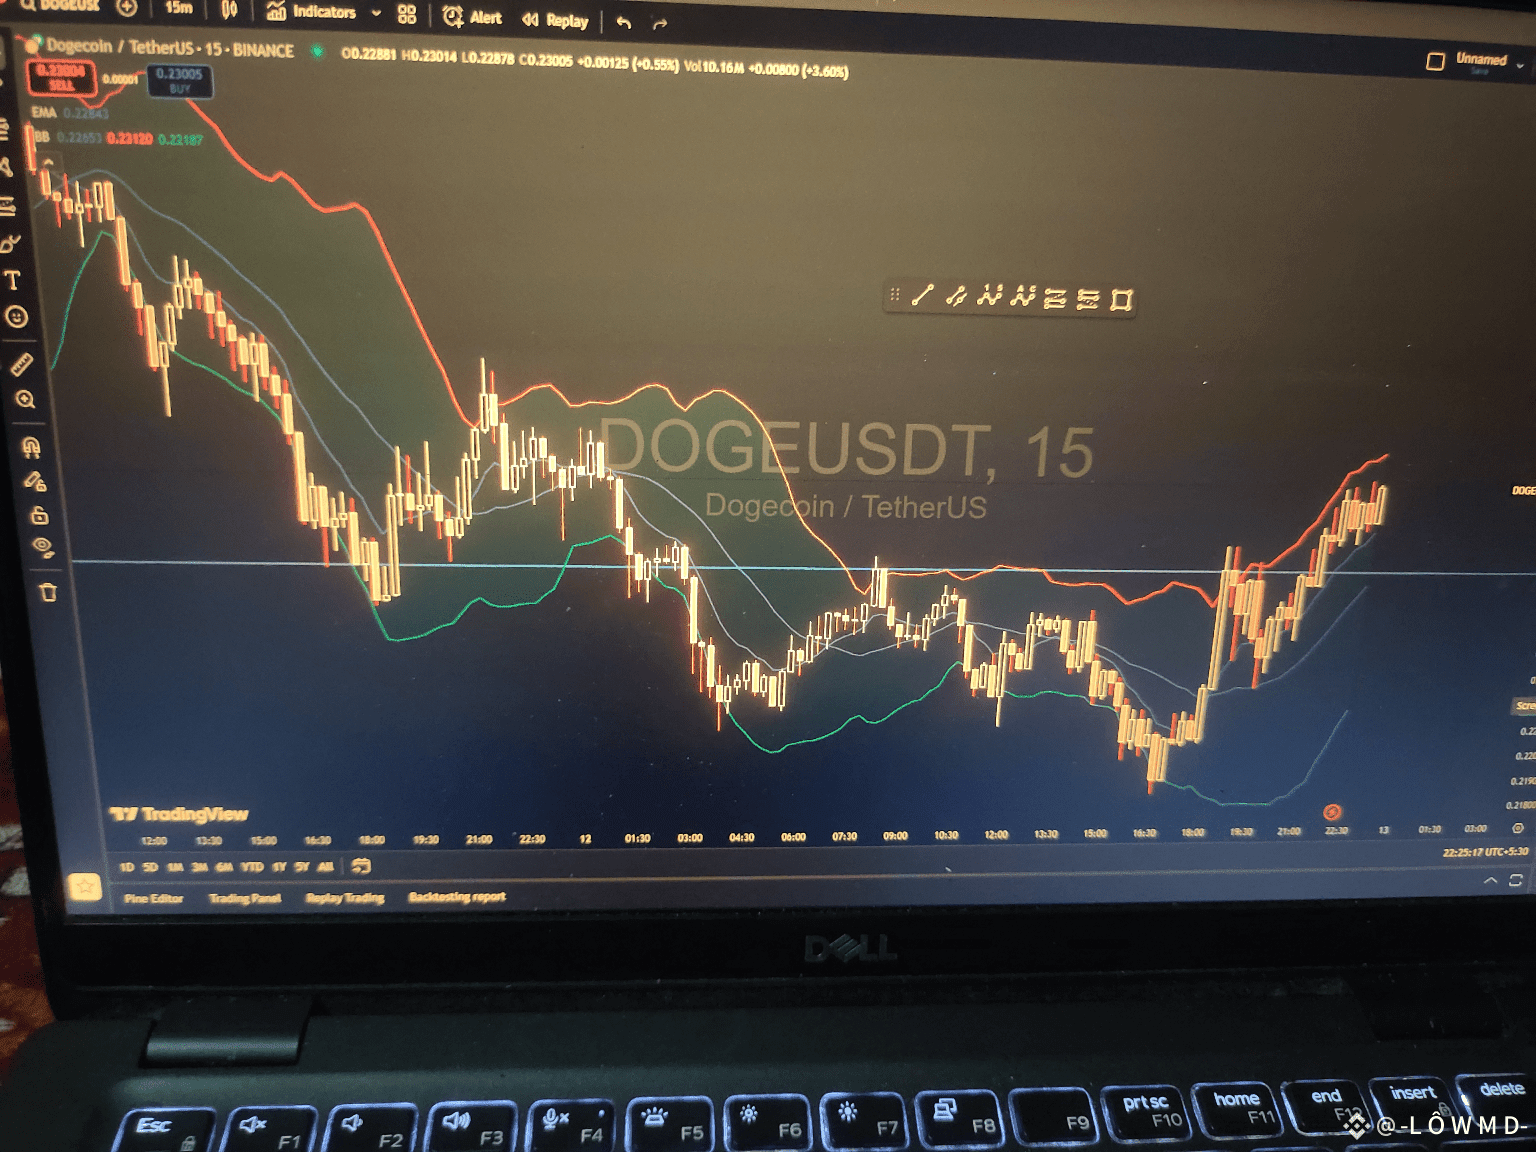
🟢Bollinger Bands
Bollinger Bands are your go-to for reading volatility and spotting potential trend reversals—even before they happen.
They consist of three lines:
Middle Band (SMA) — typically a 20-period Simple Moving Average.
Upper Band — Middle + (2 × standard deviations).
Lower Band — Middle – (2 × standard deviations).
How they help you trade:
Price touching upper band → possible overbought (time to take profit).
Price touching lower band → potential oversold (buy setup).
Bands narrowing (squeeze) → low volatility, breakout likely on the way.
Bands widening → high volatility, trend is in motion.
Pro Tip: Combine with RSI or MACD to confirm signals and avoid false entries.
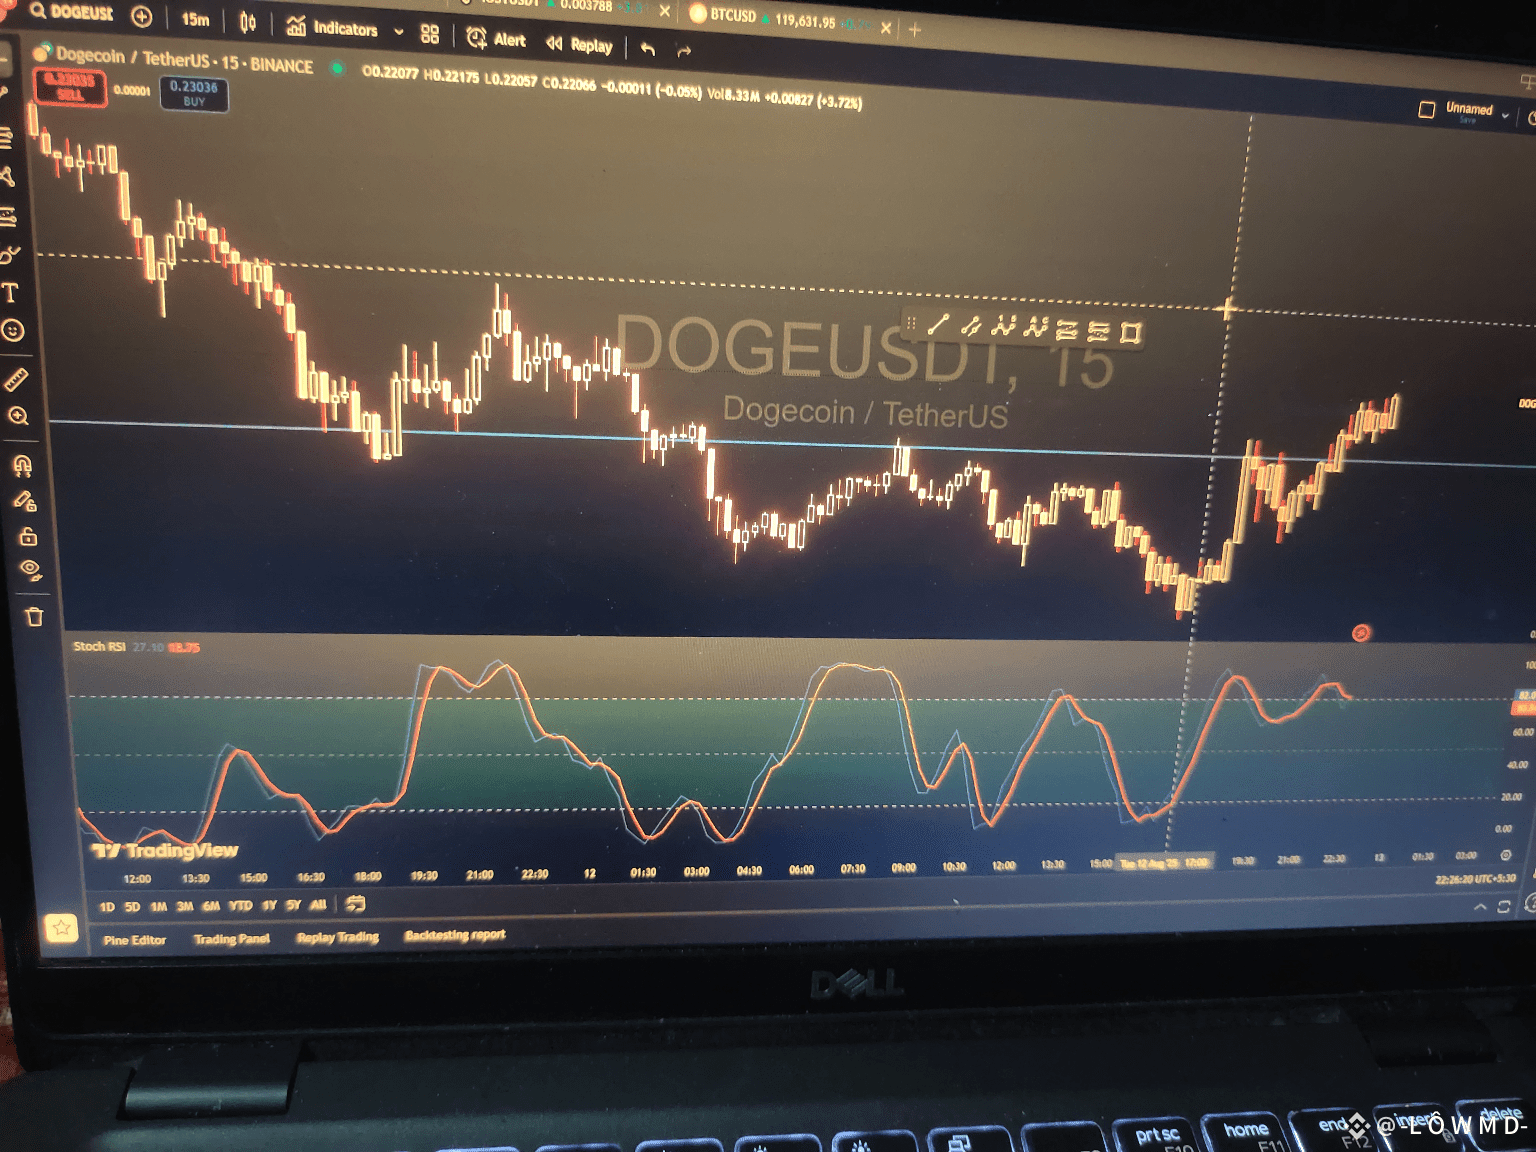
🟢Stochastic Oscillator (Bro Talk Edition)
Bro, ever feel like the market is moving before you even see it coming? 👀
That’s where the Stochastic Oscillator becomes your early-warning radar.
Here’s the deal:
It basically checks where the current price is compared to the highest & lowest prices in the last few candles — and then tells you if the market’s getting too hyped or too scared.
How to read it, bro:
Above 80 → Overbought → market might chill soon 😎
Below 20 → Oversold → could be time for a bounce 🚀
%K crossing above %D below 20 → possible buy vibes 💵
%K crossing below %D above 80 → maybe time to lock profits 📉
🔥 Pro move: Don’t trust it alone, bro. Pair it with RSI or MACD so you don’t get faked out.
FINAL Move: The Bro Combo
Listen bro… using just one indicator is like trying to win PUBG with only a pistol — you can do it, but why risk it?
The real boss move is when you combine them and make ‘em work together.
Here’s my fav deadly combo:
Bollinger Bands → tells me if the price is stretched like my old jeans.
RSI → checks if it’s too overbought or oversold.
MACD → shows me if the trend’s still got juice or if it’s about to flop.
Example time 👇
Price kisses the upper Bollinger Band → “hmmm sus…”
RSI > 70 → “okay bro, overbought confirmed”
MACD cross down → “BRO EXIT NOW 🚨”
That’s the Triple Bro Signal — saves me from FOMO traps and fake pumps.
IF YOU ALL LIKE THIS ARTICLE. DO DROP A LIKE AND FOLLOW ME FOR ME.
Comment your views on using indicators
#Write2Earn #CryptoEducation💡🚀