In summary
The price $ZORA increased by 80% over the week, as NFT release activity and whale accumulation led to strong buying pressure.
The 4-hour RSI shows hidden bullish divergence, which often indicates consolidation within an ongoing upward trend.
Holding above $0.11 could lead to a re-test of $0.14 and a potential new all-time high.
ZORA has become one of the fastest-growing new tokens over the past week: in just seven days, the price increased by nearly 80%, reaching a peak of $0.14. The significant price growth of ZORA was driven by a sharp increase in activity on the NFT minting platform, attracting new creators and collectors.
The increase in protocol usage coincided with major holders continuously increasing their positions, even amid rising prices, which is a sign of confident buying rather than short-term speculation. At the time of writing, ZORA's price is consolidating around $0.12, and the key question is whether this pause is a signal of a trend reversal or just a breather before another attempt to reach new highs.
Whales are accumulating after an 80% rally
Nansen's on-chain data shows that during the same seven-day period when ZORA's price rose by 80%, exchange whales and known wallets continued to accumulate funds.
This is notable, as accumulation during rapid price increases often signals confidence in further growth; most whales tend to take profits during rising periods rather than increase risk unless they are very certain about continued growth.
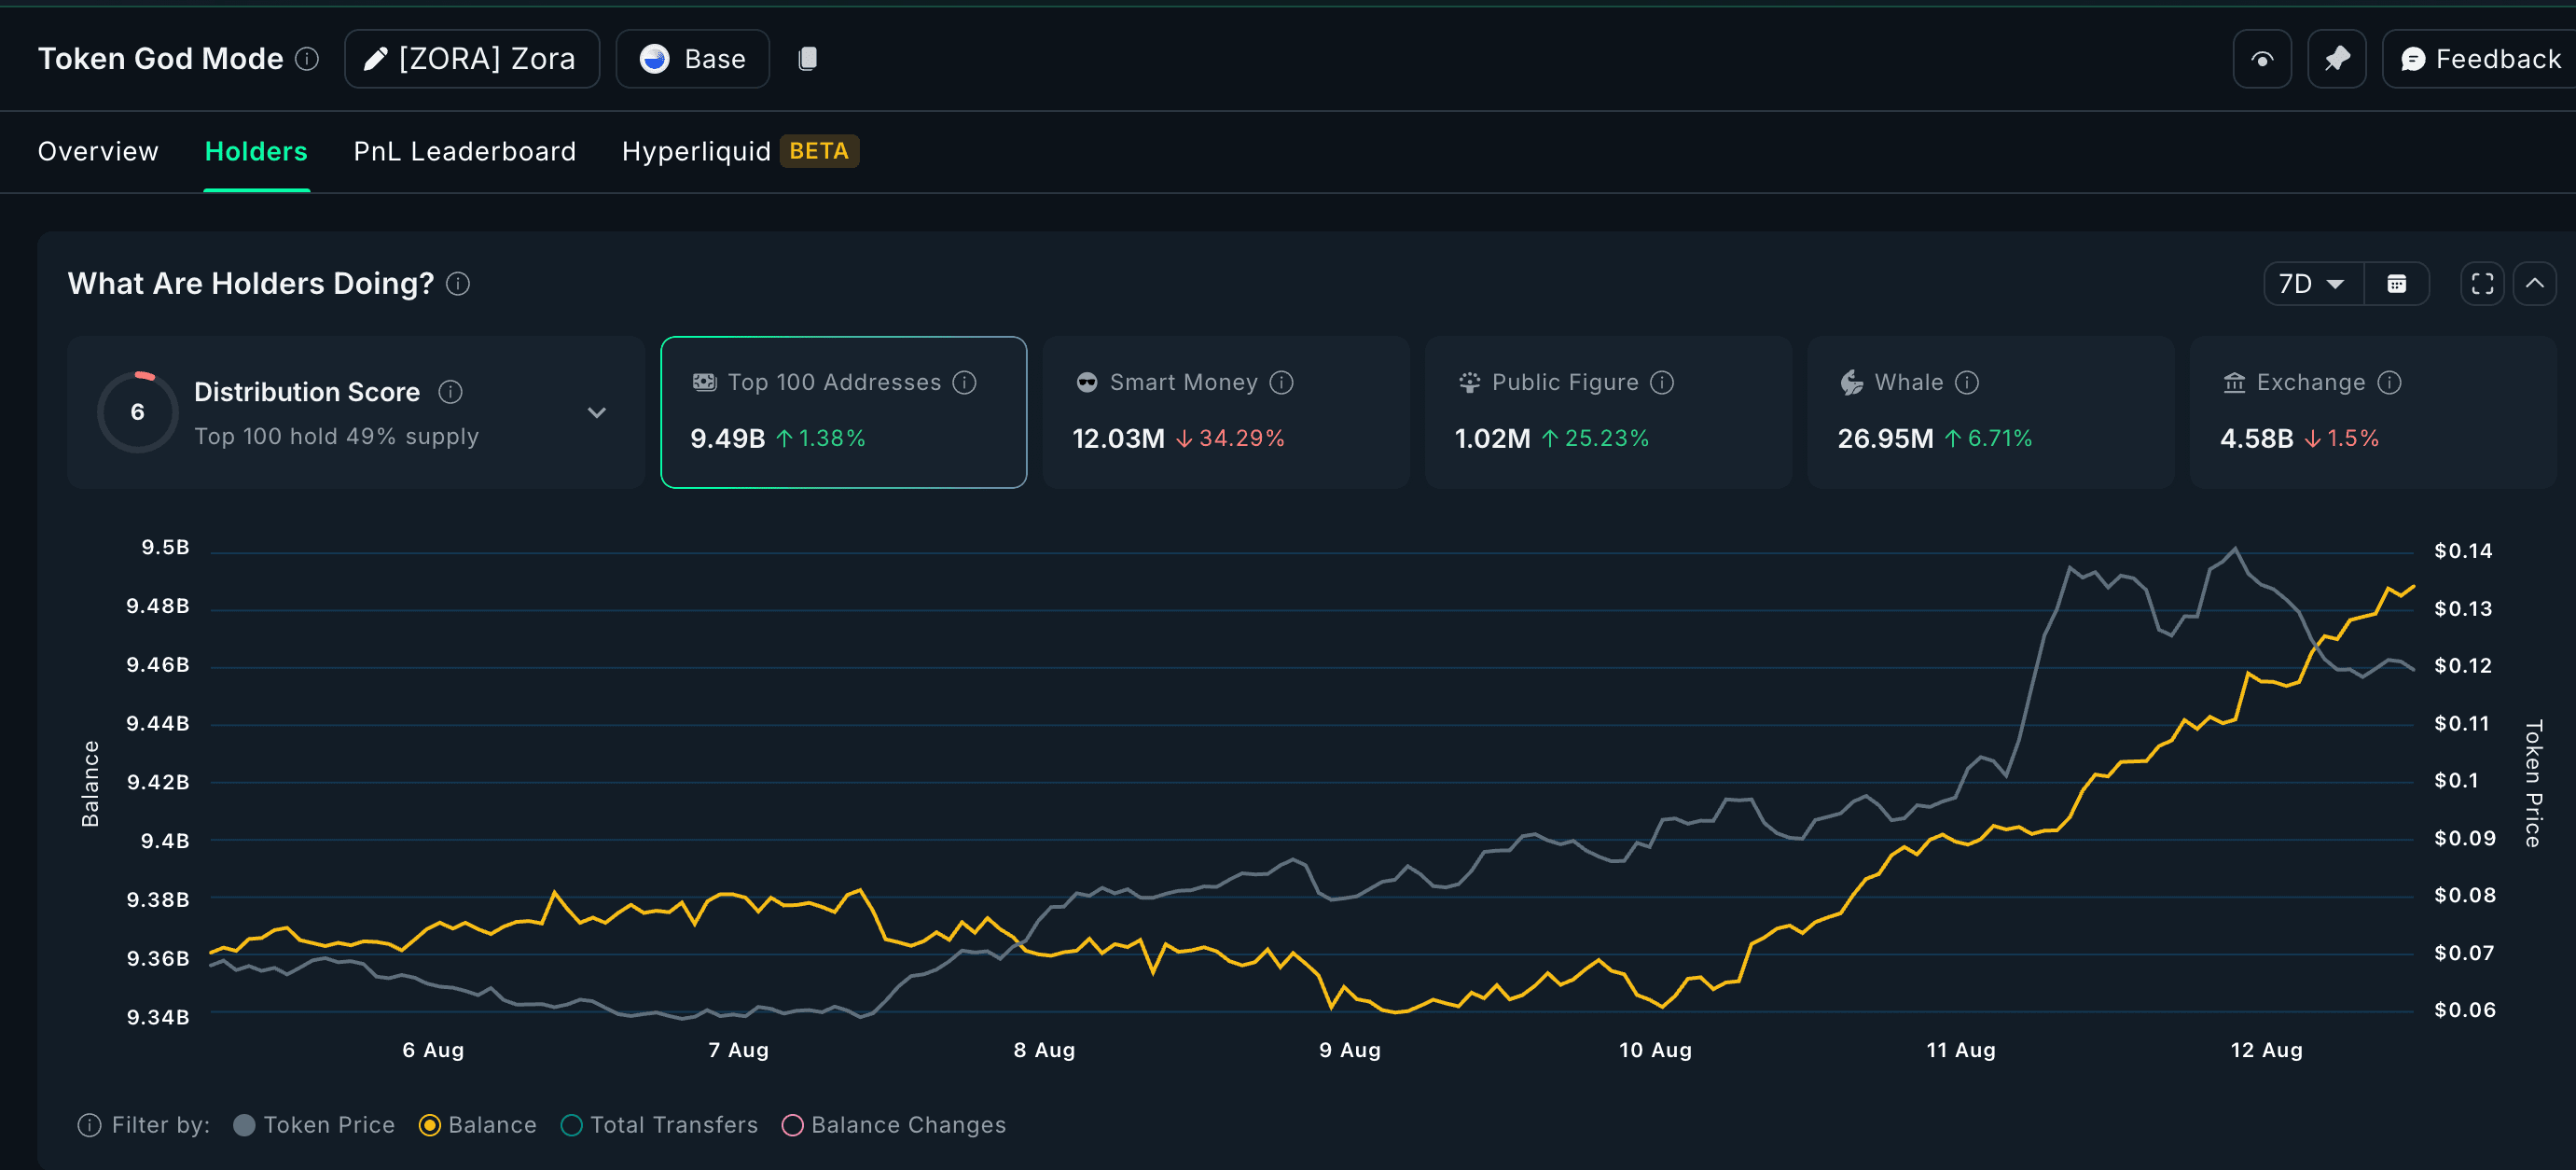
Zora balances on exchanges have also decreased over the week, indicating a reduction in the number of tokens available for sale in the open market. Over the past seven days, 69.75 million ZORA tokens have left exchanges.
The only group opposing this trend is the 'smart money' (addresses known for their timing accuracy), which reduced their assets by $6.28 million. Such an outflow from the most tactical wallets may explain why the rally has paused, but the broader asset distribution among 'whales' indicates that the upward trend still has strong support.
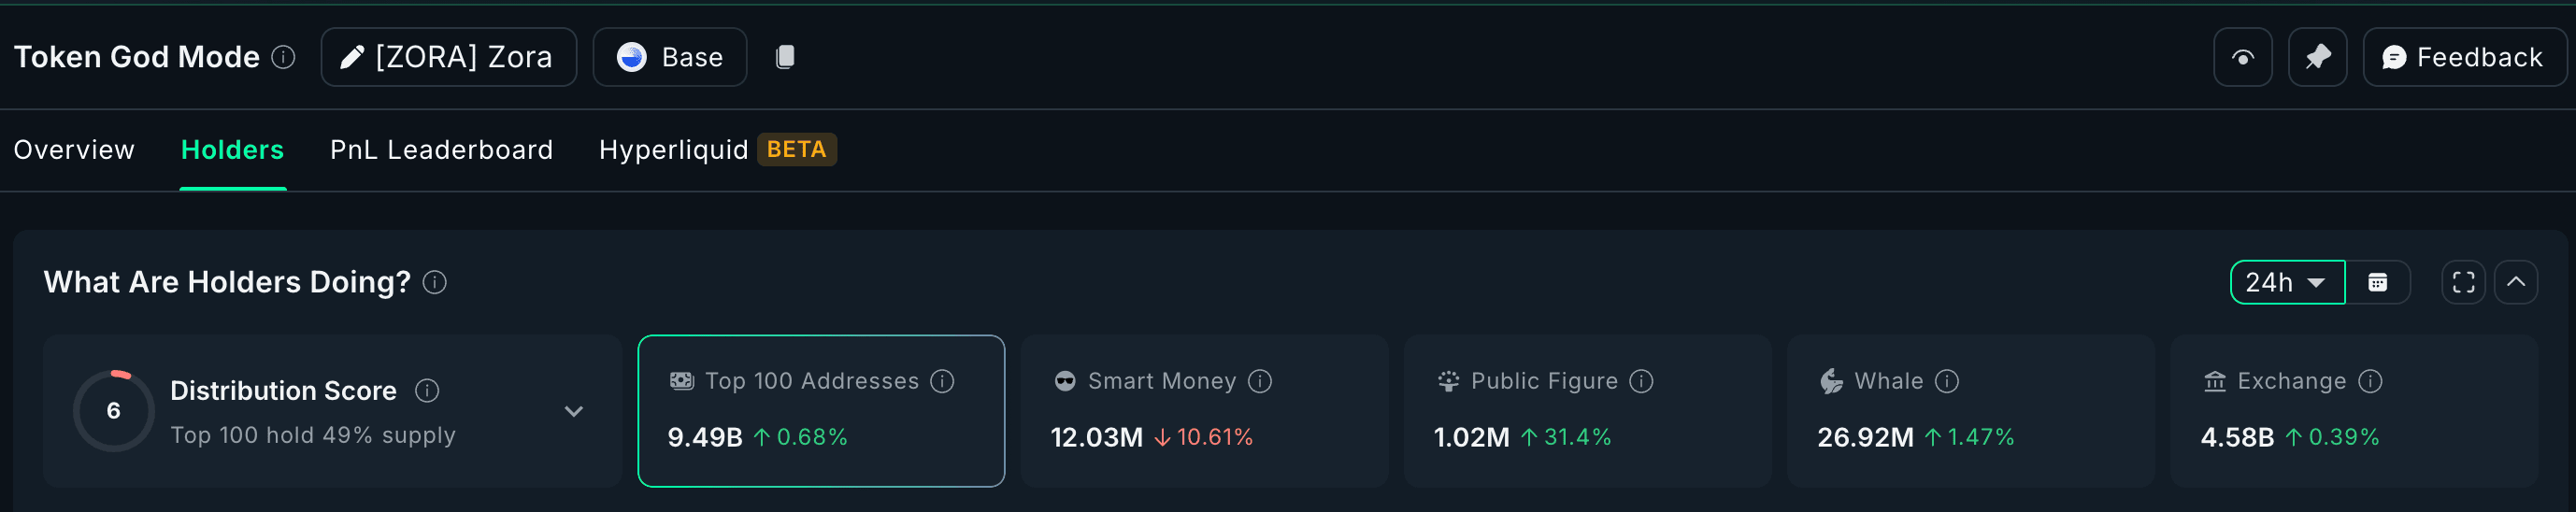
And the most compelling argument for the consolidation of ZORA stock prices is the 24-hour accumulation trend. Despite the decline, 'whales' continued to actively buy.
Hidden bullish divergence signals that the trend is still alive
It's important to consider the 4-hour chart $ZORA (instead of the daily), as the token was launched only a few months ago, and there is little historical data on it. On this shorter timeframe, the relative strength index (RSI) formed a lower low while the price reached a higher low, which is hidden bullish divergence.
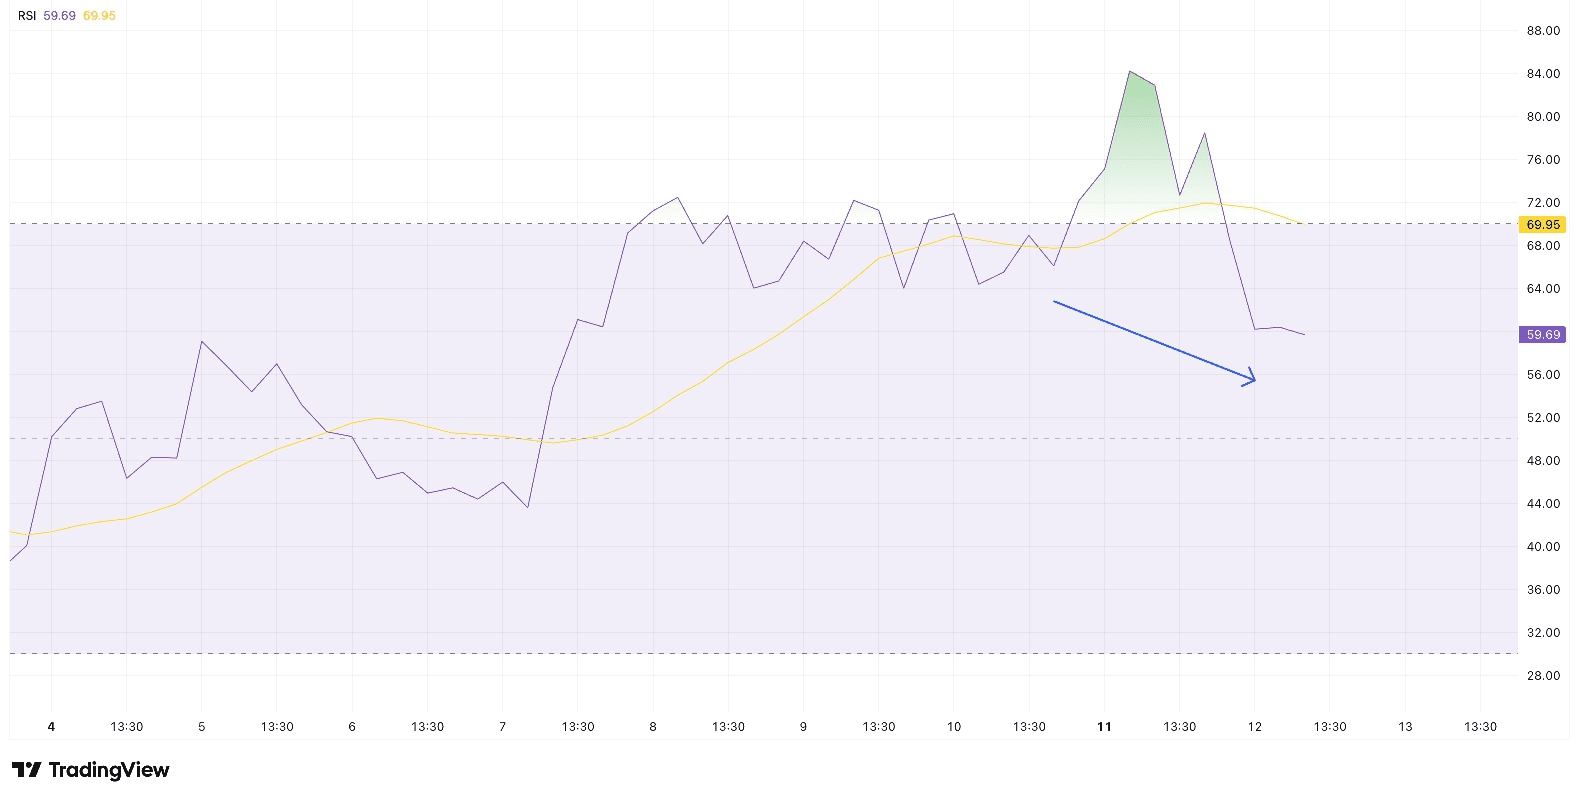
Such a model often arises in the middle of a trend, during rapid pullbacks, indicating that momentum has cooled, but the underlying structure remains bullish.
The relative strength index (RSI) is a momentum indicator that measures how quickly and how much the price of a coin changes.
In practice, the market is restructuring without interrupting the upward trend, coinciding with accumulation trends observed on the network.
Key levels defining the next price level for ZORA
The price of Zora remains within an expanding ascending wedge, typical of a bearish reversal pattern. The upper boundary around $0.148 remains a key short-term target. Another test of this level could pave the way for continued growth, but a decisive breakthrough of the $0.11 support level would shift the trend toward a deeper correction.
Although the structure remains bearish, on shorter timeframes—particularly on the 4-hour chart—the model hints at consolidation rather than a breakout.
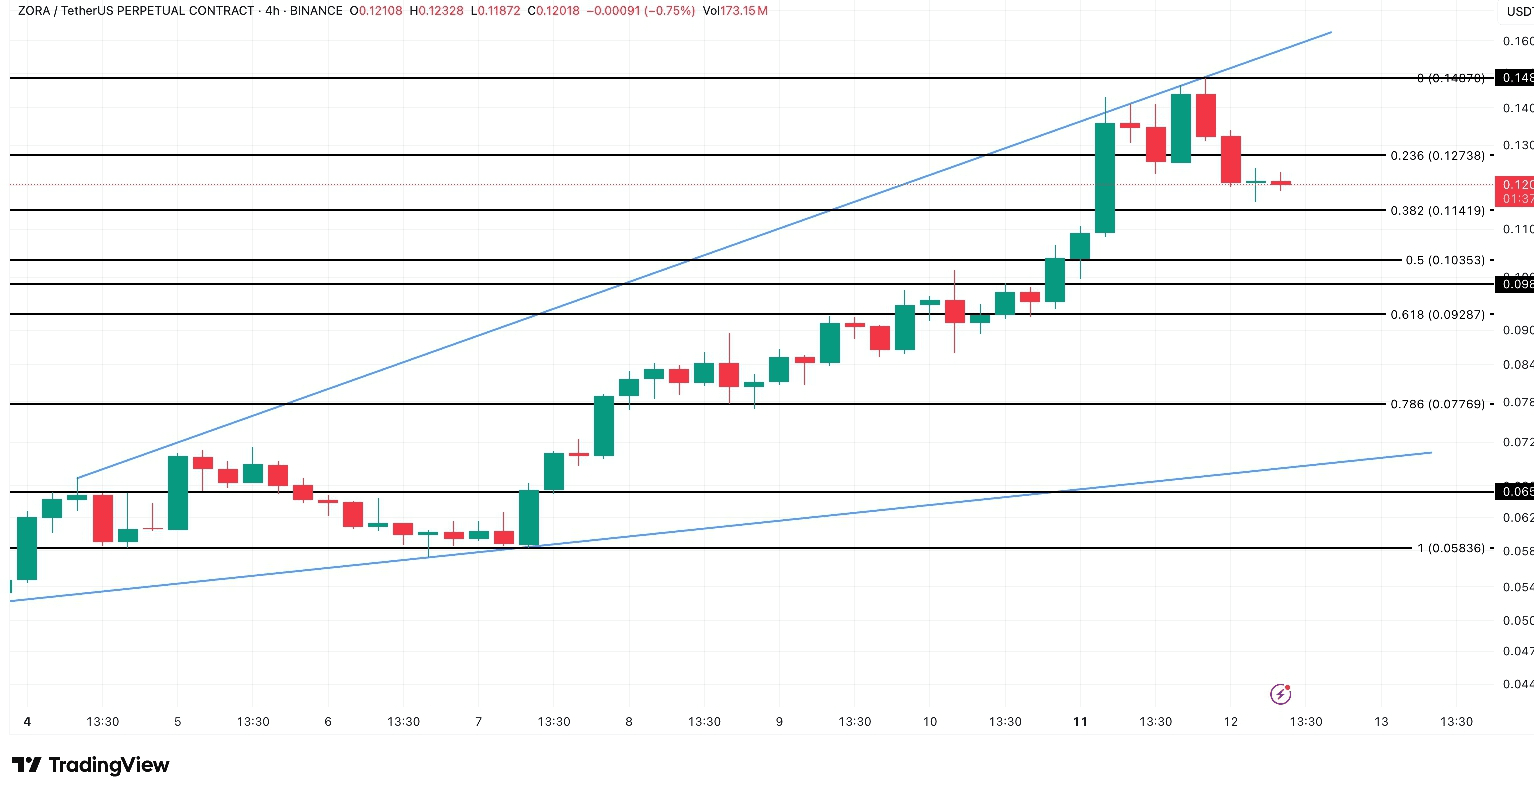
If buyers defend the $0.11 and $0.10 marks, the combination of whale accumulation, hidden bullish divergence, and ongoing NFT-related activity could lead to ZORA's price re-testing highs and possibly reaching a new all-time high in the next growth phase.
However, if the price $ZORA falls below $0.09, the entire structure will become bearish in the short term.

