A rare chart pattern hints Solana $SOL could surge toward $240 if bullish momentum holds.
Solana (SOL) explosive 35% surge from June lows has traders eyeing a potential breakout to $240 as rare bullish signals align.
Solana (SOL) hit $176.5 on Aug. 12, posting 9% gains over the past month and climbing 40% from its yearly low. With a market cap at $95.1 billion, SOL is clearly catching fire again after breaking 35% higher from its June bottom.
✨Why Big Money is Betting on SOL
Public companies are going all-in on Solana. Bitcoin mining giant Bit Mining just announced plans to raise up to $300 million specifically to buy more SOL tokens for staking rewards. Companies like Upexi and DeFi Development Corp are also loading up.
The real kicker? Solana landed a massive partnership with R3, the blockchain company that works with HSBC, Bank of America, and Euroclear. They're using Solana for tokenizing real-world assets – that's Wall Street-level validation.
Plus, daily active addresses jumped 16% in one day. When network activity spikes like that, prices usually follow.
✨The Golden Cross That Has Solana (SOL) Bulls Excited
SOL just formed a "golden cross" – when the 50-day moving average crosses above the 200-day one. The last time this happened in October, SOL shot up nearly 50% over three months. If history repeats, we could see SOL hit $ 240.
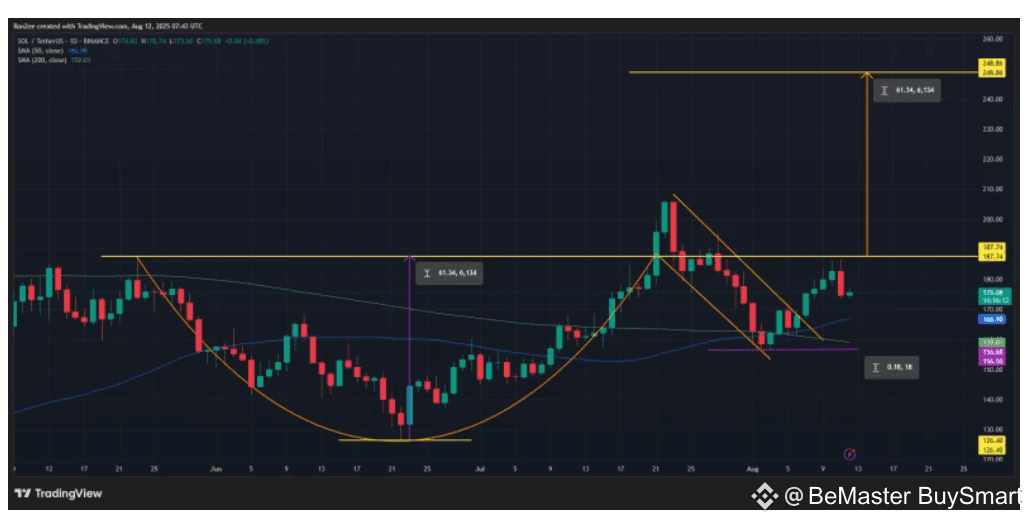
SOL also completed a cup-and-handle pattern with resistance around $187.74. The cup is roughly 48% deep, so projecting that move upward gives us a target around $248.
When you get both patterns together, that's a high-probability setup for gains. The only danger? If SOL drops below $156, all these bullish patterns fall apart.
🚀🚀🚀 FOLLOW BE_MASTER BUY_SMART 💰💰💰
Appreciate the work. 😍 Thank You. 👍 FOLLOW BeMaster BuySmart 🚀 TO FIND OUT MORE $$$$$ 🤩 BE MASTER BUY SMART 💰🤩
🚀🚀🚀 NOT JUST LIKE BUT, CLICK FOLLOW BE MASTER BUY SMART - Thank You.
