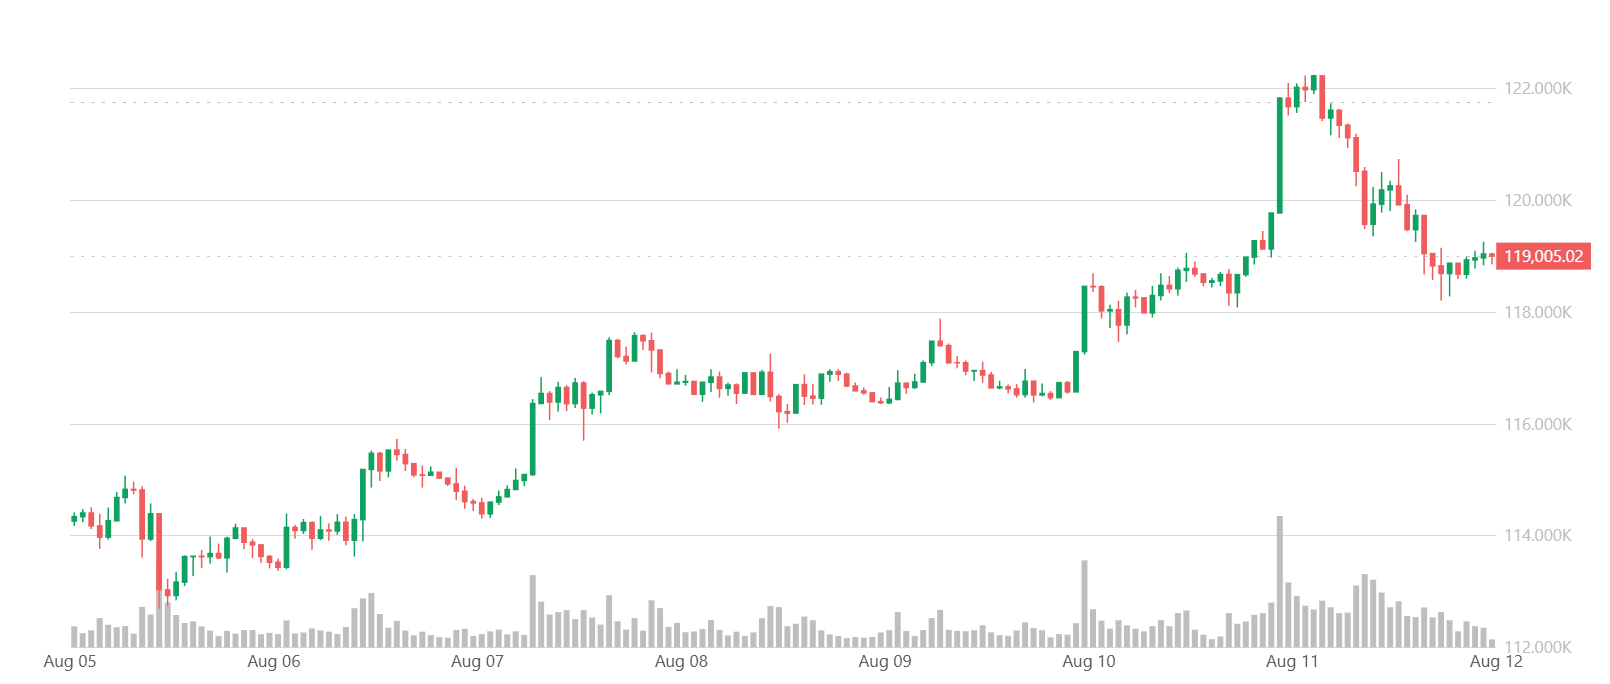
On Tuesday (August 12), during the Asian trading session, Bitcoin slightly rebounded to around $118,000, after retreating from the $120,000 mark yesterday. Traders are cautiously adjusting their positions ahead of the CPI data to prevent disruption of the upward momentum.
Bitcoin briefly broke through the $122,000 mark overnight but quickly faced significant profit-taking, subsequently dropping below $119,000 during U.S. trading hours.
Meanwhile, Ethereum remains stable above $4,200, while major altcoins SOL, DOGE, and SUI have dropped 3%-4%. Bitfinex analysts state that Bitcoin's subsequent movement will depend on the upcoming U.S. CPI and PPI inflation data, with the market likely to experience increased volatility.
On Monday, Bitcoin encountered profit-taking during its overnight push to new highs, with the price retreating to $118,500, a decline of 2.8% from the intraday high of $122,200, although it still rose 0.4% over the past 24 hours.
CoinDesk senior analyst James Van Straten pointed out that Bitcoin's weekend rebound left a gap in the CME futures market (trading only on weekdays) — with last Friday's closing price at $117,430 and Monday's opening price at $119,000. He noted that historical trends indicate that BTC may pull back to 'fill' that gap.
Bitcoin's rebound has not been accompanied by increased volume.
In the past week, Bitcoin made a strong recovery after breaking below $114,000, currently nearing $121,000. On-chain analysis firm Glassnode stated in its latest report that this movement reflects a market shift from 'bearish exhaustion' to a 'strong rebound near historical highs.'
However, the rebound has not been accompanied by a significant increase in the spot market.
Glassnode data shows that spot trading volume has decreased by 22% to $5.7 billion, nearing the statistical low range, indicating that this rally is more driven by position adjustments rather than large-scale firm buying. The Spot Cumulative Volume Delta (CVD) has shifted 94% towards buying pressure, showing that aggressive selling has been replaced by new buying, but the buying has not yet reached a broader trading group.
In the derivatives sector, leveraged traders have made a significant return. The cumulative trading volume difference of perpetual contracts surged by 88%, with funding rates remaining high, and the scale of options open interest growing by 6.7% to $42.4 billion. However, volatility pricing has dropped by nearly one-third, indicating a certain level of complacency, which historically tends to trigger significant market fluctuations.
Regarding ETF fund flows, the outflow scale of the U.S.-listed spot Bitcoin ETF has halved, dropping from $686 million the previous week to $311 million. However, ETF trading volume fell by 27.7% to $13.7 billion, still close to the low range.
QCP Capital pointed out that the strong rebound over the weekend (with BTC briefly breaking above $122,000) occurred against a backdrop of thin order books and a recovery in global market risk appetite.
This Singapore trading firm stated, 'During the thin liquidity weekend trading session, cryptocurrencies staged an impressive rebound,' noting that this trend coincided with a rebound in U.S. stocks and a warming market expectation for the Fed's rate cut in September.
On-chain activity has improved, with the number of active addresses increasing by 8.4% to 793,000, and total fees rising by 10%. However, Glassnode warns that the high profit levels could quickly turn into selling pressure when sentiment shifts. Currently, 94.1% of the supply is in profit, with the realized profit-loss ratio rising to 1.9, suggesting the market may be nearing a critical point for accelerated profit-taking.
Overall, tight liquidity, increased long positions in derivatives, and macro-driven optimism have made Bitcoin susceptible to sharp fluctuations as it approaches historical highs. The next key test may come from the U.S. CPI data to be released on Tuesday.
Bitcoin's future market is closely watching the CPI.
Bitfinex analysts stated in Monday's market report that the sustainability of Bitcoin's momentum largely depends on these U.S. macroeconomic data. 'The current market is highly sensitive to macro events, and traders should be prepared for heightened volatility and the possibility of a pullback to $110,000 in the short term.'
They added: 'We believe the oscillation of prices between the upper and lower points of the range will continue, as prices continuously cross the cost ranges of new buyers, causing emotional fluctuations when key macro data is released.'
Traders on the Polymarket platform tend to believe that CPI will rise slightly, in line with market consensus expectations, which may cause BTC to oscillate at high levels; if the data exceeds expectations, it could temporarily suppress Bitcoin's movement and delay the Fed's interest rate cuts; conversely, a result below expectations, if accompanied by ETF fund flows and improved spot activity, could become a breakout catalyst.
Bitcoin Technical Analysis
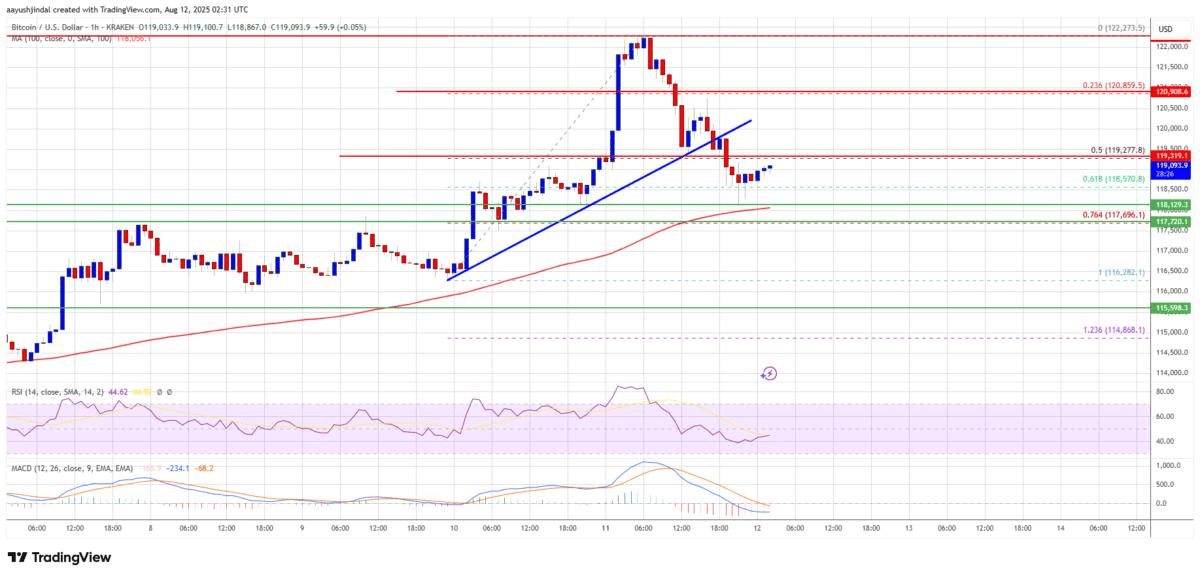
After finding support near $115,500, Bitcoin initiated a new round of upward movement, successfully breaking through resistance levels of $117,500 and $118,800. The price even surpassed the resistance zone of $120,500, entering a bullish range, and finally tested the resistance level of $122,250, peaking at $122,273. Subsequently, the price began to give back some gains, falling below the $120,500 level.
This pullback has broken below the 50% Fibonacci retracement level of this bullish wave from a low of $116,282 to a high of $122,273. Additionally, a key ascending trendline (support at $119,500) on the BTC/USD hourly chart has also been breached.
Currently, Bitcoin is still trading above $118,000 and the 100-hour moving average. The immediate resistance level above in the short term is at $119,250, with the first key resistance at $120,500. The next resistance level may be at $121,250. If it closes above this resistance level, the price is expected to rise further, testing the resistance level of $123,200. If it continues to break through, it may reach $124,000, with the main target looking towards $125,000.
If Bitcoin fails to break through the resistance zone of $120,500, it may decline again. The immediate support level is at $118,200, with the first major support level at $117,800. The next support level is in the $116,550 area, and if it breaks below this level, the price may retreat to the support at $115,500. The main support level is at $113,500, and if breached, BTC may continue its downward trend.
Technical Indicators
Hourly MACD: The MACD is weakening in the bullish range.
Hourly RSI (Relative Strength Index): The RSI for BTC/USD has fallen below 50.
Major support levels: $118,200, followed by $116,550.
Major resistance levels: $119,250, followed by $120,500.


