Stellar (XLM) is quietly making progress, recording a 10% increase over the past week and an additional 3% in just the last 24 hours. However, this upward momentum is still not enough to be called a breakout. Notably, this development occurs even after the token broke a bullish pattern on the daily chart earlier this month.
If the technical structure remains bullish, why has the price not been able to break out strongly? The answer lies in the fierce tug-of-war between buying and selling forces, taking place simultaneously across both on-chain data and price charts.
Supply pressure: Exchange balances reach record levels.
The first signal comes from the amount of XLM sitting on exchanges. In just one year, this figure has climbed to a record 1.03 billion XLM (approximately $469.7 million). Specifically, during the July – August period, the balance remained at 1.02 billion XLM, among the highest in history.
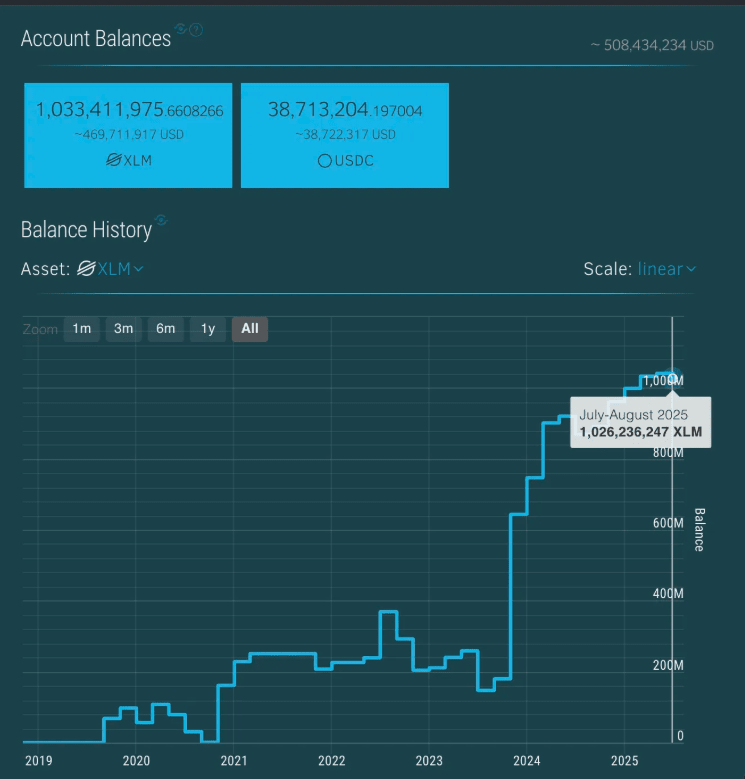
In fact, a large amount of tokens on the exchange means that the supply is ready for traders to sell at any time. This inadvertently creates a 'price ceiling': whenever the price rises, the market is likely to experience a wave of profit-taking. This supply pressure may be the reason why XLM, despite breaking the bullish pattern, has not been able to rally as strongly as many other altcoins.
Buying pressure counterattacks: The Money Flow Index is trending upwards.
In contrast to the overwhelming supply picture, buying pressure in the market has not completely disappeared. On the daily chart, the Money Flow Index (MFI) – a measure of money flow that combines both price volatility and volume – is maintaining above the 50 threshold, at 51.32. Notably, the MFI has just bounced back after avoiding a retest of the July low around 29.
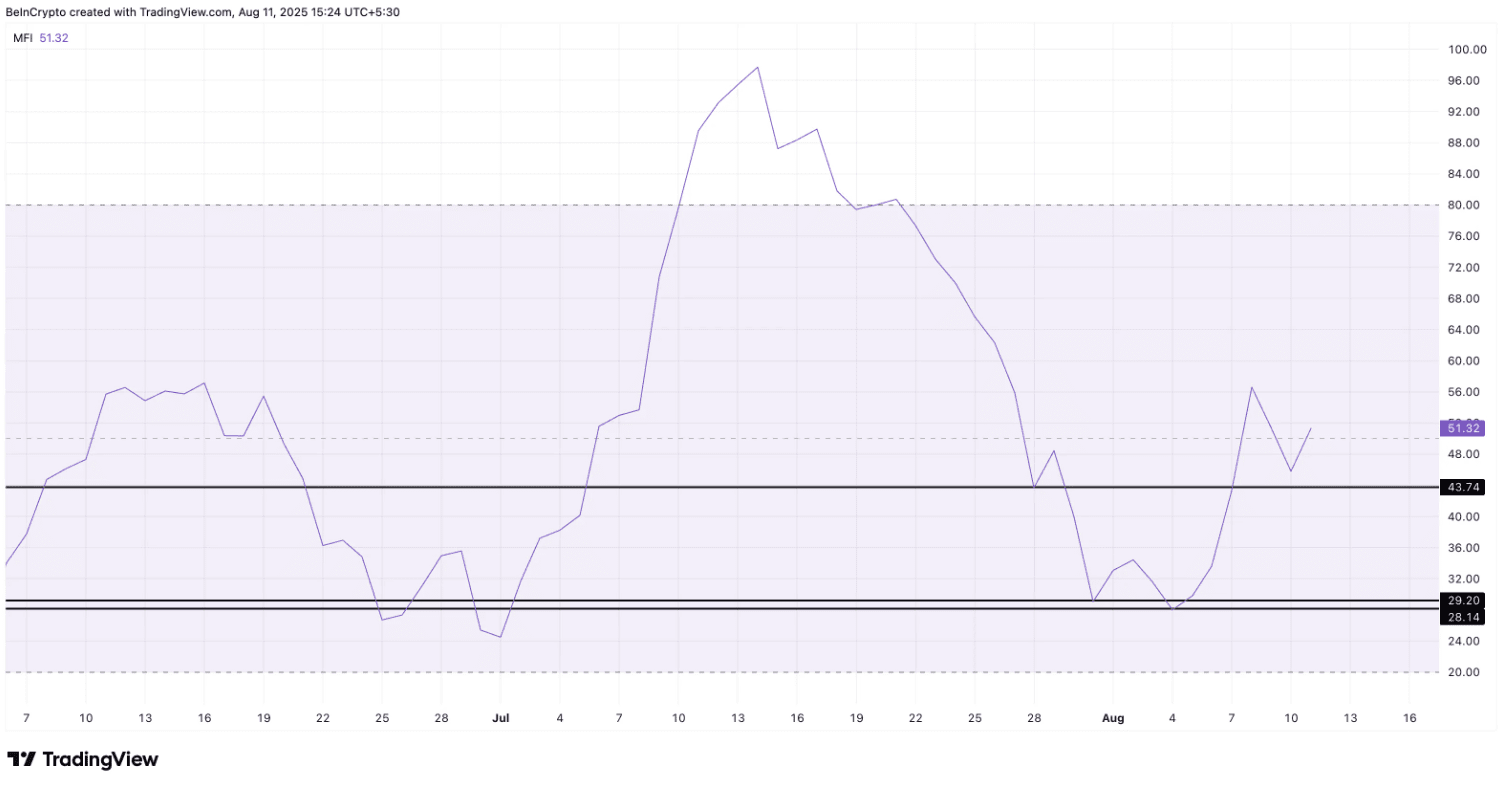
This indicates that, although selling pressure is still 'lurking', a significant flow of capital continues to flow into XLM. Buyers are strong enough to keep the price from plummeting but not strong enough to overwhelm the massive supply. This tug-of-war is putting the market in a 'compressed' state, waiting for a breakout moment.
Zoom in: The XLM price chart on the 4-hour timeframe shows a bullish structure but weakening momentum.
To determine whether the tug-of-war between bulls and bears is nearing its end, it is essential to closely monitor the 4-hour chart. In this timeframe, XLM is moving within an ascending triangle pattern – a setup that often signals a continuation of the bullish trend, with a critical support area at $0.44, while resistance levels are at $0.46 and $0.47.
However, market momentum is showing signs of weakening. The RSI index on the 4-hour timeframe has made lower highs even as the price reached higher highs, indicating that buying pressure is temporarily losing steam. Combined with the large amount of XLM still on exchanges, this explains why Stellar continues to be 'trapped' in a narrow range, despite the technical structure still leaning towards a bullish trend.
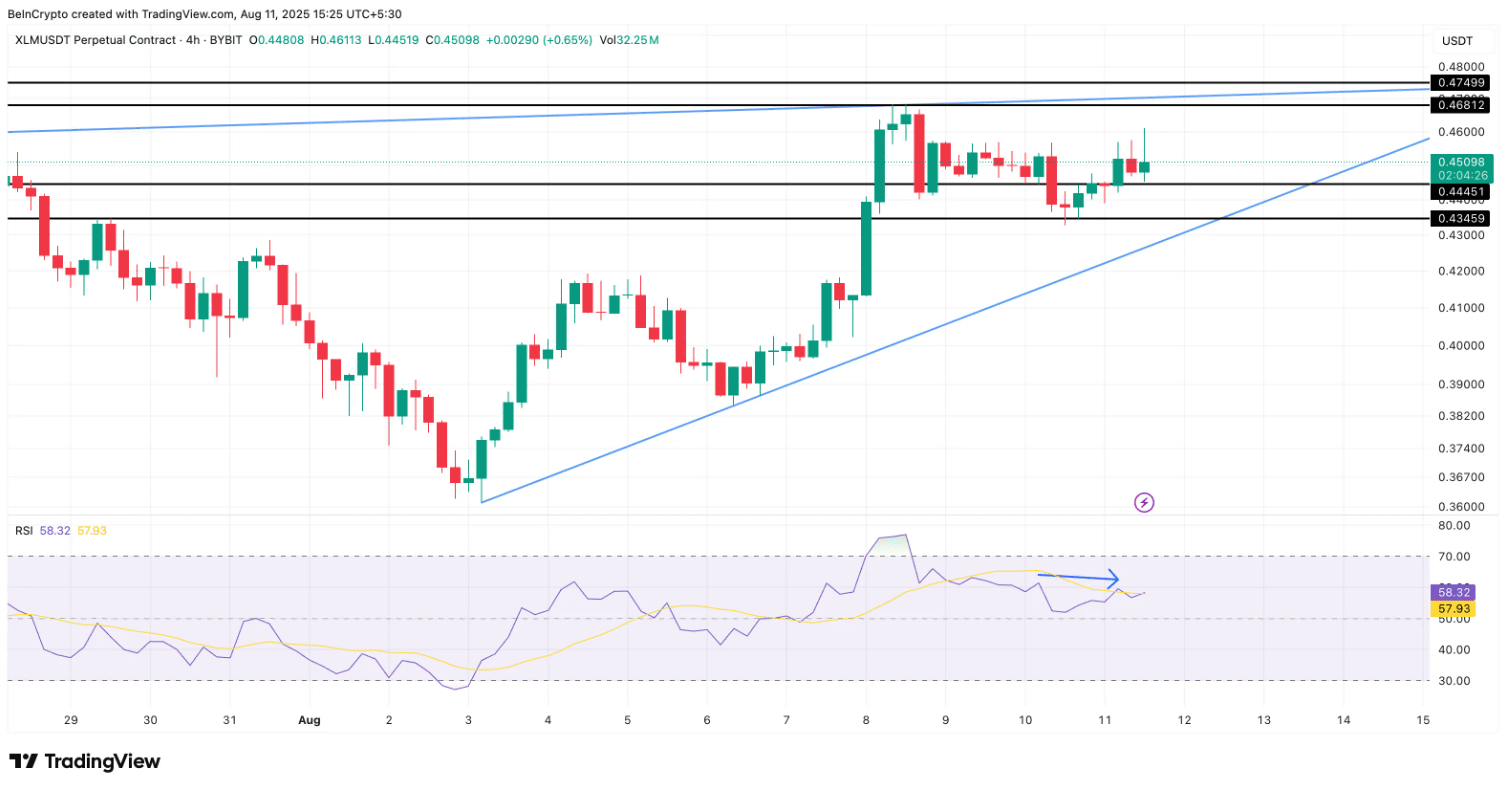
If the price breaks out and closes above $0.47, XLM could reach new highs while completing the breakout pattern. Notably, this price range coincides with an area with many short orders at risk of being liquidated. Clearing these short positions could trigger a 'cascading rally' – a powerful chain reaction.
Conversely, if the price corrects and breaks below $0.43, the bullish structure will be severely threatened. At that point, even buy positions set around $0.43 and lower are at risk of being liquidated.