The cannon fire is continuous at 4230: Is Ethereum breaking out of its cocoon today or sinking like a sandbag?
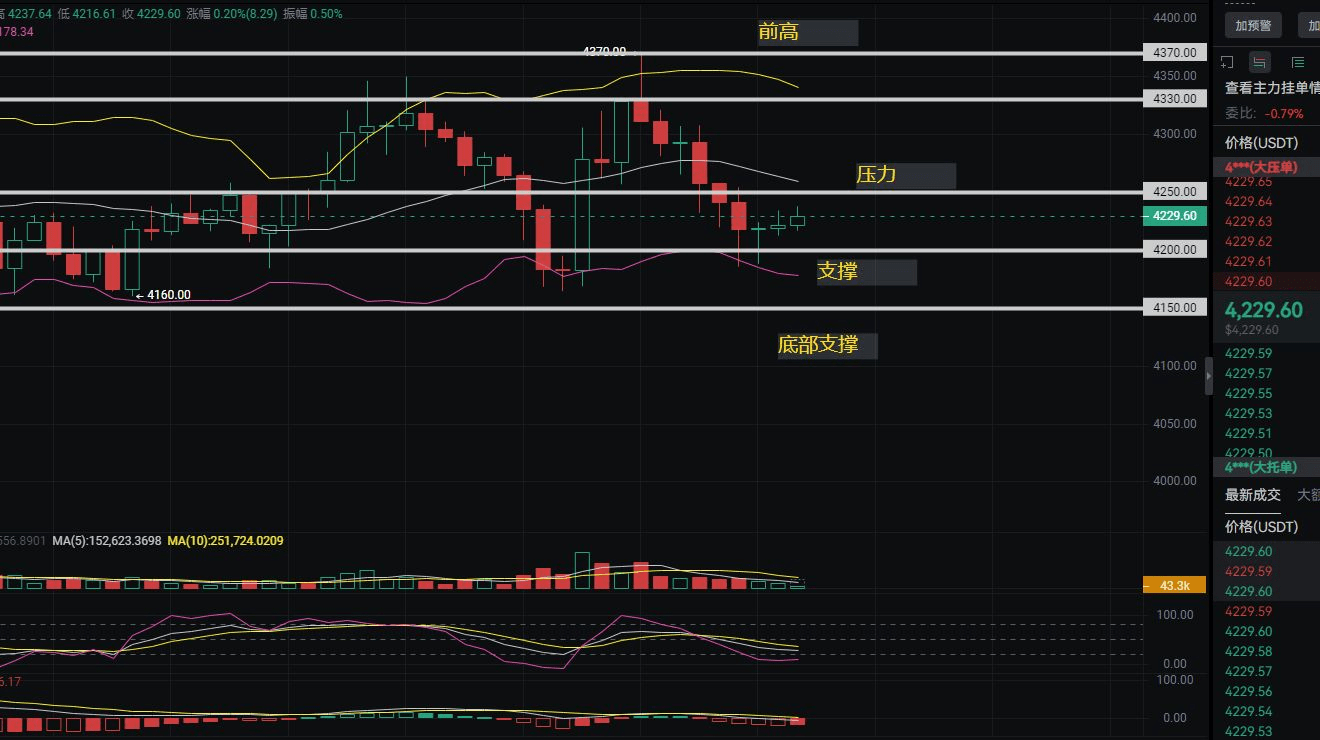
Dear friends, I am Old Bull! Today's ETH chart seems to be welded at a crossroads - the bulls and bears are at odds at the 4230 level, just waiting for the gunshot that breaks the deadlock! The latest price is tightly held at 4229.6, only a hair's breadth away from the resistance level marked by the white line (4230-4240 range)! This hourly candlestick closed in a suffocating manner: it peaked at 4237.64 and dipped to 4216.61, with the amplitude stuck in a choking range of 0.50%, resembling a spring compressed to the extreme. What's more critical is the volume - the right-side data clearly shows MA5 volume at 153k compared to MA10 volume at 252k, indicating a significant cooling in trading activity. What does this mean? Large funds are holding their breath and watching, while retail investors are spinning in place in the fog!
Old Bull highlights key points:
Pressure zone accurately locked: The area marked by the white line, 4230-4240, is the real battlefield, where a large number of trapped positions are accumulated. Whether we can break through this range with volume today will directly determine if ETH flies towards the previous high of 4370-4400 or turns back to test the support at 4150 marked by the purple line.
Volume reveals secrets: The current low-volume fluctuations are by no means calm, but rather a low pressure before the storm! A real trend change must be accompanied by a sudden increase in trading volume (compared to MA10, it needs to exceed 252k level); false breakouts without volume are all paper tigers.
Reconfirming the life-and-death line: The purple support at 4150 below must not be lost, as this is the last trench for the bulls in the short term. If it breaks down with volume, it will trigger a panic selling chain reaction.
The current market resembles a truce between two armies! ETH's price is compressed in a very small range of 4216-4237, appearing calm on the surface but actually hiding turbulent undercurrents. Focus on two key variables: volume and the quality of breaking through 4230! If there is a sustained increase in volume for two consecutive hours above 4240 (emphasizing that it must be a valid breakthrough), it will confirm the opening of upward space; conversely, if the rebound is weak, and the price is suppressed below 4230 with volume breaking down below 4200, the short-term trend will declare a bearish reversal.
At this moment, ETH is embodying the most real saying of 'long stagnation must change'! Will it break out or fall back? The next three hourly candlesticks will reveal the answer. Please pay close attention to two points: Can 4240 break through with volume? Will there be a panic sell-off at 4150? Remember, real trends never arise from fluctuations but from a thunderous strike at the critical point! Want to see how the main forces turn the table? Stay tuned for future dynamics, and we will see the outcome on the battlefield!