#Bitlayer #BTCOvertakesAmazon #BTCHashratePeak
Bitcoin faces selling pressure near $123,218, but it remains on track to achieve a new all-time high as long as it stays above $117,000.
Price analysis
Key points:
Bitcoin faces significant selling pressure near its all-time high, but bulls are keeping the price above $120,000, indicating strength.
Ethereum remains strong above its breakout level of $4,094, opening the door for further gains.
Bitcoin
Bitcoin
$119,349
Bitcoin's price rose above $122,000 on Monday, but the long wick on the candle shows that bears are strongly defending the historical high at $123,218. However, if buyers do not concede too much against the bears, Bitcoin will remain on track to achieve a new all-time high.
Institutional investors also expressed optimism on Wednesday, with Bitcoin exchange-traded funds seeing net inflows of $91.55 million. Inflows accelerated on Thursday and Friday, recording $280.69 million and $403.88 million respectively, according to SoSoValue data.
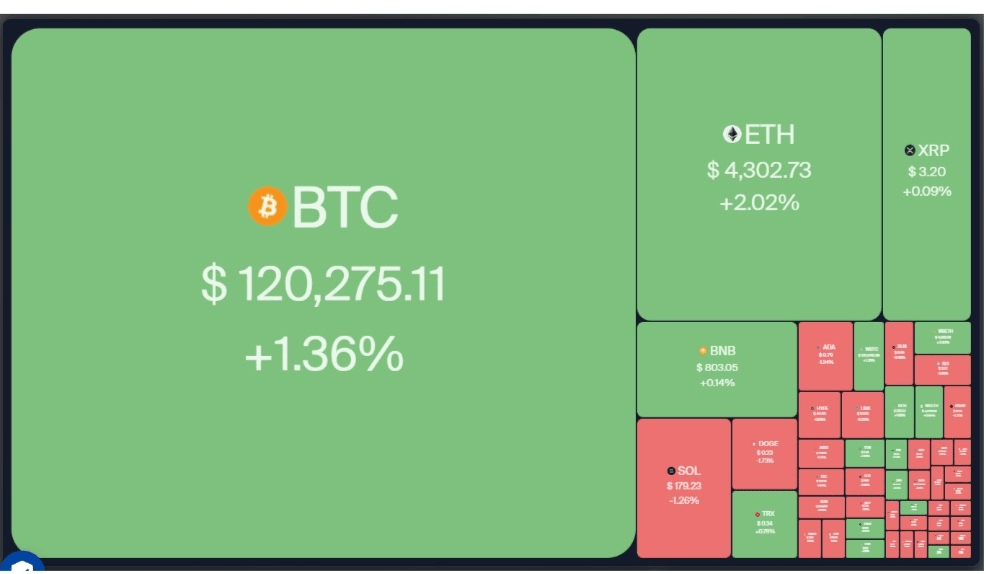
Daily market data for cryptocurrencies. Source: Coin360
Bitcoin's bullish sentiment has influenced the entire cryptocurrency sector, with the prices of many altcoins rising, led by Ethereum.
Ethereum
$4,282
.
According to a post on X, BitMEX co-founder Arthur Hayes, who sold 2,373 ETH just days ago when the price was approaching $3,507, repurchased all of it at a much higher price of around $4,150.
Can Bitcoin reach its all-time high? Will altcoins follow Bitcoin's price upward? Let's analyze the charts of the top 10 cryptocurrencies to find out.
S&P 500 index price prediction
The S&P 500 (SPX) index fell below the 20-day simple moving average (6,331) on August 1, but the bulls quickly reclaimed the level on August 4.
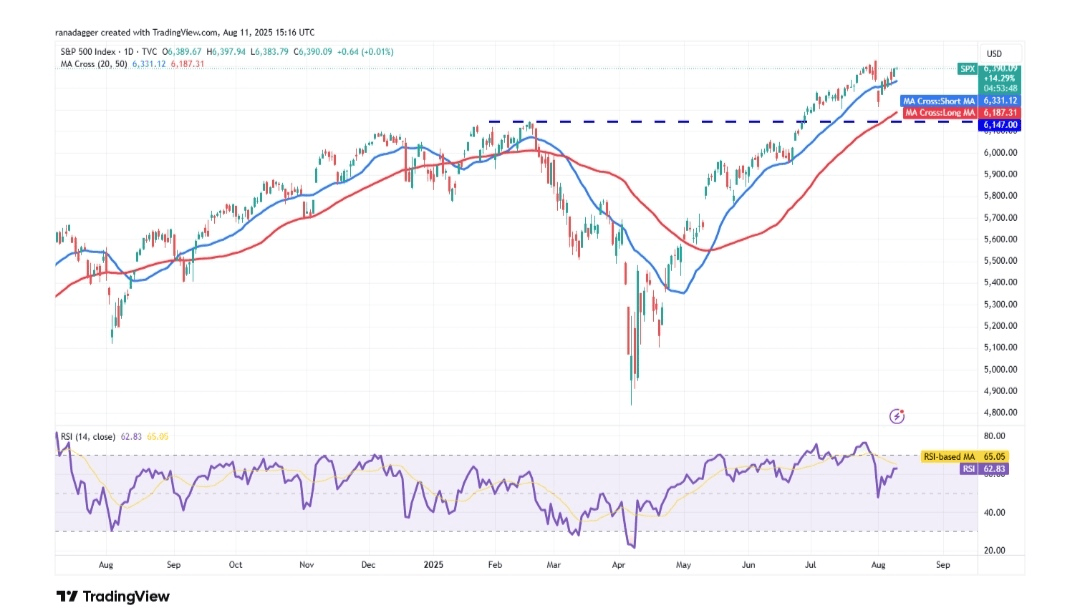
Daily chart of the SPX index. Source: Cointelegraph/TradingView
Bulls will try to resume the uptrend by pushing the price above 6,427. If successful, the index could rise to 6,500 and then to 6,696.
The first signs of weakness would be a break of the 20-day simple moving average and a close below it. This indicates profit-taking at higher levels. The index may then drop to the breakout level of 6,147. Buyers are expected to defend the level of 6,147 with all their strength, as breaking below it indicates a potential top in the short term.
US Dollar Index price forecasts
The US Dollar Index (DXY) is trying to find support near the moving averages, but the long wick on Monday's candle shows that bears are selling at the highs.
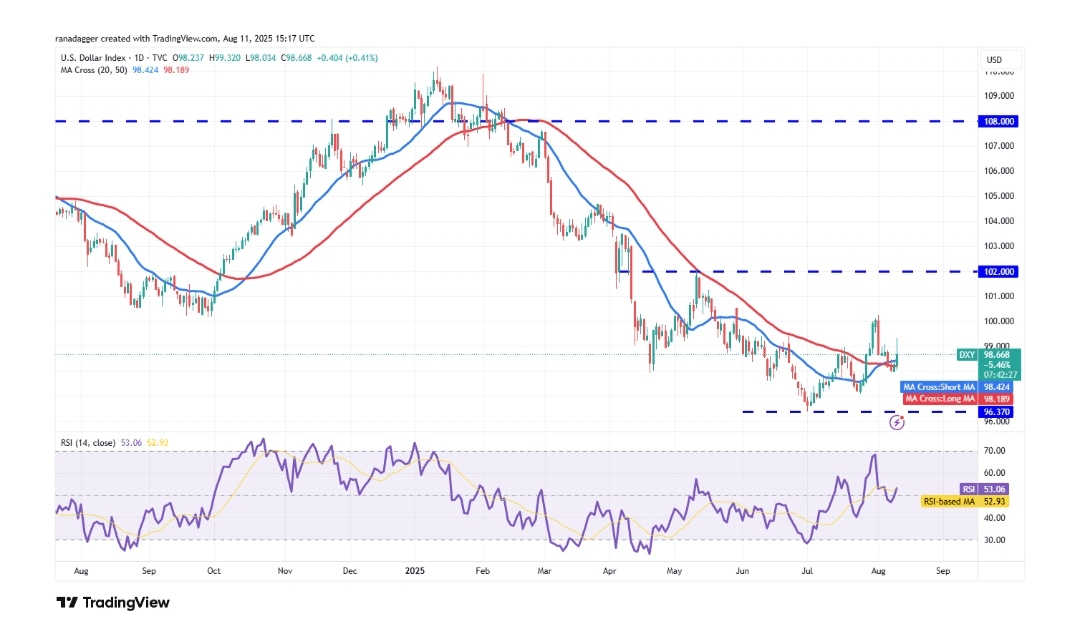
Daily chart of the US Dollar Index (DXY). Source: Cointelegraph/TradingView
If the price drops below 97.94, bears will try to push the index down to 97.10. Buyers are expected to fiercely defend the area between 96.37 and 97.10, as breaking it opens the door to a drop to 95.
On the positive side, buyers will need to push the price above $99.32 to signal a loss of grip by the bears. The index may then rise to $100.54 and then to $102. Sellers are likely to pose a strong challenge at $102.
Bitcoin price prediction
Bitcoin's price (BTC) broke the downward trend line on Sunday, and bulls continued the momentum on Monday, reaching $122,335.
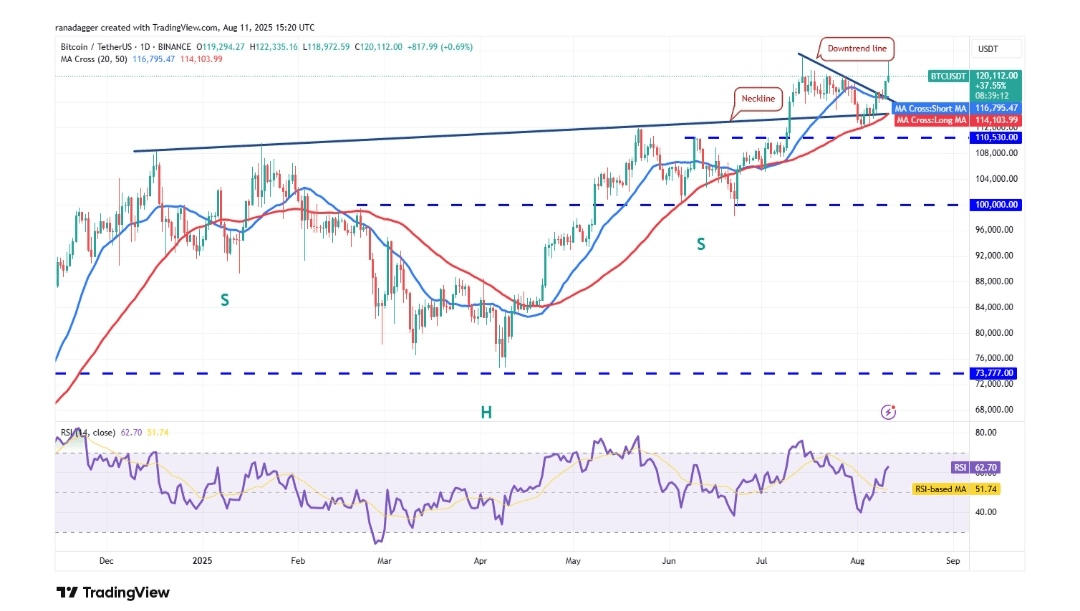
Daily chart of the BTC/USDT pair. Source: Cointelegraph/TradingView
Bears are trying to maintain the historical high at $123,218, but the positive indicators show that bears continue to pressure. This enhances the chances of breaking $123,218. If that happens, the BTC/USDT pair could rapidly rise toward $135,000.
Related: Will Bitcoin price fill the $117,000 gap at the Chicago Mercantile Exchange? 5 things to know about Bitcoin this week
The first signs of weakness would be a break and close below the 20-day simple moving average ($116,795). This indicates a potential formation of a trading range in the near term. Bitcoin's price may fluctuate between $111,920 and $123,218 for a while. The pair would indicate a reversal in its short-term direction below $110,530.
Ether price prediction
ETH gained momentum after breaking the $3,745 level on Thursday, and bulls surpassed the $4,094 barrier on Saturday.
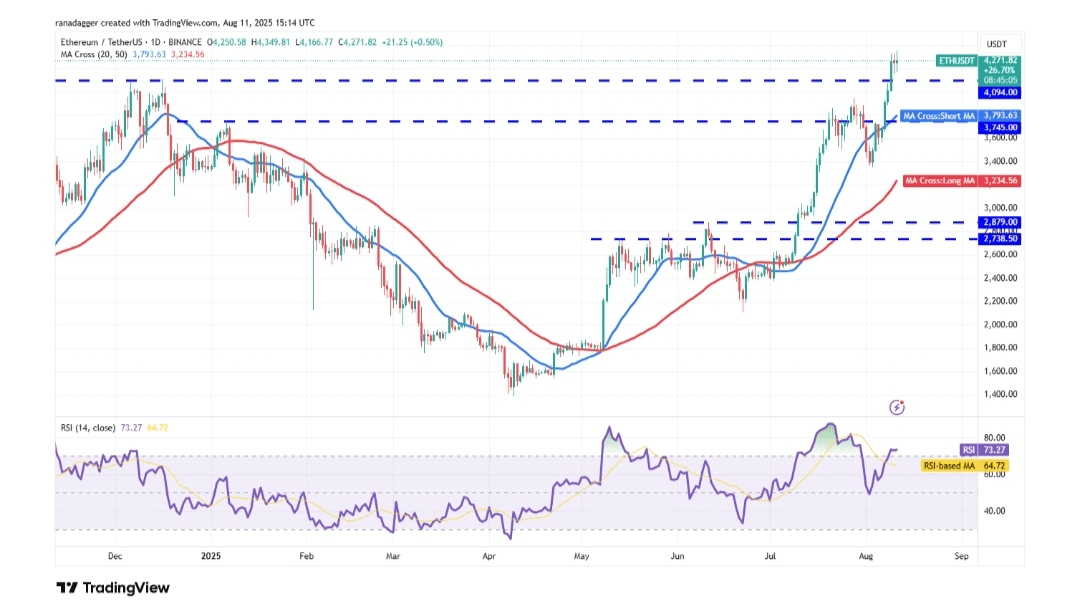
Daily chart of the ETH/USDT pair. Source: Cointelegraph/TradingView
Bears are unlikely to give up easily and will try to pull the price below $4,094. If they succeed, the ETH/USDT pair may drop to the 20-day simple moving average ($3,793). A strong bounce from the 20-day simple moving average indicates a positive trend, increasing the likelihood of continuing upward toward $4,868.
Sellers will need to push the price of Ethereum below the 20-day simple moving average to gain an advantage. A drop below $3,350 would indicate a short-term trend reversal.
XRP price prediction
XRP
XRP
$3.18
The stock price rose from $2.90 on Wednesday and climbed above its 20-day simple moving average ($3.10) on Thursday.
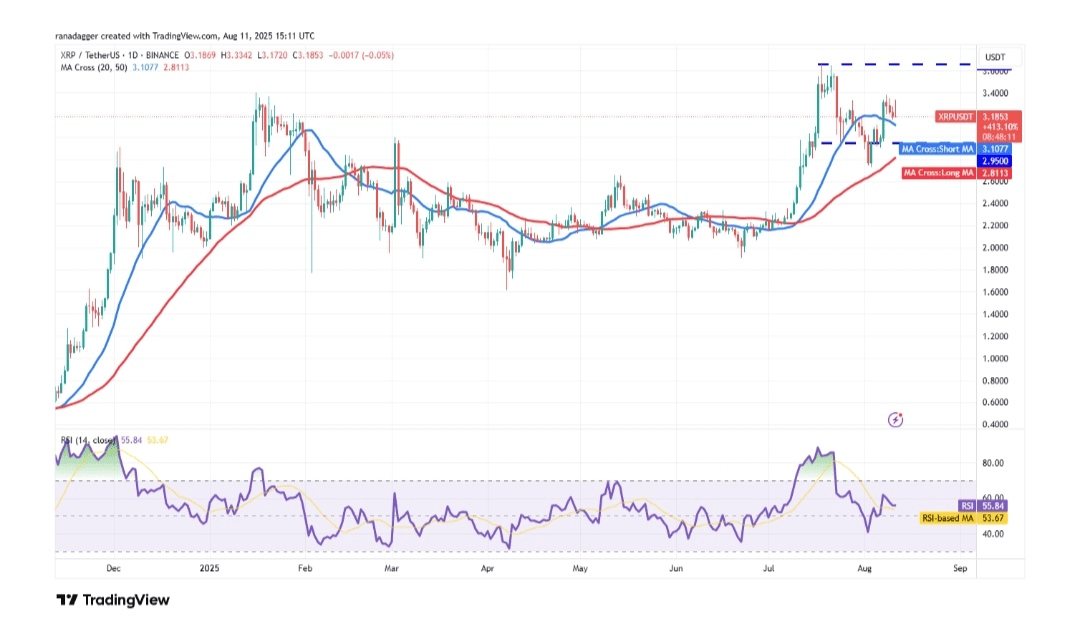
Daily chart of the XRP/USDT pair. Source: Cointelegraph/TradingView
Bears halted the upward move at $3.38 on Friday, but the positive sign is that bulls did not allow the price to drop again below the 20-day simple moving average.
If the price rises above $3.38, the XRP/USDT pair may head towards $3.66. Sellers are expected to fiercely defend the $3.66 level, but if all goes well, the rally may extend to $4, then to $4.50.
Conversely, if the price continues to decline and breaks below the 20-day simple moving average, it indicates ongoing bearish activity at higher levels. XRP's price may then drop to the 50-day simple moving average ($2.81).
BNB price prediction
BNB
BNB
$804.45
Gold has remained above $794 over the past two days, but bulls struggle to maintain the price above $815.
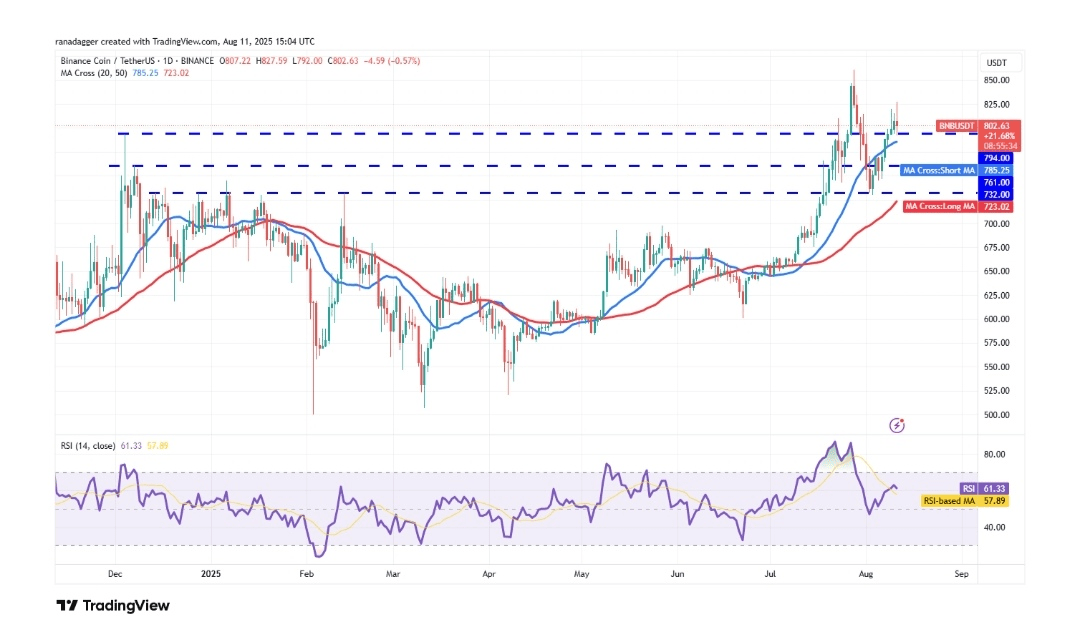
Daily chart of the BNB/USDT pair. Source: Cointelegraph/TradingView
Rising moving averages and the relative strength index (RSI) in the positive zone indicate bullish dominance. If the price rebounds from $794 and exceeds $828, the BNB/USDT pair may rise to $861.
Alternatively, if the price drops and breaks below the 20-day simple moving average ($785), it indicates profit-taking at higher levels. BNB's price may then drop to strong support at $732, where buyers are expected to intervene.
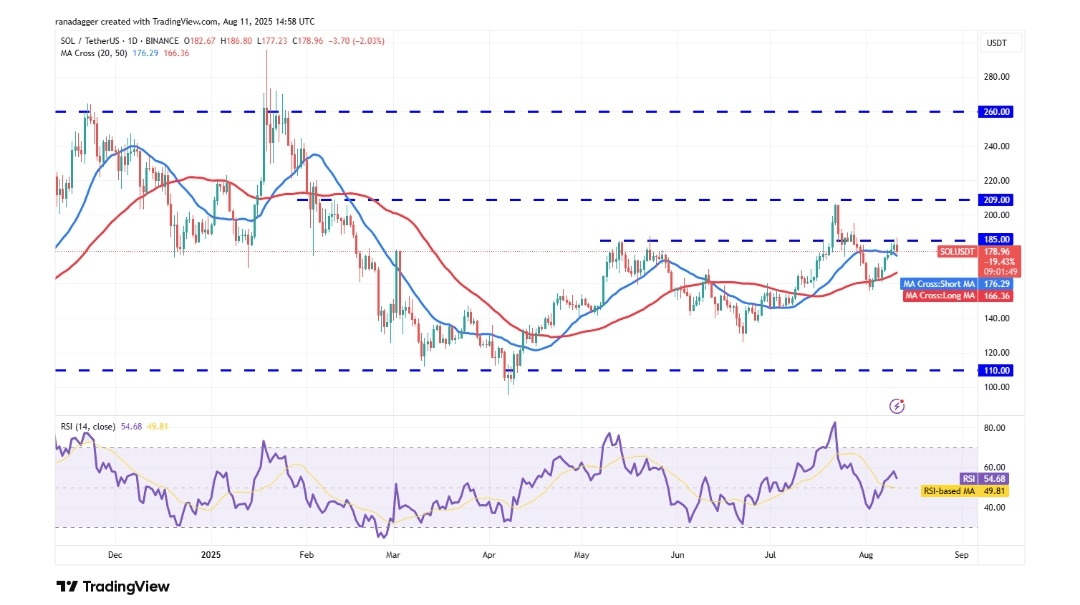
Solana price prediction
Solana
Solana
$177.62
The stock broke the 20-day simple moving average ($176) on Saturday and reached the upper resistance level at $185.
Daily chart of the SOL/USDT pair. Source: Cointelegraph/TradingView
Bulls will try to push the price above $185 and gain the upper hand. In this case, the SOL/USDT pair could rise to $195, then to $209. Sellers are expected to build strong defenses at $209.
Conversely, a drop below the 20-day simple moving average indicates that bears are fiercely defending the $185 level. Solana's price may then drop to the 50-day simple moving average ($166), and then to strong support at $155.
Dogecoin price prediction
Dogecoin
Dog
$0.2291
Gold price rose above the 20-day simple moving average ($0.22) on Friday, but bulls are struggling to push the price to $0.26.
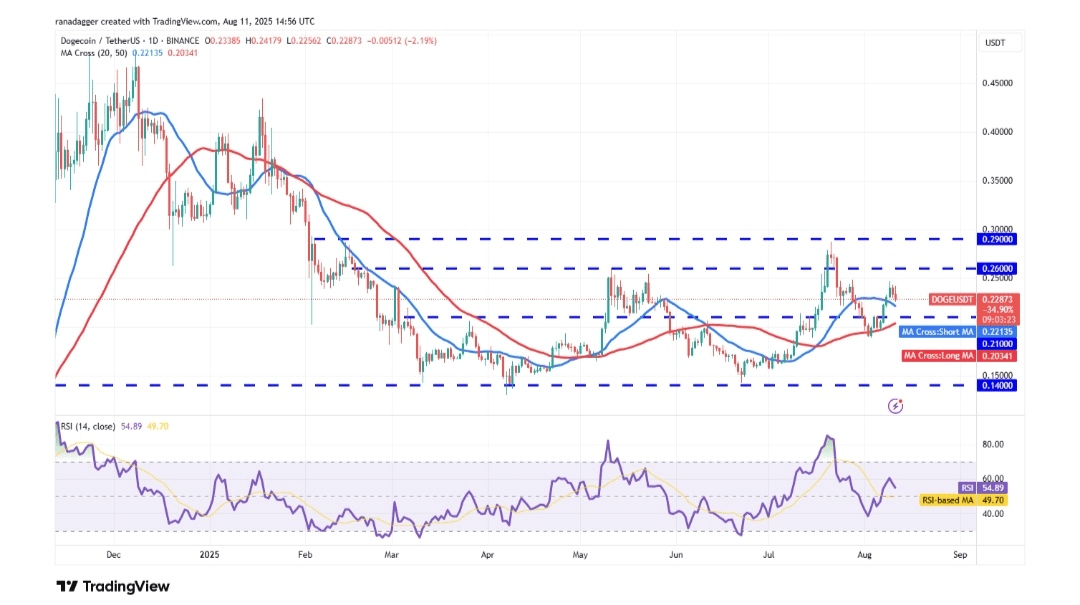
Daily chart of the DOGE/USDT pair. Source: Cointelegraph/TradingView
If the price drops and falls below the 20-day simple moving average, the DOGE/USDT pair may decline to the 50-day simple moving average ($0.20). This indicates a consolidation between $0.25 and $0.19 for a while.
If the price bounces from the 20-day simple moving average and exceeds $0.25, the DOGE index may rise to $0.29. On the downside, a drop below $0.19 may cause the pair to decline to $0.16, then eventually to $0.14.
Cardano price prediction
Cardano
American Dental Association (ADA)
$0.788
The stock price rose above the 20-day simple moving average ($0.77) on Friday, indicating a return of buyers.
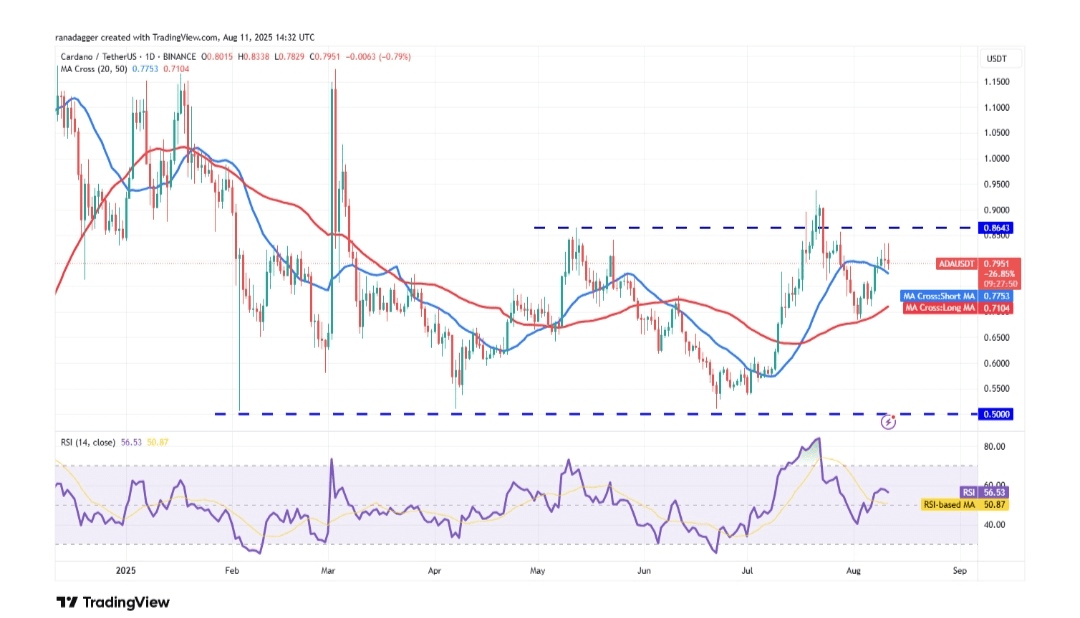
Daily chart of the ADA/USDT pair. Source: Cointelegraph/TradingView
Sellers attempted to pull the price below the 20-day simple moving average on Sunday, but the bulls maintained their positions. The rebound from the 20-day simple moving average on Monday faced selling pressure at higher levels.
Breaking the 20-day simple moving average and closing below it weakens the bullish momentum. Cardano's price may then drop to the 50-day simple moving average ($0.71).
Buyers will regain leadership if the ADA/USDT pair exceeds $0.86. This opens the door for a rise to $0.94.
Superliquid price prediction
Hyperliquid (HYPE) stock has risen in the past few days, indicating aggressive buying at lower levels.
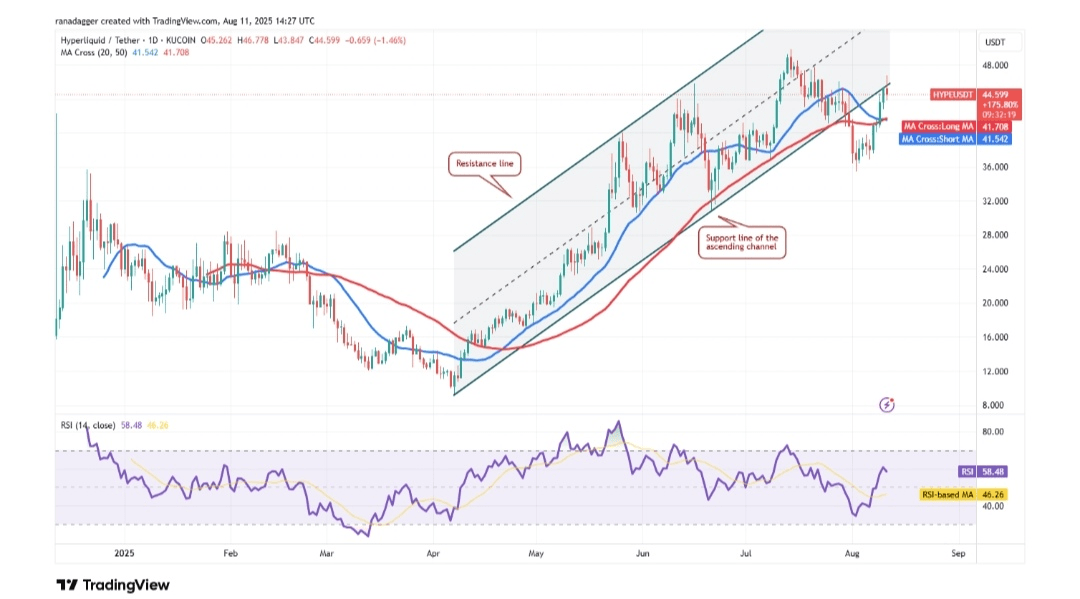
Daily chart of the HYPE/USDT pair. Source: Cointelegraph/TradingView
The HYPE/USDT pair is witnessing a fierce battle between bulls and bears at the support line of the ascending channel pattern. If the price drops from the support line, it may decline to the moving averages. A bounce off the moving averages increases the likelihood of a rise to $50, and then to $62.50.
On the other hand, breaking the moving averages and closing below them indicates that bears are trying to take control. The pair may then pull back to $35.50.


