
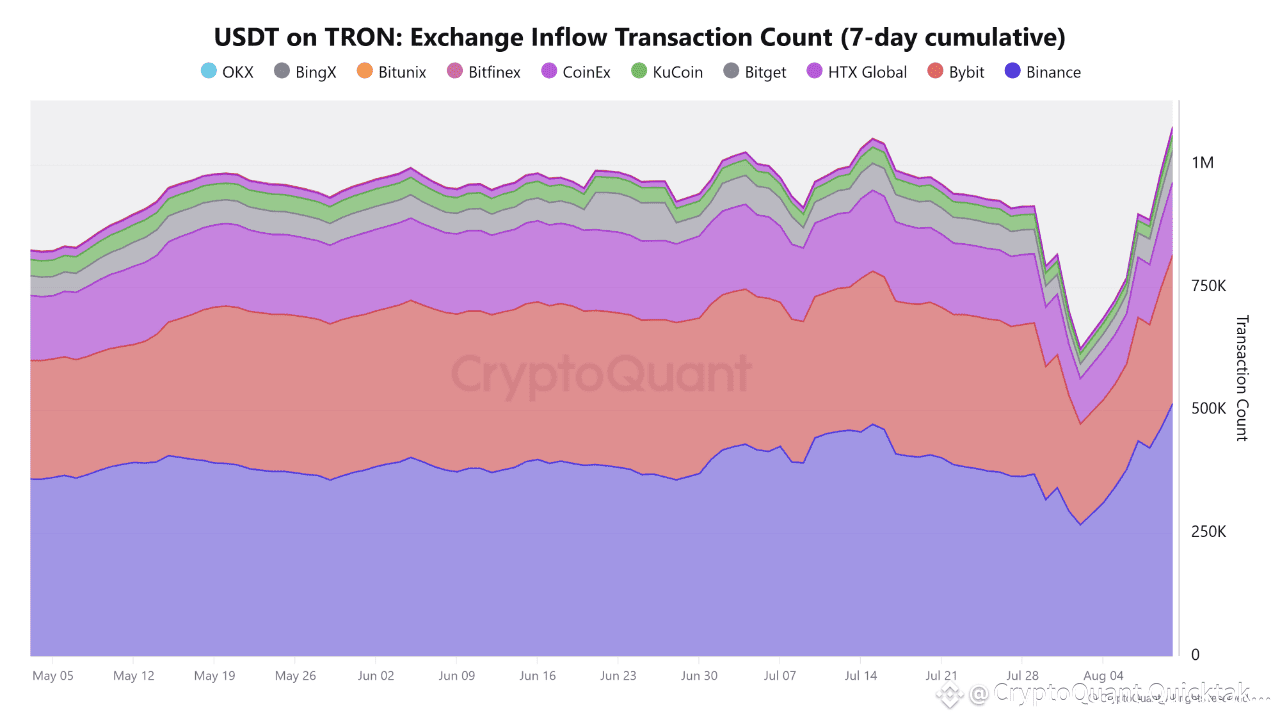
Data indicates that since mid-July, there has been a significant change in the total number of deposits. In late July, the index saw a sharp and rapid decline (V-shape), followed by a very strong rebound in early August, reaching the highest level in the period (exceeding ~1M transactions in 7 days).
The recent sharp increase came primarily from Binance, with significant contributions from Bybit and HTX. This means the activity is not confined to a single platform but is rather broad, though still concentrated among the largest exchanges.
Because we are dealing with stablecoin inflows (USDT deposits to exchanges), the common rule is:
High stablecoin deposits = strong "buying capacity" ready to enter long positions in the currency (especially during declines). However, since the indicator measures the number of transactions, not their value, high volumes may indicate more retail activity (many small deposits) rather than whale activity.
Momentum within the Index Because the index is cumulative over seven days, the upward slope of the line in recent days indicates an acceleration in the pace of deposits day after day, not just a temporary one-day increase. This reflects very high deposit activity on TRC20 towards exchanges, led by Binance, with strong contributions from Bybit.
The current composition suggests a continued concentration of deposits in major exchanges, with no structural changes in the weighting of smaller exchanges within the index.
The index is currently experiencing peak activity and velocity in the number of USDT-TRC20 deposit transactions to exchanges, with Binance dominating, Bybit contributing significantly, and the remaining exchanges expanding their participation without a significant change in the share structure.
Written by Arab Chain
