

📊 LTC/USDT — Professional analysis
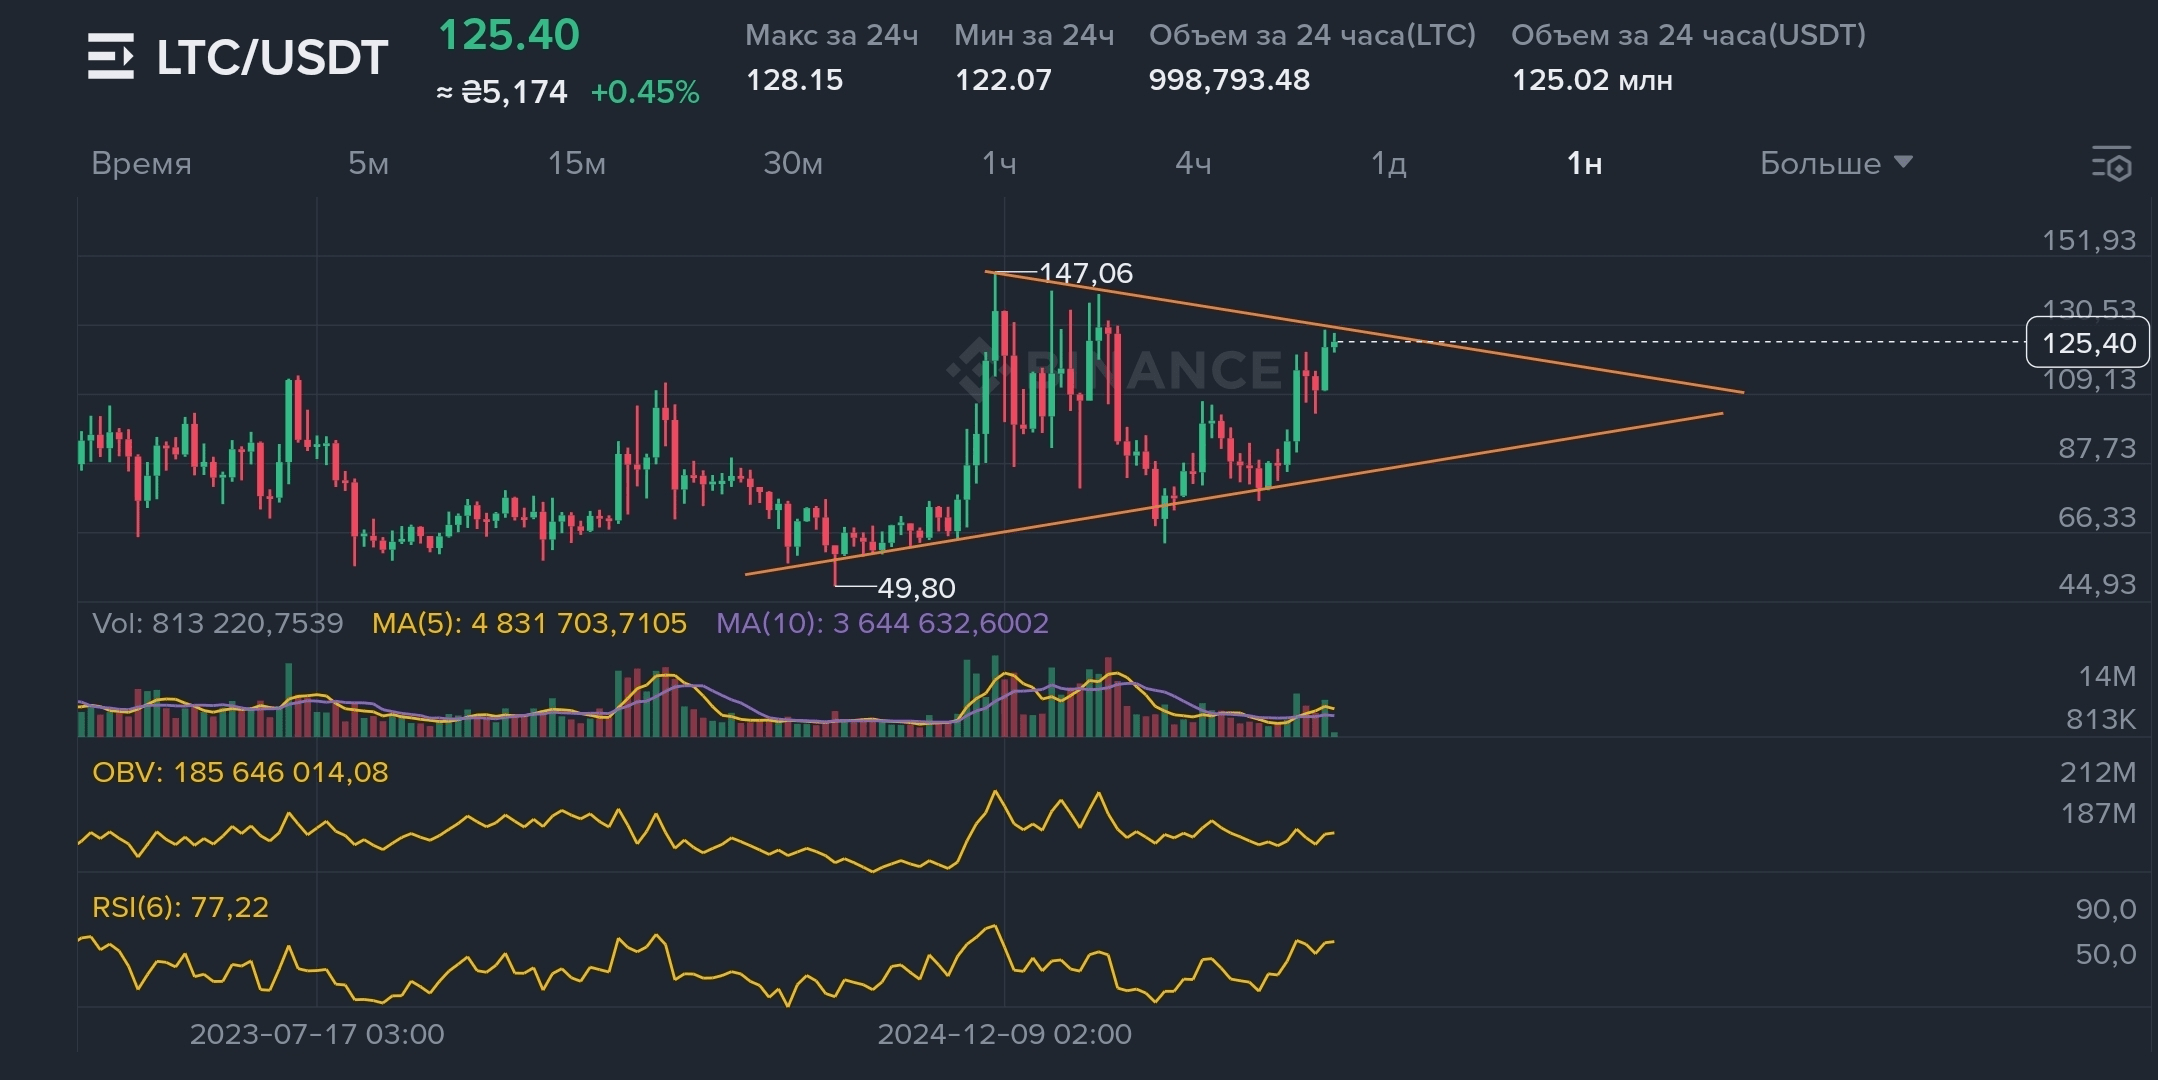
Current price: $125.40 (+0.45%)
24-hour range: $122.07 – $128.15
Volume: 125.02M USDT
🔍 Technical picture
A symmetrical triangle is forming on the 1H chart — this is a consolidation phase after a strong rise from $49.80 to $147.06. The price has approached the upper boundary of the figure (~$126–$128).
Key levels:
Resistances: $128.15 ➡ $130.53 ➡ $147.06 (historical high for the figure)
Supports: $122.07 ➡ $109.13 ➡ $87.73
Global support: $49.80
📈 Indicators
RSI(6): 77.22 — overbought zone ⚠️, a retracement is possible before a breakout.
MA(5) & MA(10): short-term bullish signal — MA(5) above MA(10).
OBV: volume is increasing, confirming buyer interest 💪.
✅ Pros
Increase in volumes and positive OBV dynamics 📊
The price is testing the upper boundary of the triangle — chance for a breakout and acceleration of growth 🚀
MA(5) is above MA(10), indicating a short-term uptrend
⚠ Risks
High RSI — a correction to $122–$120 is possible before a breakout
Failure to break $128–$130 may return the price to $109–$110
Loss of the $109 level will strengthen the bearish scenario with a target of $88
📌 Prospects
With a confident breakout at $128–$130 and consolidation above — the path opens to $147 and potentially $152–$155.
If the price retraces and consolidates below $122, a return to $110–$109 is possible.
💡 Conclusion: LTC is on the verge of an important technical decision. For aggressive traders, entry is possible on a breakout at $128 with targets of $147+, for conservative traders — wait for confirmation of consolidation.
