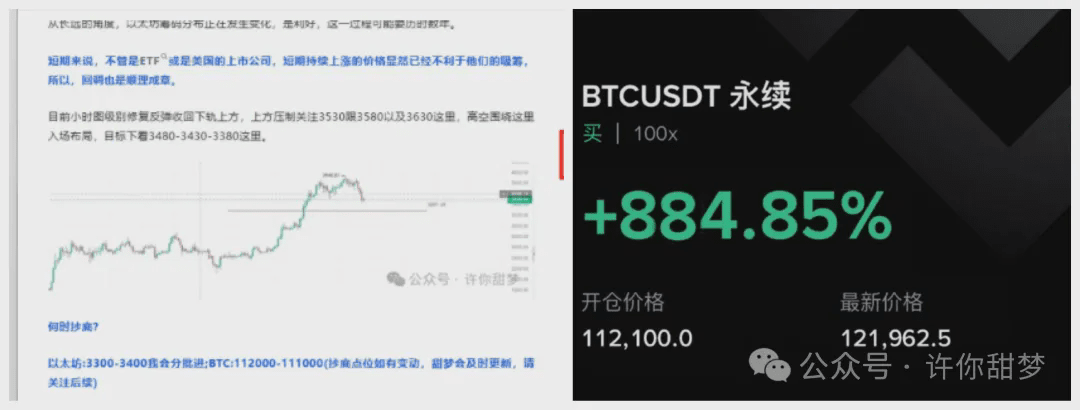
Bitcoin surged by 120,000, and overnight it jumped by 6,000 points! Ethereum surged by 4,300, just one step away from the historical high! Sweet Dream bought Bitcoin at 1,121,000 and Ethereum at 3,386 at the end of July's crash, and has been holding on. Those fans who followed Sweet Dream's strategy to buy the dip have made a killing, with Bitcoin longs yielding 884% and Ethereum longs also being held.
 Bitcoin
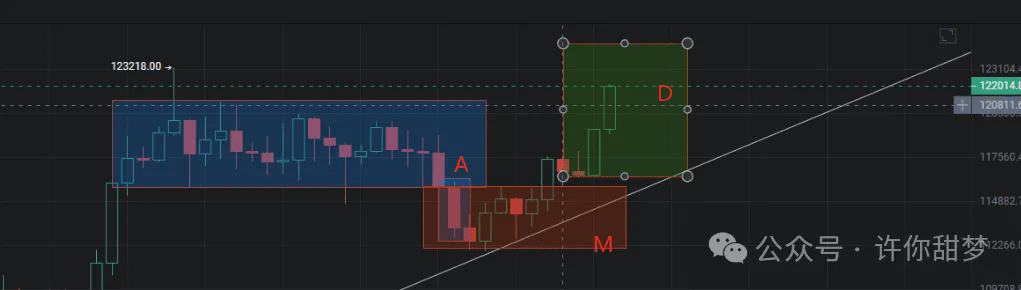
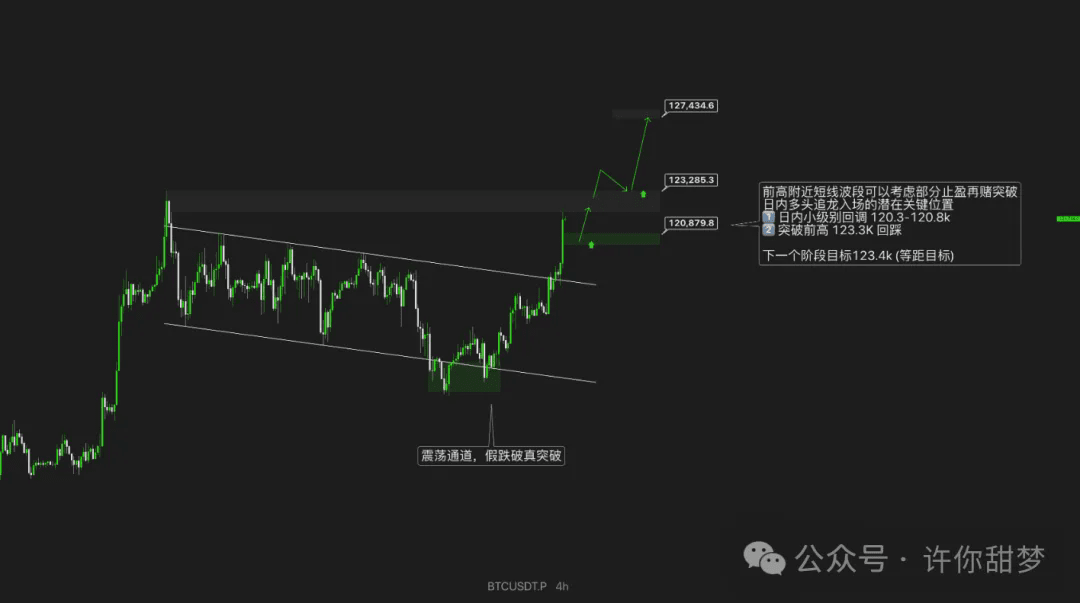
Currently, Bitcoin is in a volatile channel, faking a breakout before a real breakout. On the weekly chart, Bitcoin closed above $118,000, almost engulfing the previous week's bearish candle, showing strong momentum. A breakout above $123,000 will be a key signal. The daily chart shows a typical AMD distribution pattern; previously breaking below $116,000 was for institutions to pressure and accumulate, and then it rebounded to confirm support. The market has now entered the distribution phase, not a good opportunity to chase long positions.
Near the previous high of Bitcoin, short-term swings can consider partial profit-taking before betting on a breakout. The potential key position for intraday bulls to enter.
Intraday small-level pullback 120.3-120.8K.
Break above the previous high of 123.3K, pull back, and the next target is 123.4K (equidistant target).
Long position: Fans who followed Sweet Dream from the bottom of 112,100 have been holding on. For those without a long position, the BTC CME gap at 118,405 to 119,110 has a high probability of being filled. It’s worth paying attention to and entering a bit.
Short position: If you want to short BTC, this month's short entry points have moved to: 125,000 (short) and 129,600 (high short).
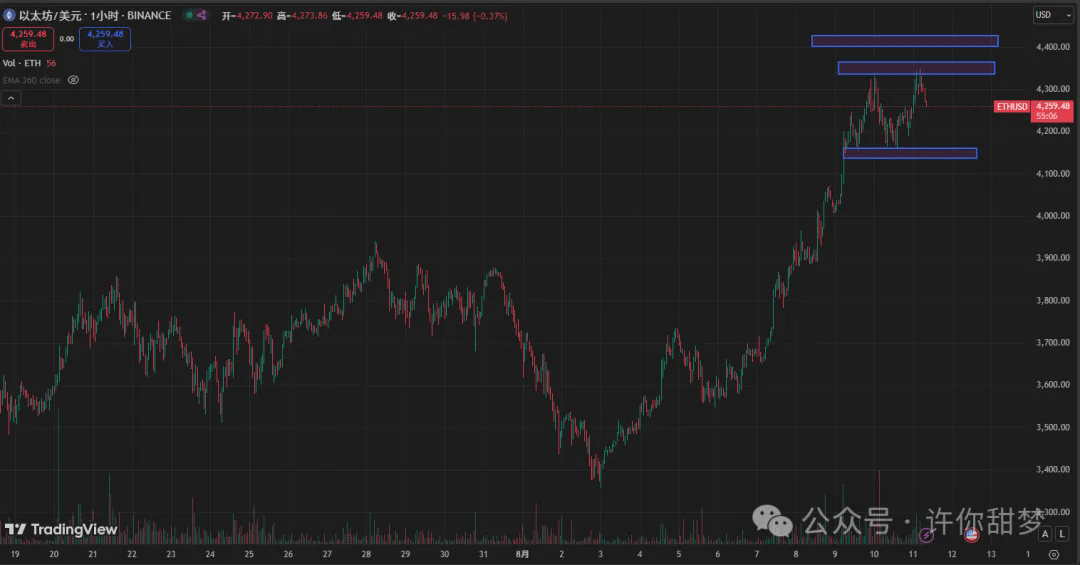
ETH
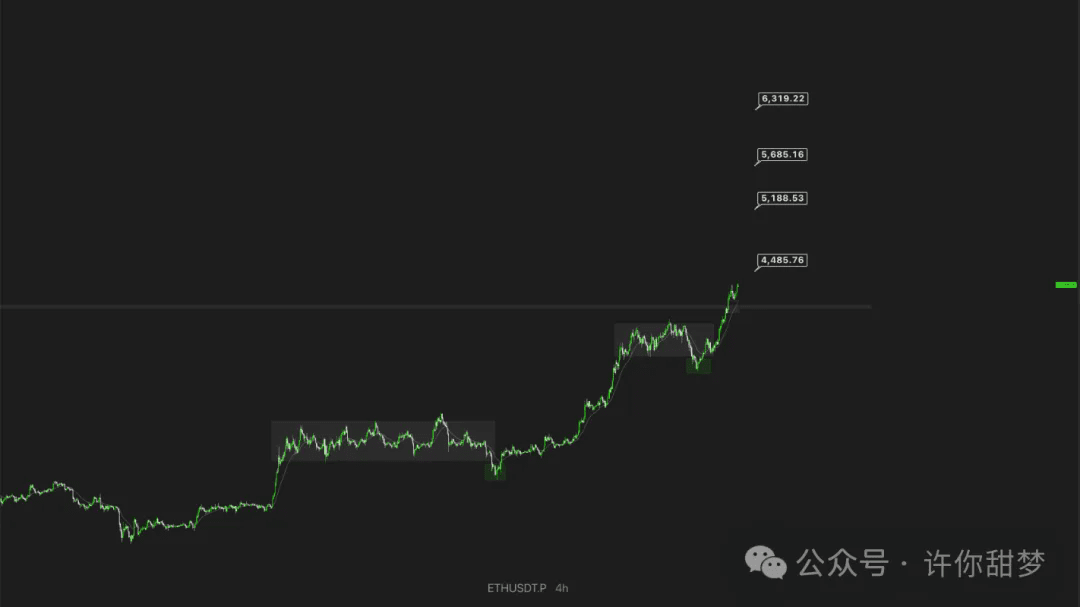
ETH: Every time it consolidates and fakes a breakout, it starts to rise. No further analysis needed, it's just going up. I measured some key numbers using Fibonacci extension for future reference. My personal target is 4,500.
Currently, Ethereum has shifted from a strong one-sided rise to entering a rising box. I personally believe that the key to ending this 1H rising trend is when the price effectively breaks below the 4150 area and forms the first descending box below.
If you want to trade short-term swings, the entry opportunity is an effective rebound after the price continues to pull back to the 4150 area. The first target is naturally to return to the upper boundary of the box: 4325 area.
The second target is to break through this box, according to the height of the box, it might be around 4490.
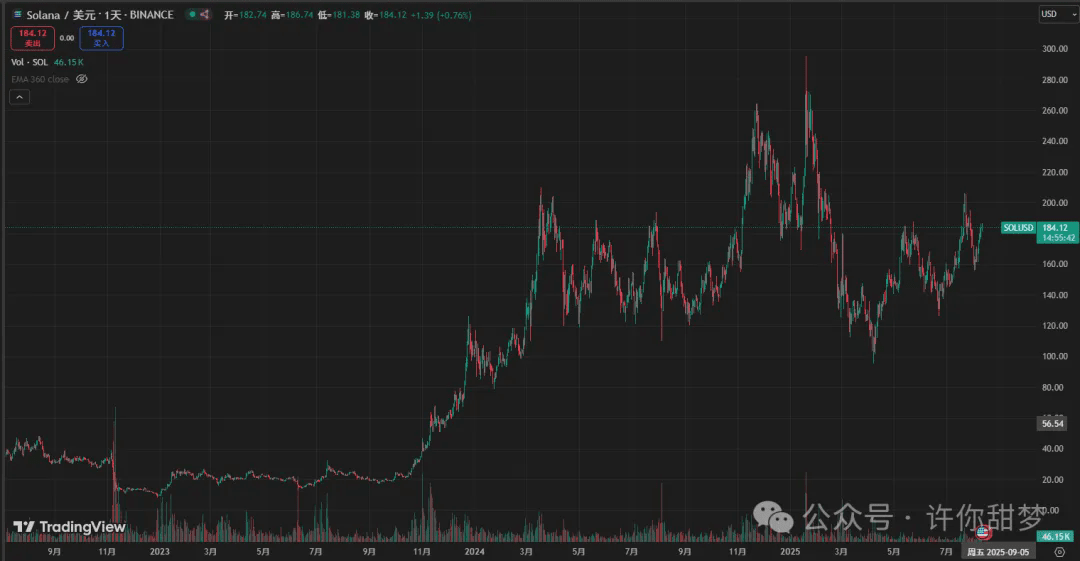
SOL
From the daily chart, the K-line has had a six consecutive bullish candles, showing a V-shaped bottom rebound, successfully breaking through all moving average resistance, and returning to the rising channel. Its MACD has also started to turn upwards, showing a trend towards forming a golden cross above zero. Once formed, a new wave of upward movement will begin to attack the 200 resistance level.
Altcoin
Bitcoin surged by 120,000, and Ethereum surged by 4,300. The main narrative in the cryptocurrency space right now is that whoever has an ETF is winning. The characteristics of an ETF bull market.
The chains with ETFs are at the top of the pyramid (BTC, ETH), first attracting the most stable large capital inflow.
Next, funds may flow along the main chain of ETFs into the ecosystem (ETH ETF → DEFI/L2/meme), not evenly distributed but prioritizing benchmark assets (like UNI, ARB, popular memes).
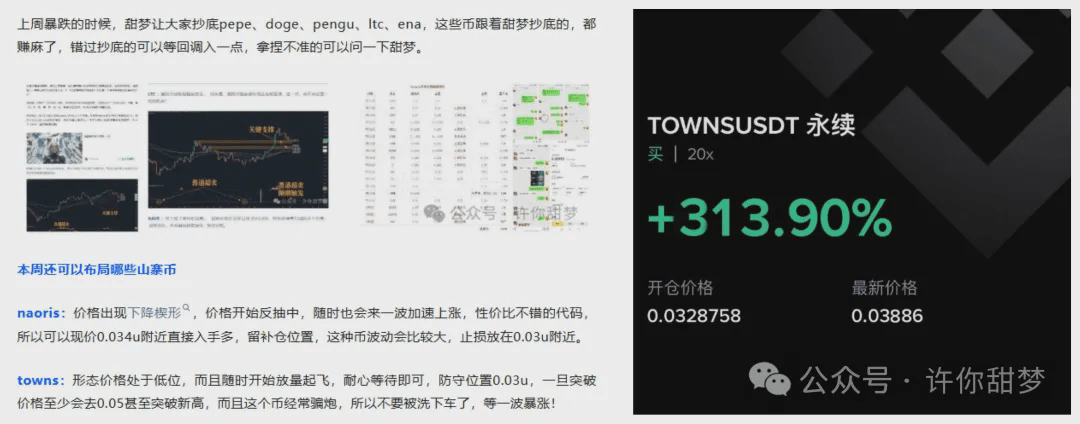
towns:
I've played this coin several times, and it finally started to take off. The price is at a low point, and a big bullish candle could appear at any time. Last Friday, I was still reminding to hold this coin, including VIPs who entered around 0.033u. Now it’s starting to take off. As for those still holding, manage your profits yourself; I will not be tracking it further!
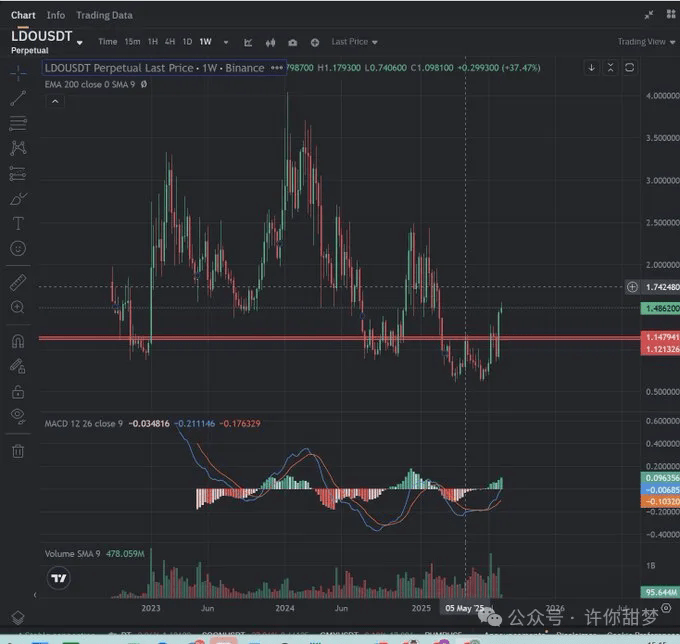
LDO: The price of LDO has just effectively broken through the key resistance zone of $1.12–$1.15 (red zone). This was a position that failed multiple times in 2024-2025. This breakthrough is accompanied by increased volume, confirming a trend change to bullish. MACD: A weekly golden cross is forming, and the histogram is expanding positively. This pattern usually indicates that there is further room for upward movement in the coming weeks.
Trading volume: This week's trading volume has significantly increased, the largest buying volume since early 2024, indicating that funds are concentrating on entering the market. Upper resistance: Short-term target is at $1.48; if broken, look towards the important high point of $1.74, and if it breaks above, it is expected to hit the $2.50–$3.00 range.
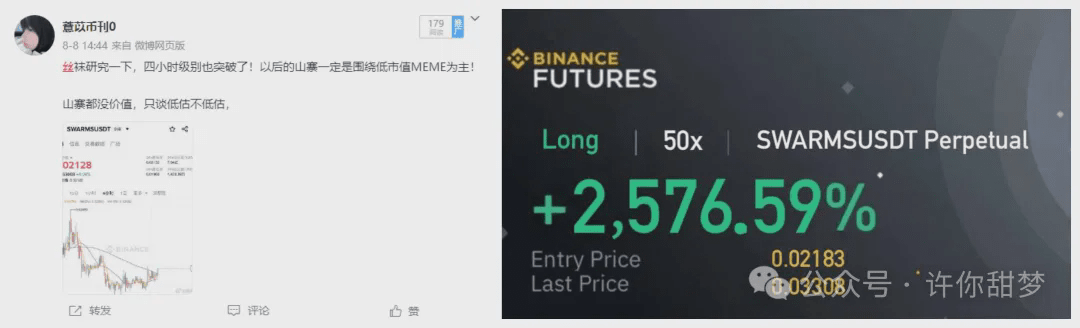
swarms:
Now that it's dropped, there's still a profit of 20-30 points. Yesterday, 0.21 sounded the charge, and then it surged all the way up to 0.34, with the highest increase being over 50 points. Those who made money with Sweet Dream can give Sweet Dream a threefold support.
SLERF
The sloth official Twitter just said it will restart, which likely means the main force has finished accumulating! At the same time, there's been an increase in volume on the daily chart, and the behavior of accumulating on the weekly chart is also very obvious! The market cap is now only around 30 million, and it's of no value for the main force to sell at this moment! A explosive upward surge of 1-2 times is very likely! I have also accumulated some here; the cost performance is indeed good.