How to judge whether a correction is about to end?
There are many methods to judge whether a short-term correction is about to end, such as analyzing from different perspectives like chip structure, financial pressure, and emotional feedback. Today, I will share a method that I often use and find very effective, which is to observe the changes in cost bases of different time groups as a reference.
Before discussing the logic, let's look at a case study—judgment of bottoms in a large cycle.
In figure 1 below, the blue line represents the average turnover cost of long-term holders (LTH-RPC), the red line represents the average turnover cost of short-term holders (STH-RPC), and the black line is the price of BTC.
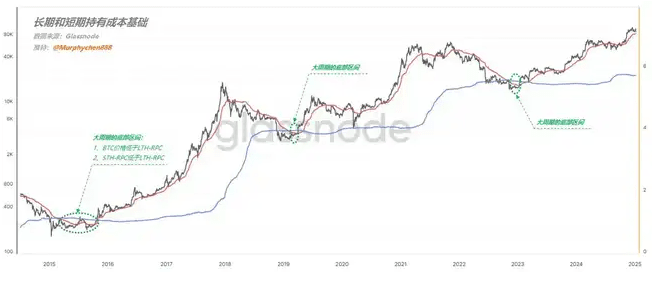
Friends, please pay attention to the areas I circled with green dashed lines. As long as the following two conditions are met:
- Condition 1: BTC price is below LTH-RPC
- Condition 2: STH-RPC is below LTH-RPC
This stage is the bottom range of the large cycle and is an excellent area for bottom fishing!
The underlying logic is:
First, the price of BTC has fallen below LTH-RPC, meaning that long-term holders are on average at a loss. This indicates that the price is severely undervalued, and almost all market bubbles have been cleared.
Second, for the vast majority of the time, the longer the holding period, the lower the relative cost of the chips. Therefore, it is extremely rare for STH-RPC to be lower than LTH-RPC.
This indicates that during the price decline, a large number of STHs incurred losses and exited the market in the short term, but new STHs came in to bottom fish; after frequent turnover, the short-term chip cost was instead pulled below the long-term chip cost. This is a signal of temporary price overselling, indicating that panic emotions are nearing the bottom. According to the above logic, we can apply the same reasoning to judge the timing of corrections in bull markets.
In the following figure 2, the chip costs are listed as follows: 1d-1w chip cost (red line), 1w-1m chip cost (yellow line), 1m-3m chip cost (blue line), 3m-6m chip cost (purple line)
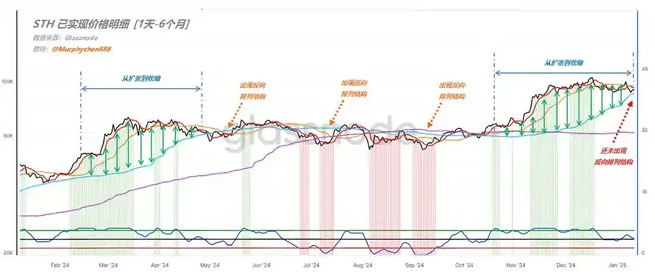
First, we look at the period from February to May 2024, which happens to be the process from the start of a trend to its decay and callback. The entire process is accompanied by the distance between the blue line and the red line expanding and then contracting (indicated by the green arrows in the figure);
Ultimately, the blue line reaches the top, while the red line is at the bottom, meaning that the relative short-term chip cost is actually lower than the relative long-term chip cost. I call this phenomenon the "reverse arrangement structure" of long-term and short-term cost bases.
I marked three places in the map with orange dashed lines, which form a "reverse arrangement structure" of blue, yellow, red from top to bottom, or purple, blue, yellow, red arrangement, corresponding to the relative bottoms in the callback.
So the current trend is similarly transitioning from rapid expansion to gradual contraction, but the blue line is still below. If we want to see the market start again in the short term, we might need to first form a "reverse arrangement structure". However, after this period of turnover, the blue line is already very close to the red and yellow lines. As long as it consolidates for a while longer, the structure can form, thus meeting the conditions for forming a relative bottom.
Summary:
Based on the changes in the cost basis of different time groups as a judgment basis for the callback time, if the relative cost of long-term chips is higher, once a "reverse arrangement structure" of blue, yellow, red from top to bottom forms, it indicates sufficient turnover, emotions nearing the bottom, and the callback time is about to end.
