

Ethereum’s OBV surged to 12.75M after breaking consolidation, showing renewed buying activity and strong accumulation.
ETH hit multi month highs near $4,300, supported by rising trading volume and bullish technical momentum indicators.
RSI above 73 and MACD crossover in early August align with ETH’s breakout beyond $3,600, signaling continued upward strength.
Ethereum’s on-balance volume (OBV) has surged to levels not seen in a long time, according to IncomeSharks. The indicator, which tracks buying and selling pressure, broke out after weeks of consolidation.
This comes alongside price action that has pushed ETH to multi month highs near $4,300. The analyst suggests the latest OBV breakout could indicate that buying momentum is resuming after a healthy cooling off phase.
OBV Strength Emerges After Consolidation
Between April and early July, OBV fluctuated between 9.0M and 10.75M, indicating mixed market sentiment. Mid-July was a turning point as OBV spiked to around 12.75M, suggesting strong accumulation.
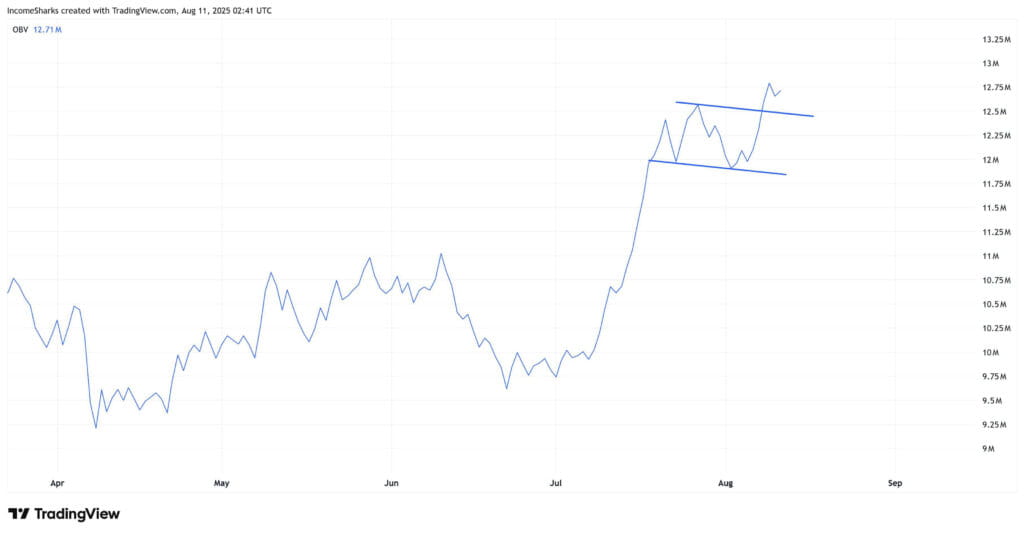 Ethereum price chart, Source: IncomeSharks on X
This rally paused in early August when OBV formed a downward sloping parallel channel between 12.0M and 12.6M. The latest breakout above 12.6M pushed OBV back to 12.75M, pointing to renewed buying activity.
The strength in OBV aligns with recent price behavior. Ethereum traded in an ascending channel between $2,000 and $3,200 from April to June before accelerating sharply in late July. This surge carried ETH above $3,600 and into its current range near $4,300.
Price Momentum Aligns With Technical Indicators
Trading volume has risen during upward moves, with 16.15K ETH recorded recently. These spikes in volume have typically accompanied breakout phases, supporting the underlying strength.
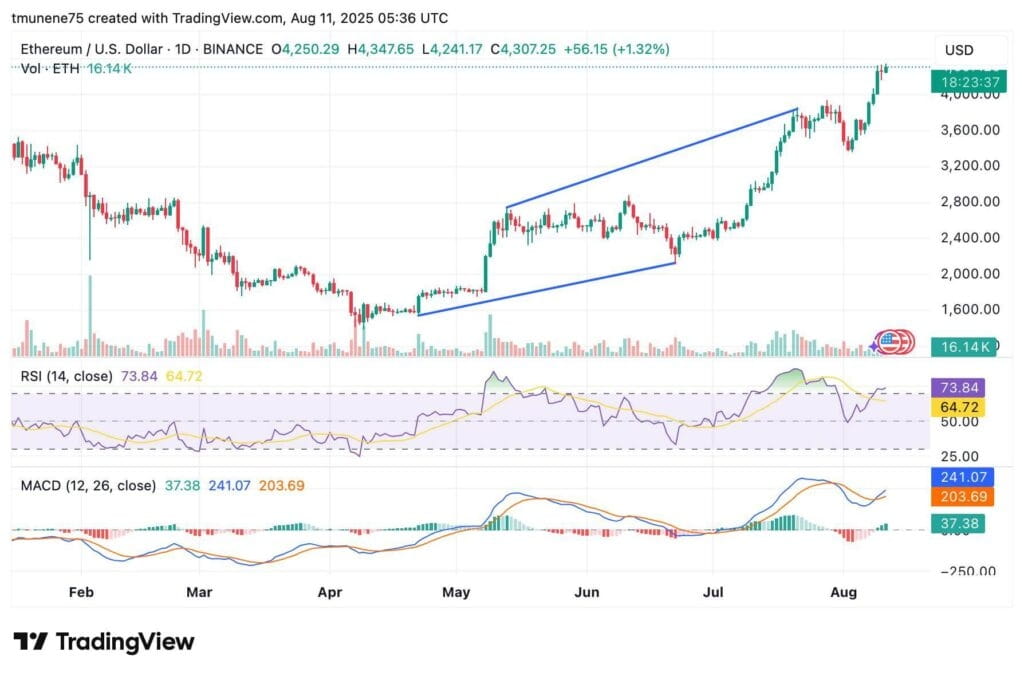 ETH/USD 1-day price chart, Source: TradingView
Technical momentum indicators also show the bullish push. The RSI is at 73.87, placing ETH in overbought levels. This follows a steady climb from mid range levels after a brief cooling period.
The MACD line is above its signal line, with a positive histogram of 37.47. The bullish crossover in early August coincided with the breakout past $3,600, adding further confirmation to the trend.
Key Levels to Watch in the Near Term
Short term moves could see minor pullbacks toward $4,150 or $4,000 if overbought conditions lead to profit taking. However, sustained buying pressure may keep focus on higher targets near $4,500 and $4,800. Analysts caution that a drop back below $4,000 would be an early sign of exhaustion, leading to a retest of $3,600.
The post Ethereum On-Balance Volume Breaks Higher, Analyst Sees Strongest Upside Setup in Months appears on Crypto Front News. Visit our website to read more interesting articles about cryptocurrency, blockchain technology, and digital assets.


