

ETH hits $4,249, surpassing $4,050–$4,100 resistance for the first time since 2021, turning it into key support.
MVRV ratio at 2.0 suggests more upside potential before hitting historical profit taking danger zones.
Breakout signals change from consolidation to momentum phase, with $4,500–$4,800 as next targets.
Ethereum recorded its strongest weekly close in nearly four years, a new high in its ongoing recovery. At press time, ETH was trading at $4,249, surpassing a resistance range of $4,050–$4,100 that had capped price gains since early 2022.
This level now shifts into a key support area, following multiple unsuccessful breakout attempts in previous cycles. The move marks Ethereum’s highest weekly close since November 2021, when it last traded near $4,500 before a steep market decline.
Price Breakout Could lead to New Technical Levels
Historical price action shows Ethereum peaking near $4,500 in November 2021 before declining below $900 by mid-2022. The market later rebounded sharply, reaching about $4,100 in early 2024, but failed to hold the advance, dropping under $2,000 before the latest breakout.
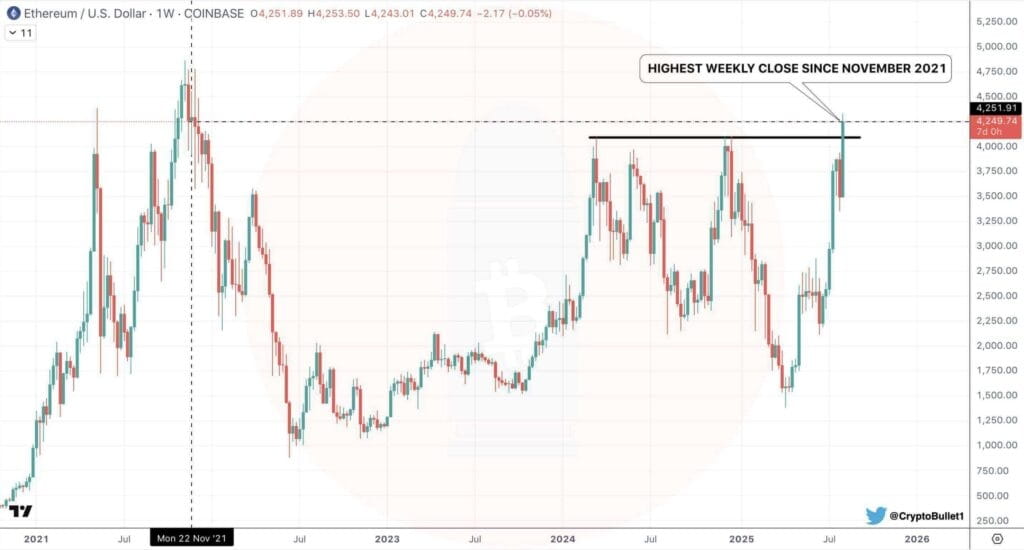 ETH/USD 1-week price chart, Source: CryptoBullet on X
The recent close above $4,100 is backed by consecutive weekly gains, suggesting momentum strength. Immediate upside targets include the $4,500 resistance and the all-time high region above $4,800. However, failure to maintain levels above $4,100 could result in a pullback toward the $3,800–$3,600 range.
Analyst Notes Further Potential Upside
According to analyst Ali, Ethereum’s Market Value to Realized Value (MVRV) ratio has climbed to roughly 2.0, doubling from 2023–2024 lows below 1.0. This reading shows average holders currently have unrealized gains of about 100%.
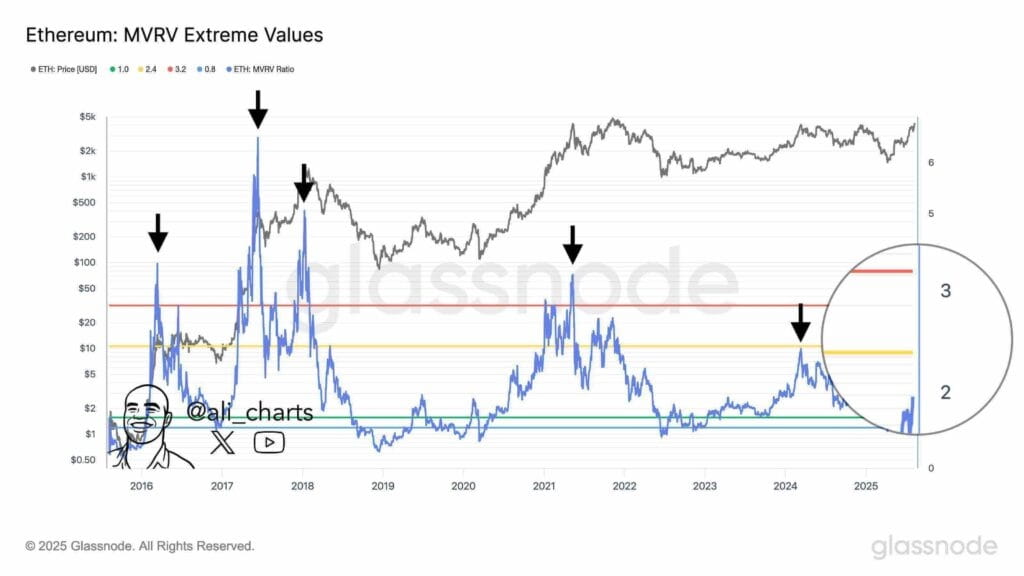 Ethereum MVRV Extreme Values chart, Source: Ali on X
Historically, MVRV danger zones emerge near 2.4 and 3.2, where increased profit-taking has occurred. The current position remains below these thresholds, suggesting more room for price expansion before reaching historically overheated levels. Sustaining the ratio between 1.5 and 2.4 can support an ongoing uptrend without immediate correction pressures.
Consolidation to Momentum Phase
The decisive close above long standing resistance suggests a change in Ethereum market. Experts indicate that such previous breakouts usually lead to larger trading ranges and increased activity from both retail and institutional traders.
Historical patterns indicate that strong rising waves can still suffer brief downturns, typically retesting breakout levels prior to resumption. Whether Ethereum holds its resistance above the newly created support area and tests previous record highs remains to be seen.
The post Ethereum Posts Highest Weekly Close Since 2021 as Key Resistance Breaks appears on Crypto Front News. Visit our website to read more interesting articles about cryptocurrency, blockchain technology, and digital assets.


