

Ethereum price stands at $4,250, supported by a market capitalization of $510.70 billion and a 24-hour trading volume of $32.21 billion. The daily trading range has fluctuated between $4,172.29 and $4,315.64, reflecting high volatility and active participation across time frames.
Ethereum
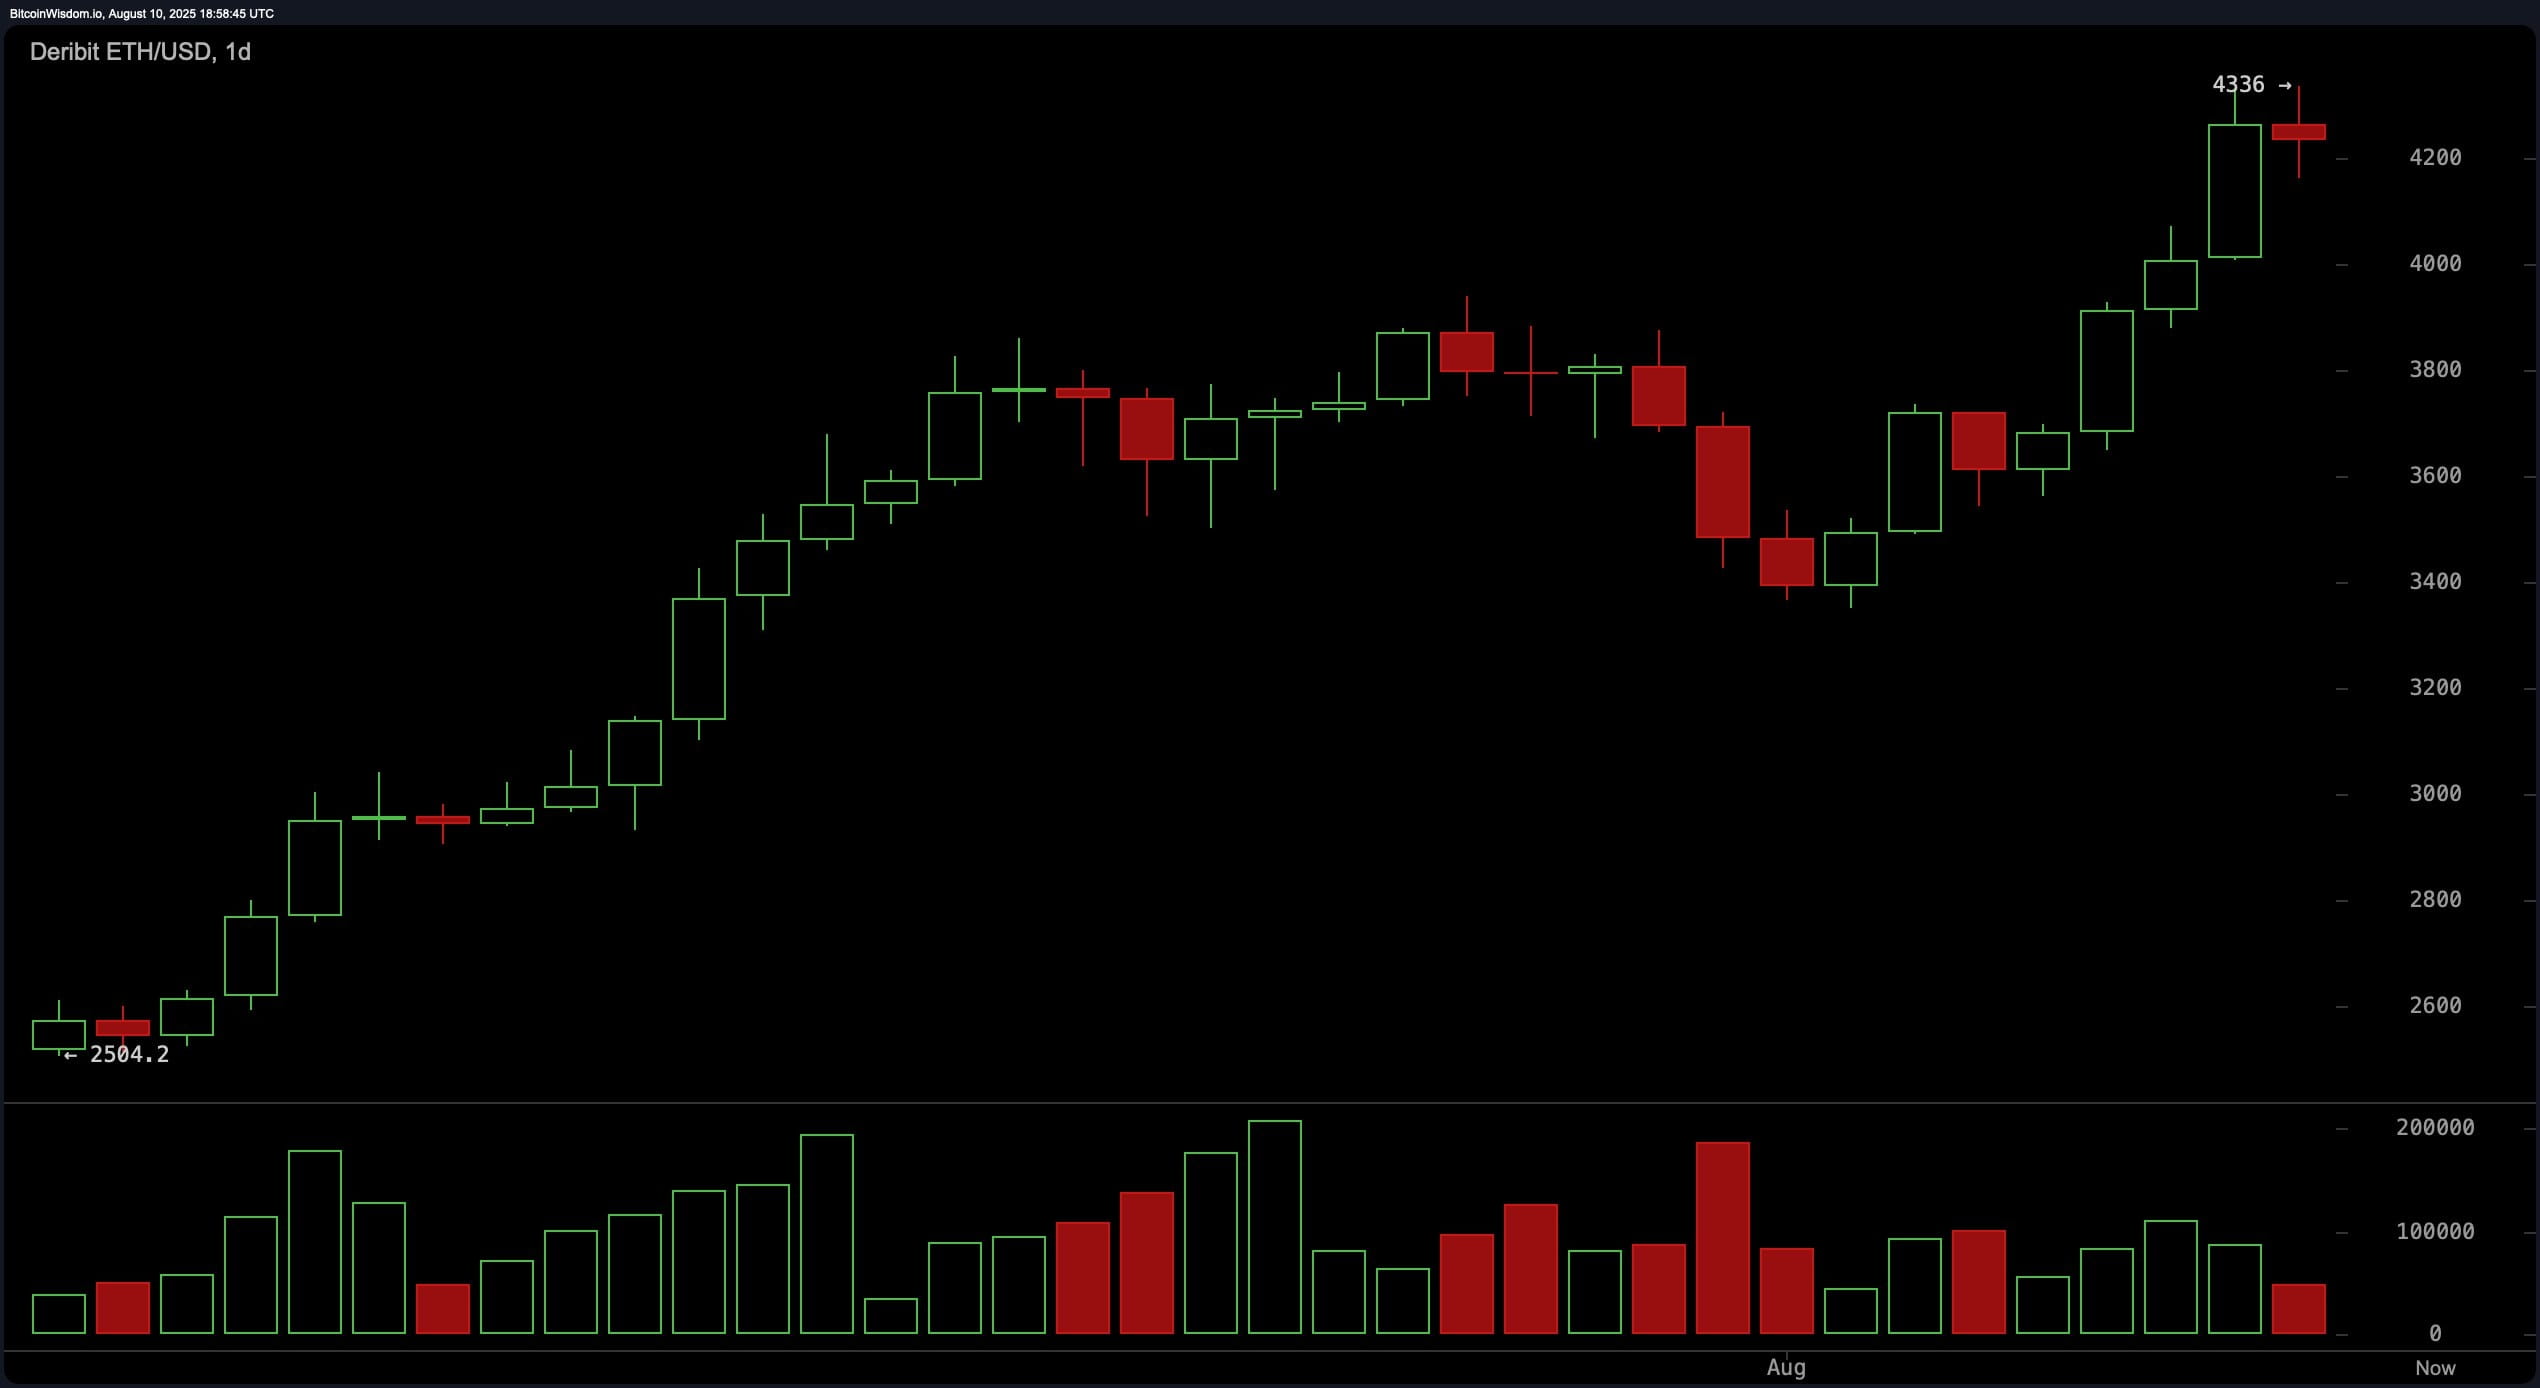
The daily chart of Ethereum (ETH) reveals a strong bullish rally extending from around $2,500 to a recent peak of $4,336. However, the current price action shows a small red candle following this significant rally, suggesting a potential temporary pullback. Important support lies between $4,000 and $4,050, marking the final consolidation area, while resistance remains near the $4,336 peak. Overall, the macro trend remains intact, though the protracted nature of this rally signals caution for potential bearish adjustments.
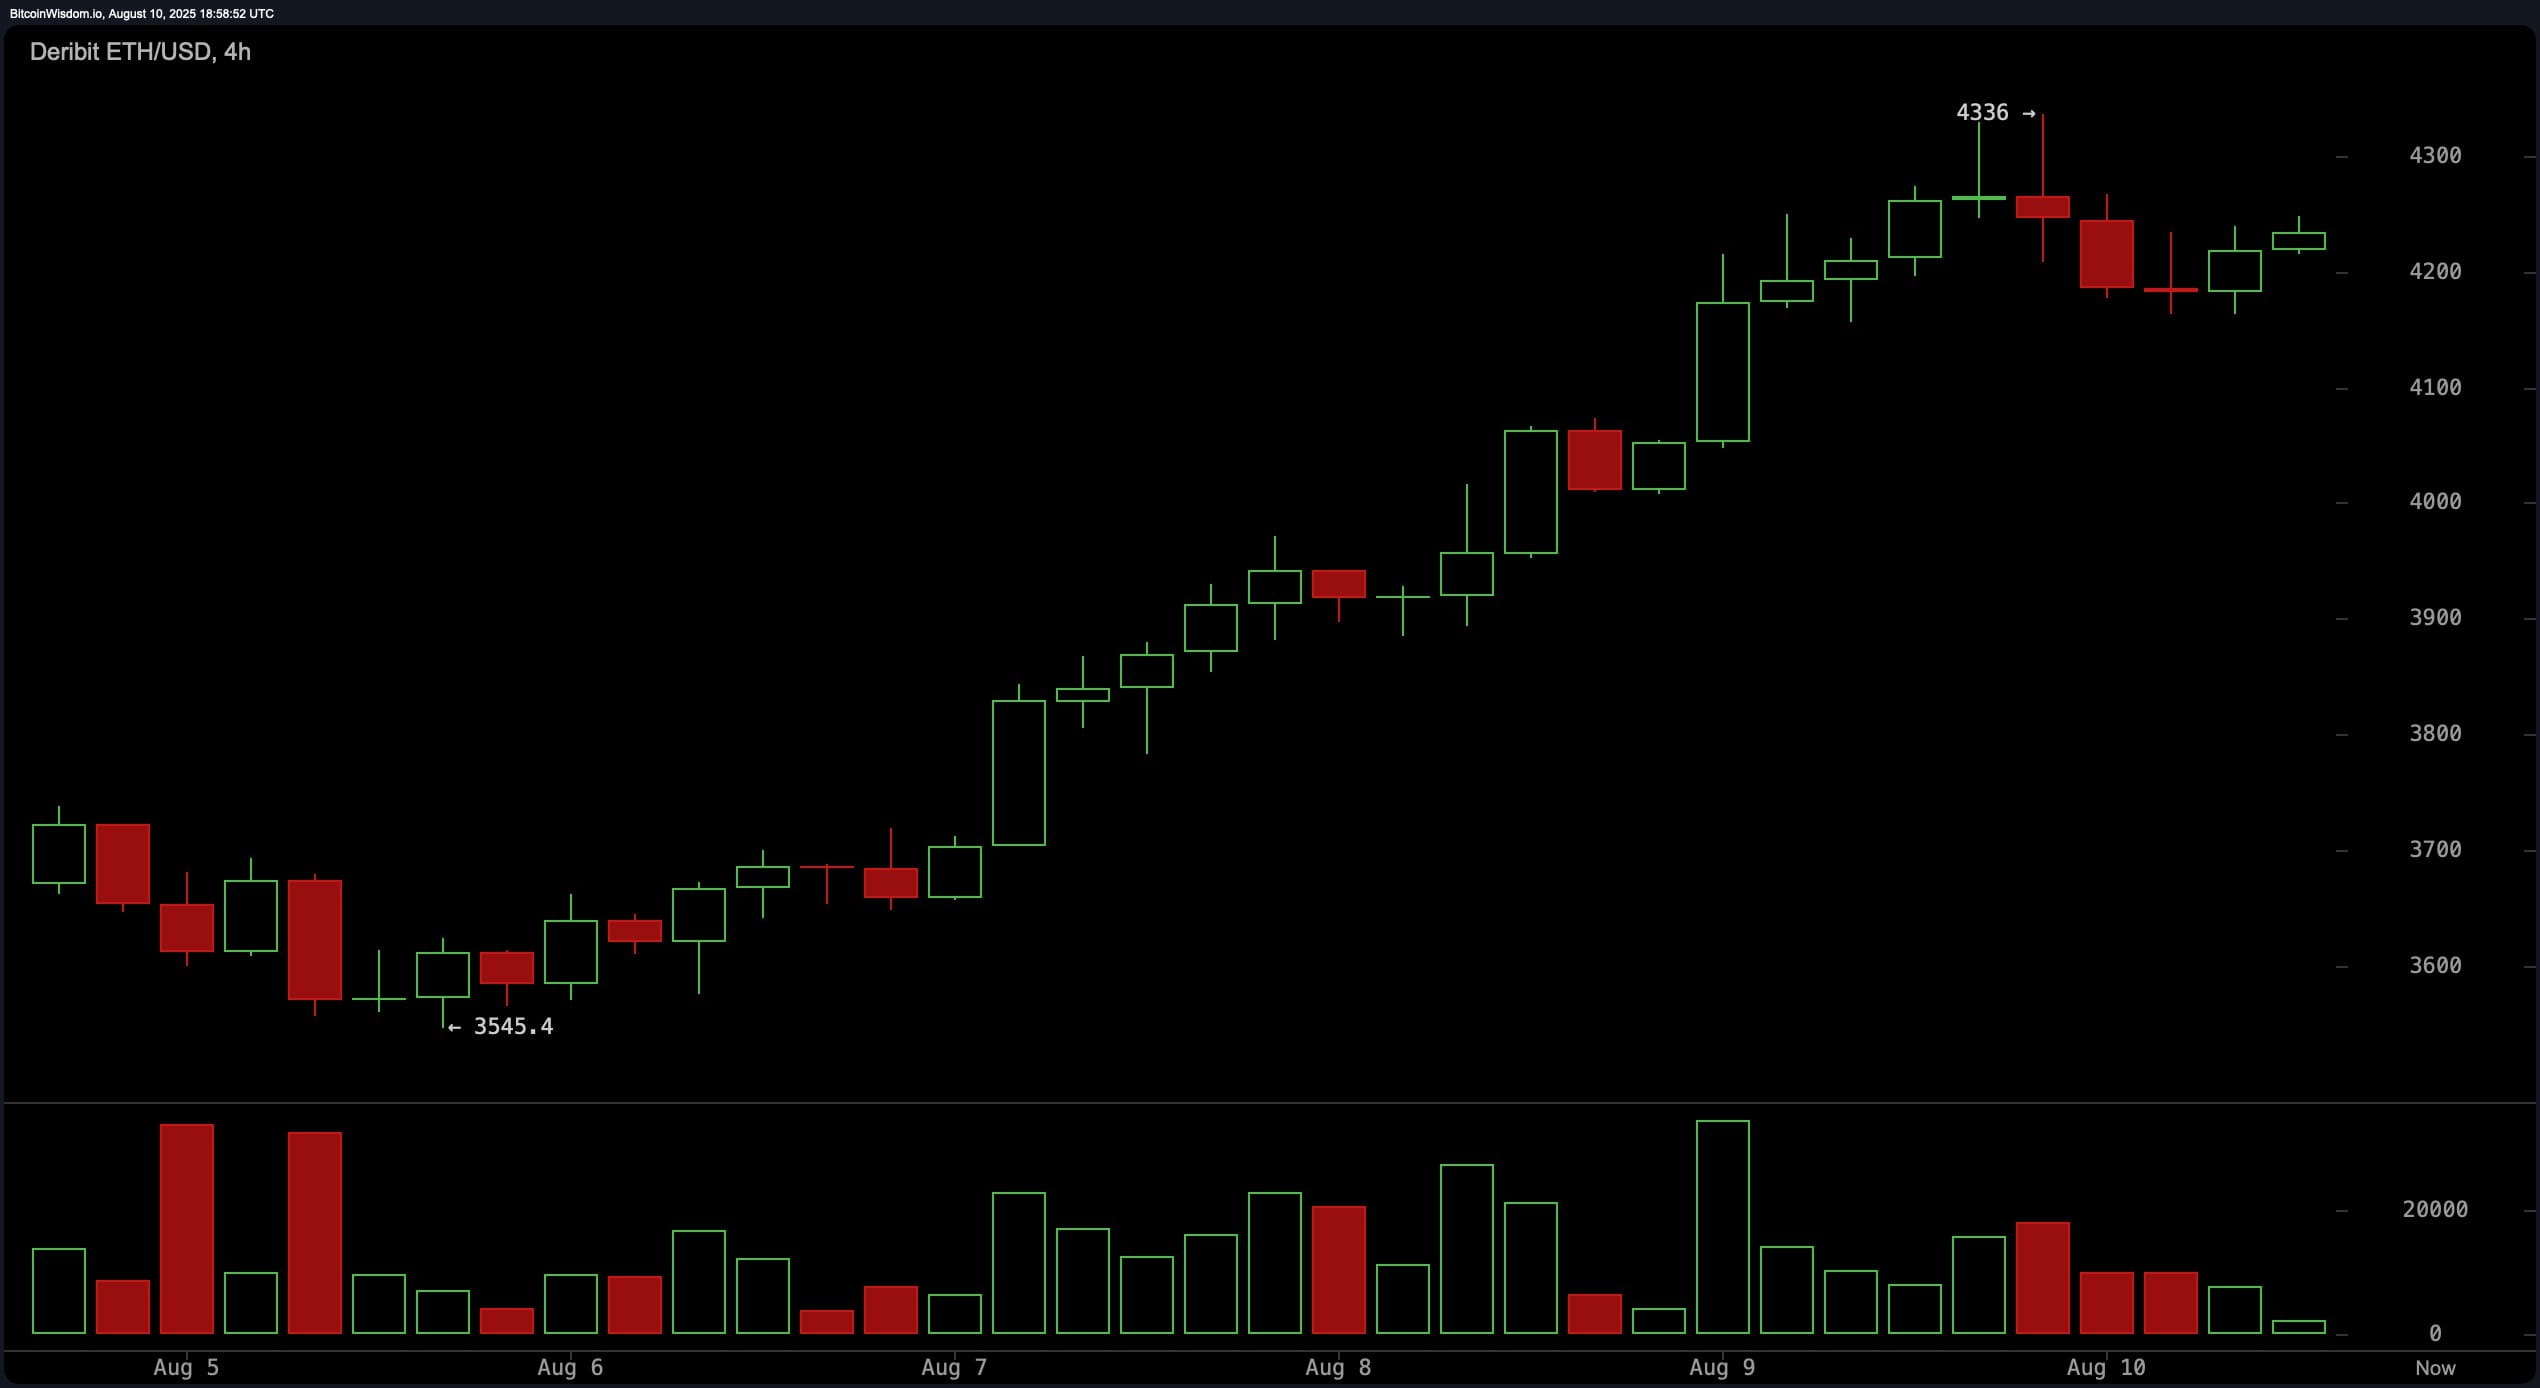
On the four-hour chart, Ethereum has continuously climbed since August 5 from around $3,545 to $4,336, followed by a small consolidation phase. Volume has decreased after the peak, indicating waning buying pressure, and a slight rounding top is forming. This could be an early sign of short-term distribution before a pullback. Traders may find cleaner entry points during the pullback toward the $4,050–$4,100 range if bullish confirmation occurs, while failing to regain the $4,300 level could open the door to testing $4,000.
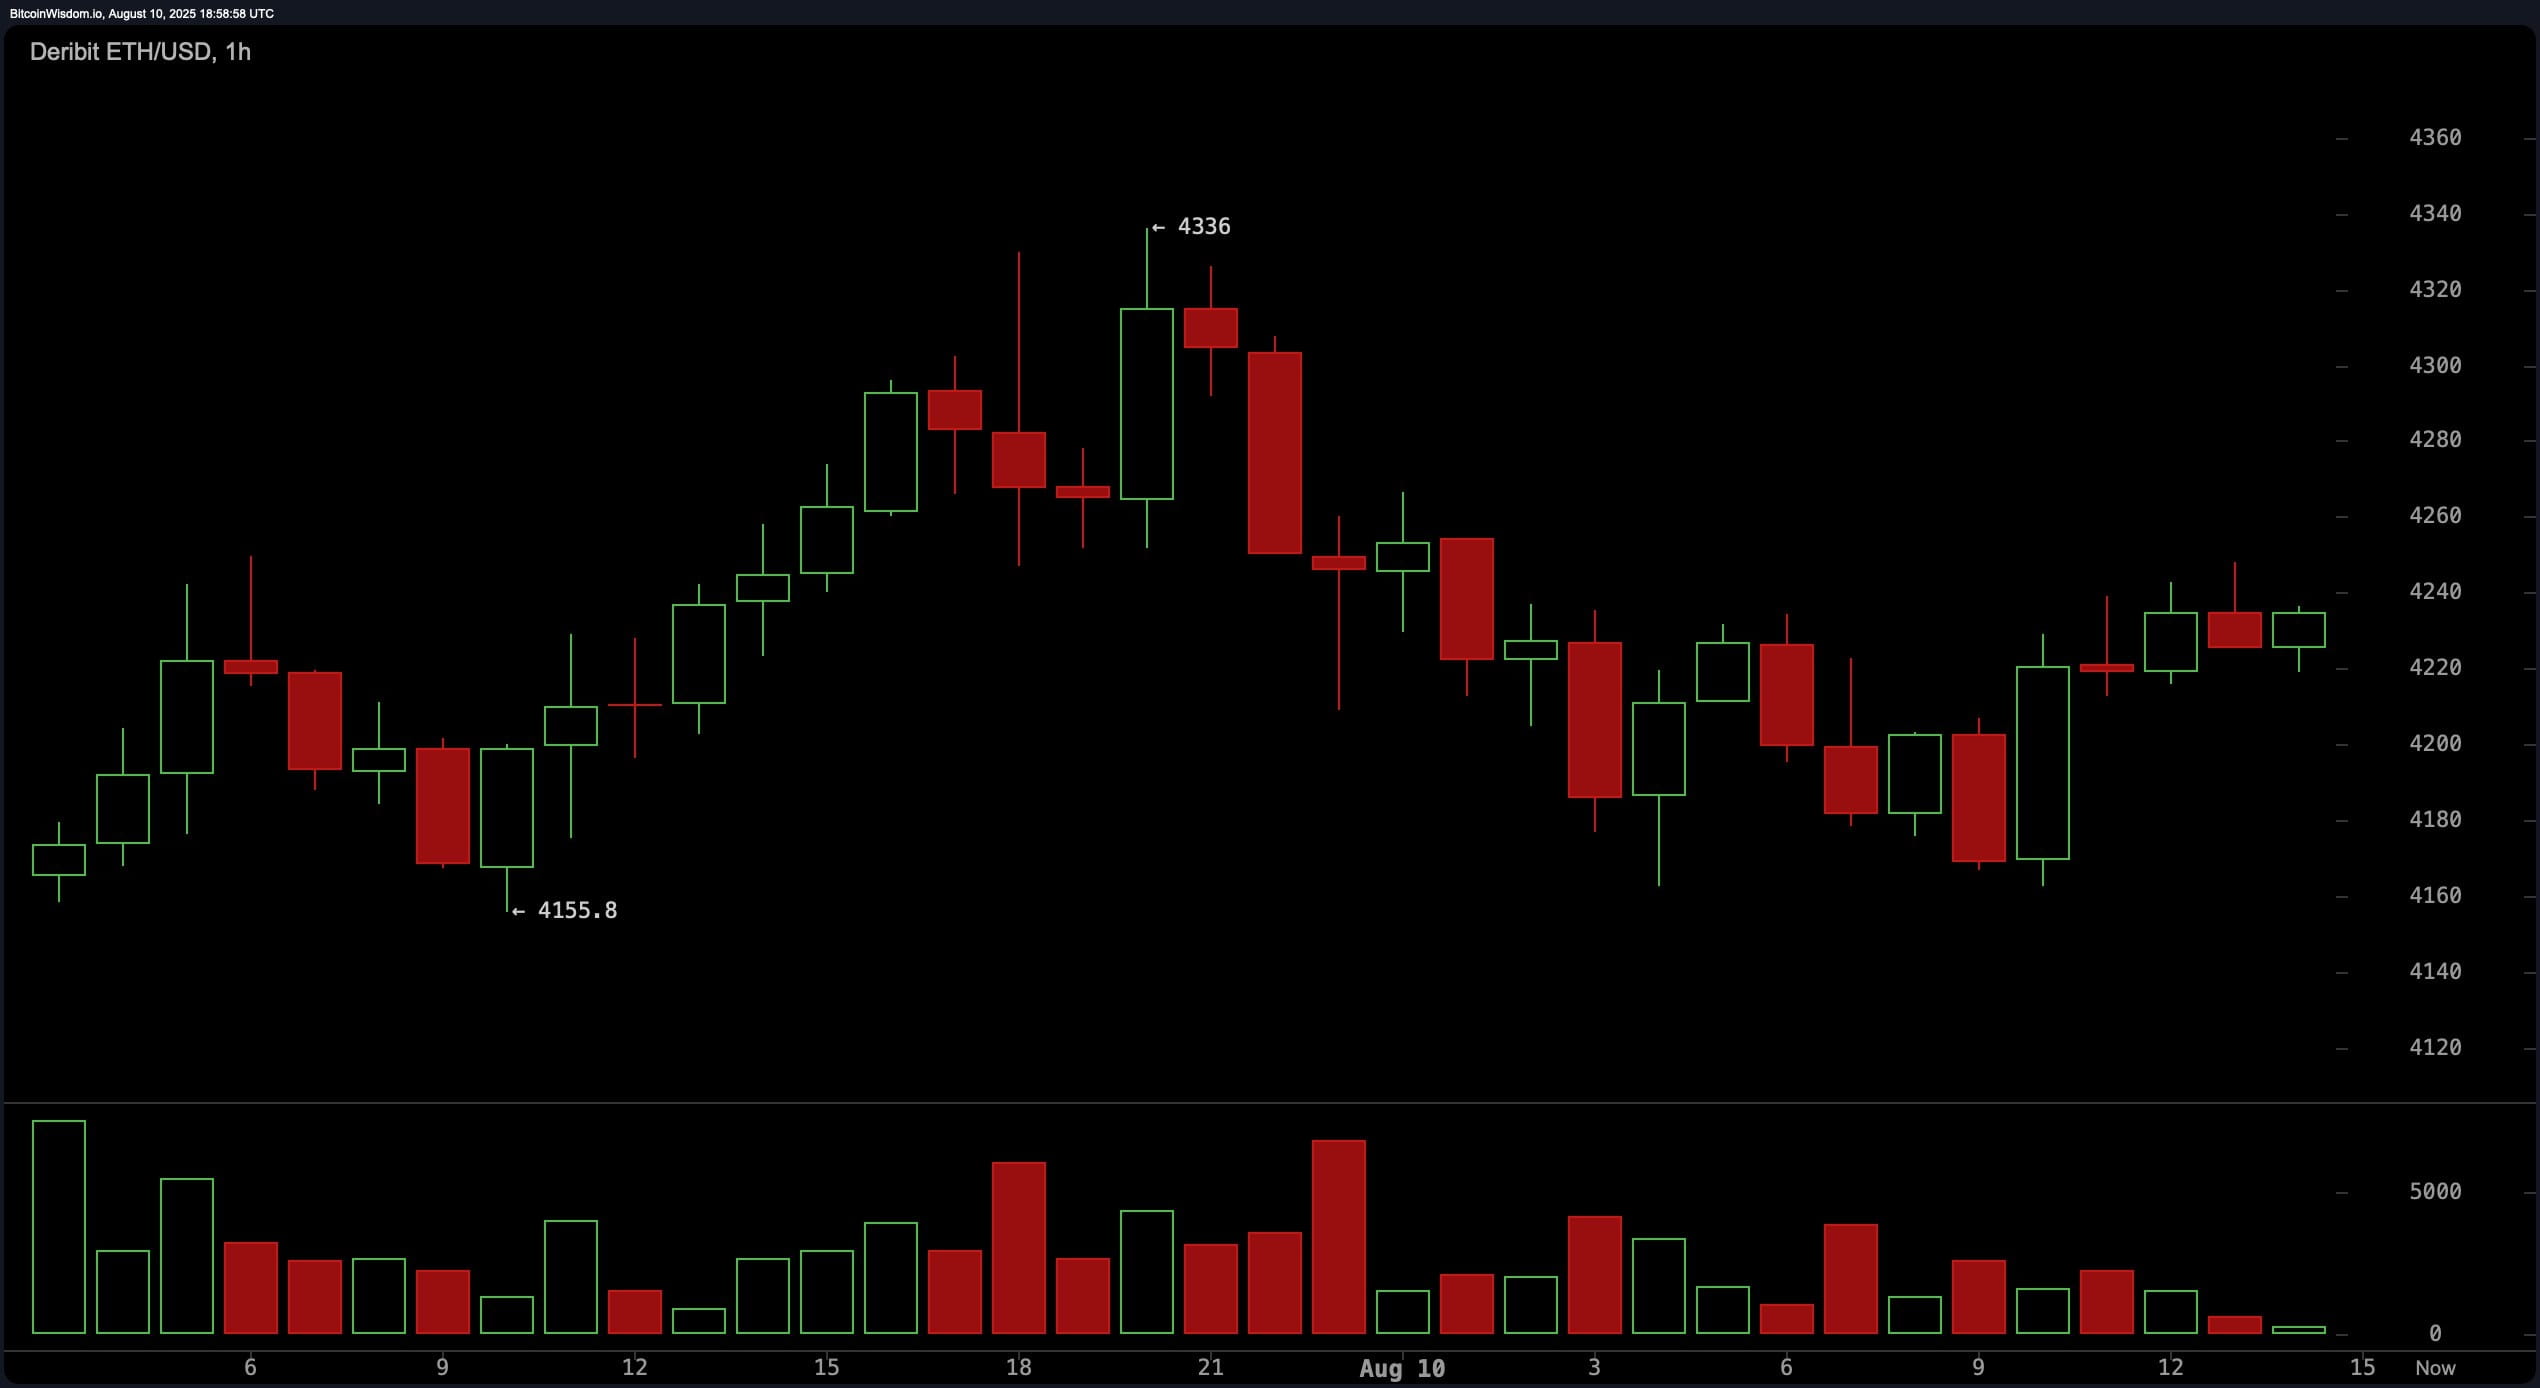
The one-hour chart of Ethereum shows volatility following the peak of $4,336, with multiple lower highs and lower lows forming. Short-term support is around $4,155, and breaking this level with volume could trigger more selling pressure. Resistance is concentrated between $4,280 and $4,300, where rejection could affirm the short-term bearish trend. Scalping trading opportunities exist for buying near support and selling near resistance, with profit targets in the range of 1–2 percent due to choppy market conditions.
Reading the oscillators presents a mixed picture. The Relative Strength Index (RSI) at 71.8 indicates overbought conditions alongside a selling trend, while the stochastic at 91.6 remains neutral. The Commodity Channel Index (CCI) at 222.0 also points to a selling trend, however, momentum at 533.9 and the Moving Average Convergence Divergence (MACD) at 221.5 signal buying conditions. The Average Directional Index (ADX) at 41.3 and the Awesome Oscillator at 452.3 maintain a neutral stance, suggesting that while upward momentum persists, it is not without resistance.
Moving averages (MAs) reinforce the mid-term bullish structure of Ethereum. All exponential and simple moving averages from 10 to 200 periods are in buy territory, with the 10-period exponential moving average at $3,908.7 and the 200-period simple moving average at $2,520.3 providing strong trend confirmation. This arrangement suggests that despite recent volatility, the broader trend of Ethereum remains upward, with significant support levels likely to attract buyers if tested.
Ethereum derivatives market activity
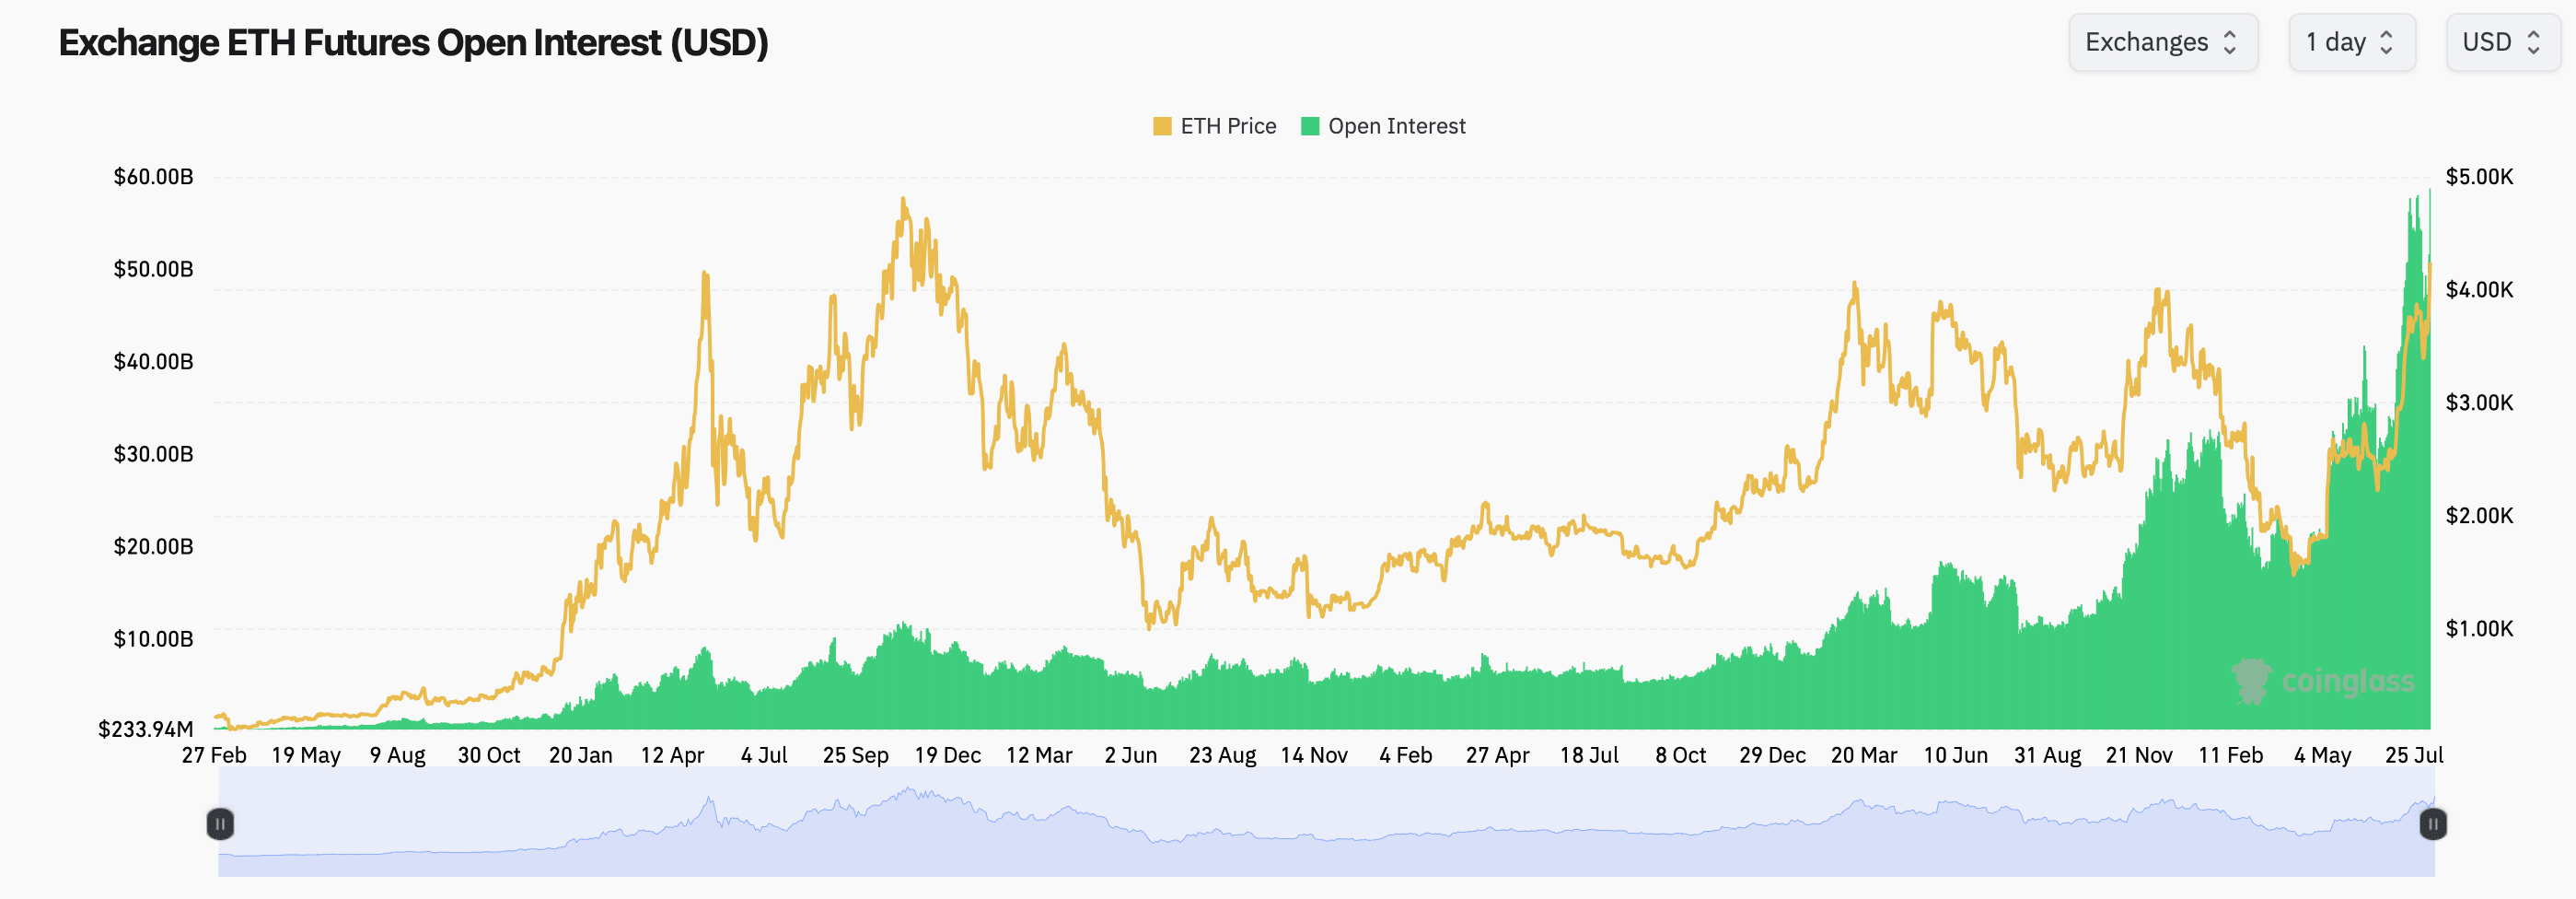
The Ethereum futures market is reflecting record participation, with the total open interest (OI) on exchanges reaching approximately $58.57 billion, or 13.83 million ETH. The largest share belongs to Binance with 20.1% of total open contracts, followed by CME with 12.46% and Bybit with 9.48%. The change in open interest over the past 24 hours shows a slight bullish momentum across most platforms, signaling a persistent commitment from traders despite fluctuations in the spot price over the weekend. This strong OI reflects broad market confidence that Ethereum will remain a highly volatile and liquid asset in the near future.
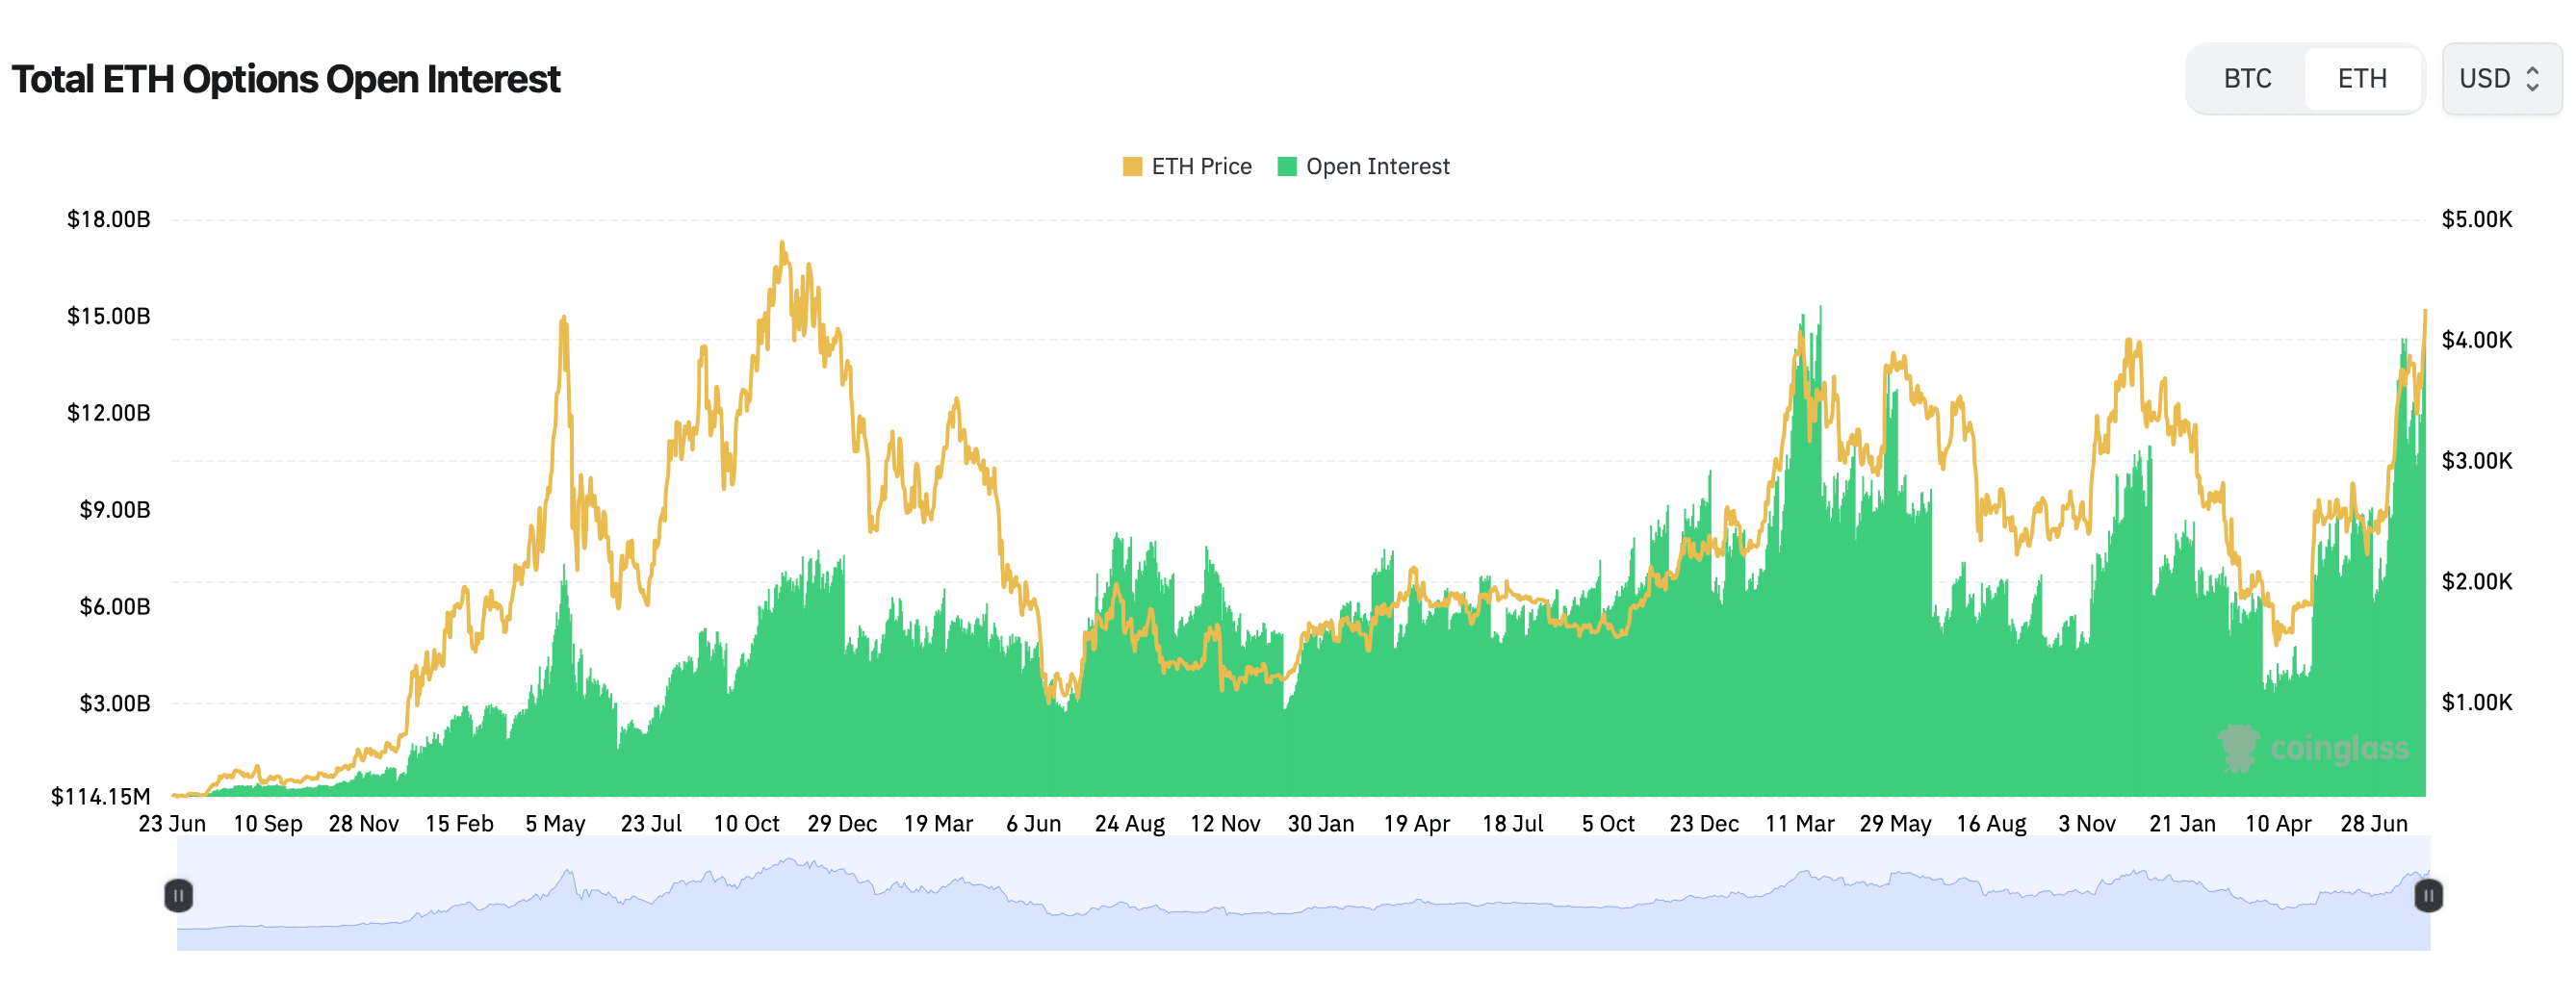
Options data adds another layer to Ethereum's bullish trend. Call orders dominate with 67.71% of total open contracts compared to 32.29% for put orders, representing 2.3 million ETH in call positions. Notably, contracts for December 2025 with target prices of $6,000 and $4,000 lead the OI metrics, suggesting long-term bullish expectations. Over the past 24 hours, call volume has also outperformed puts at 61.04% versus 38.96%, led by September 2025 options at $4,500. This skew towards bullish price exposure suggests that many traders are positioning for a breakout above current resistance, consistent with a sustainable upward slope in moving averages.
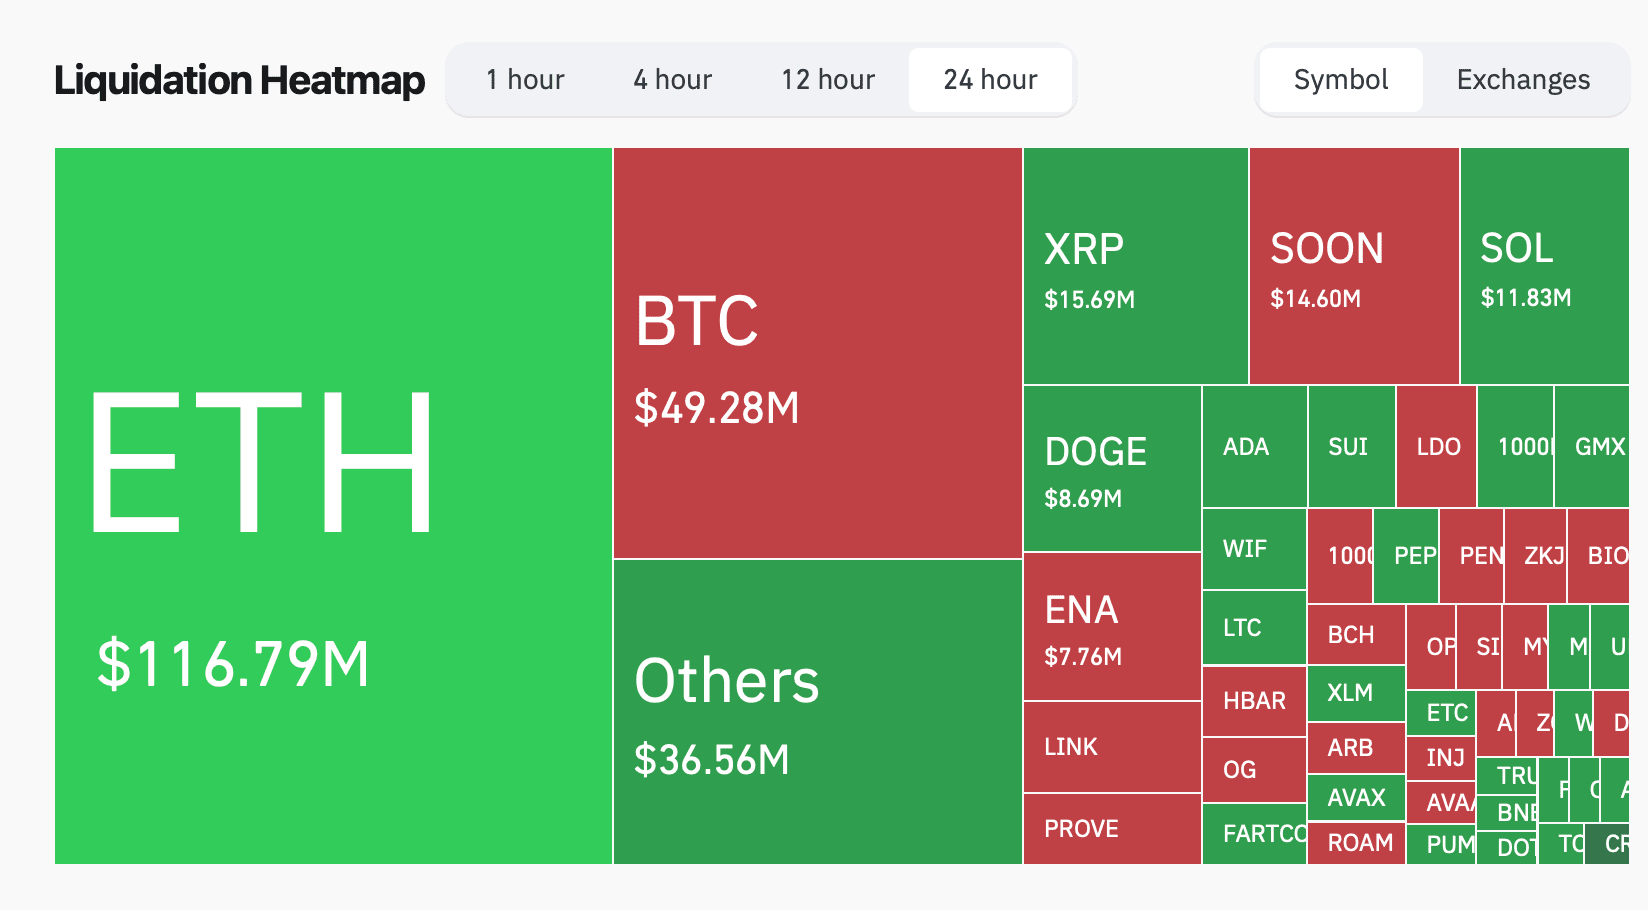
Liquidations over the past day have been significant, totaling $328.71 million across the crypto market, with Ethereum accounting for the largest share at $116.79 million. The split between long and short liquidations is nearly balanced at $169.39 million and $159.32 million, respectively, revealing a fierce battle between buyers and sellers.
Buyer's conclusion:
The futures and options structure of Ethereum, with 67.71% of call positions dominating and open contracts at a record high nearing $59 billion, supports a sustained bullish bias. All major moving averages remain in buy territory, and strong participation from institutions like CME and Binance indicates confidence in further price increases. A breakout above $4,300 could pave the way for a retest of the $4,336 peak and potentially target $4,500 and beyond.
Seller's conclusion:
Despite the long-term optimistic structure, the high Relative Strength Index (RSI) and heavy total liquidations of $328.71 million in the past 24 hours suggest that the market is under strain. The volume drop after a recent peak combined with resistance near $4,300 and the round number on the 4-hour chart could lead to a pullback towards the $4,050–$4,000 support area. A breakdown below $4,000 could trigger another wave of liquidations, solidifying momentum towards sellers.
