Ethereum [ETH] has continued its upward momentum from the $2,400 range and is testing the key resistance level of $4,400 on the chart. In fact, this level has previously triggered reversals for ETH.
At the time of publication, its value is $4,206, suggesting that the market is at a decisive turning point.
However, it is important to note that long-term on-chain signals have recently been leaning bullish. For example, since 2022, the exchange supply ratio (ESR) across all exchanges has been steadily declining, reflecting a decrease in selling liquidity and an increase in accumulation trends.
Conversely, specific data from Binance has issued short-term warnings. Its ESR has been climbing since early 2025, accompanied by significant inflows—these conditions are usually associated with selling pressure.
This divergence between macro strength and tactical caution may suggest potential volatility in the future.
Does the chart for Ethereum suggest a breakout point or an exhaustion point?
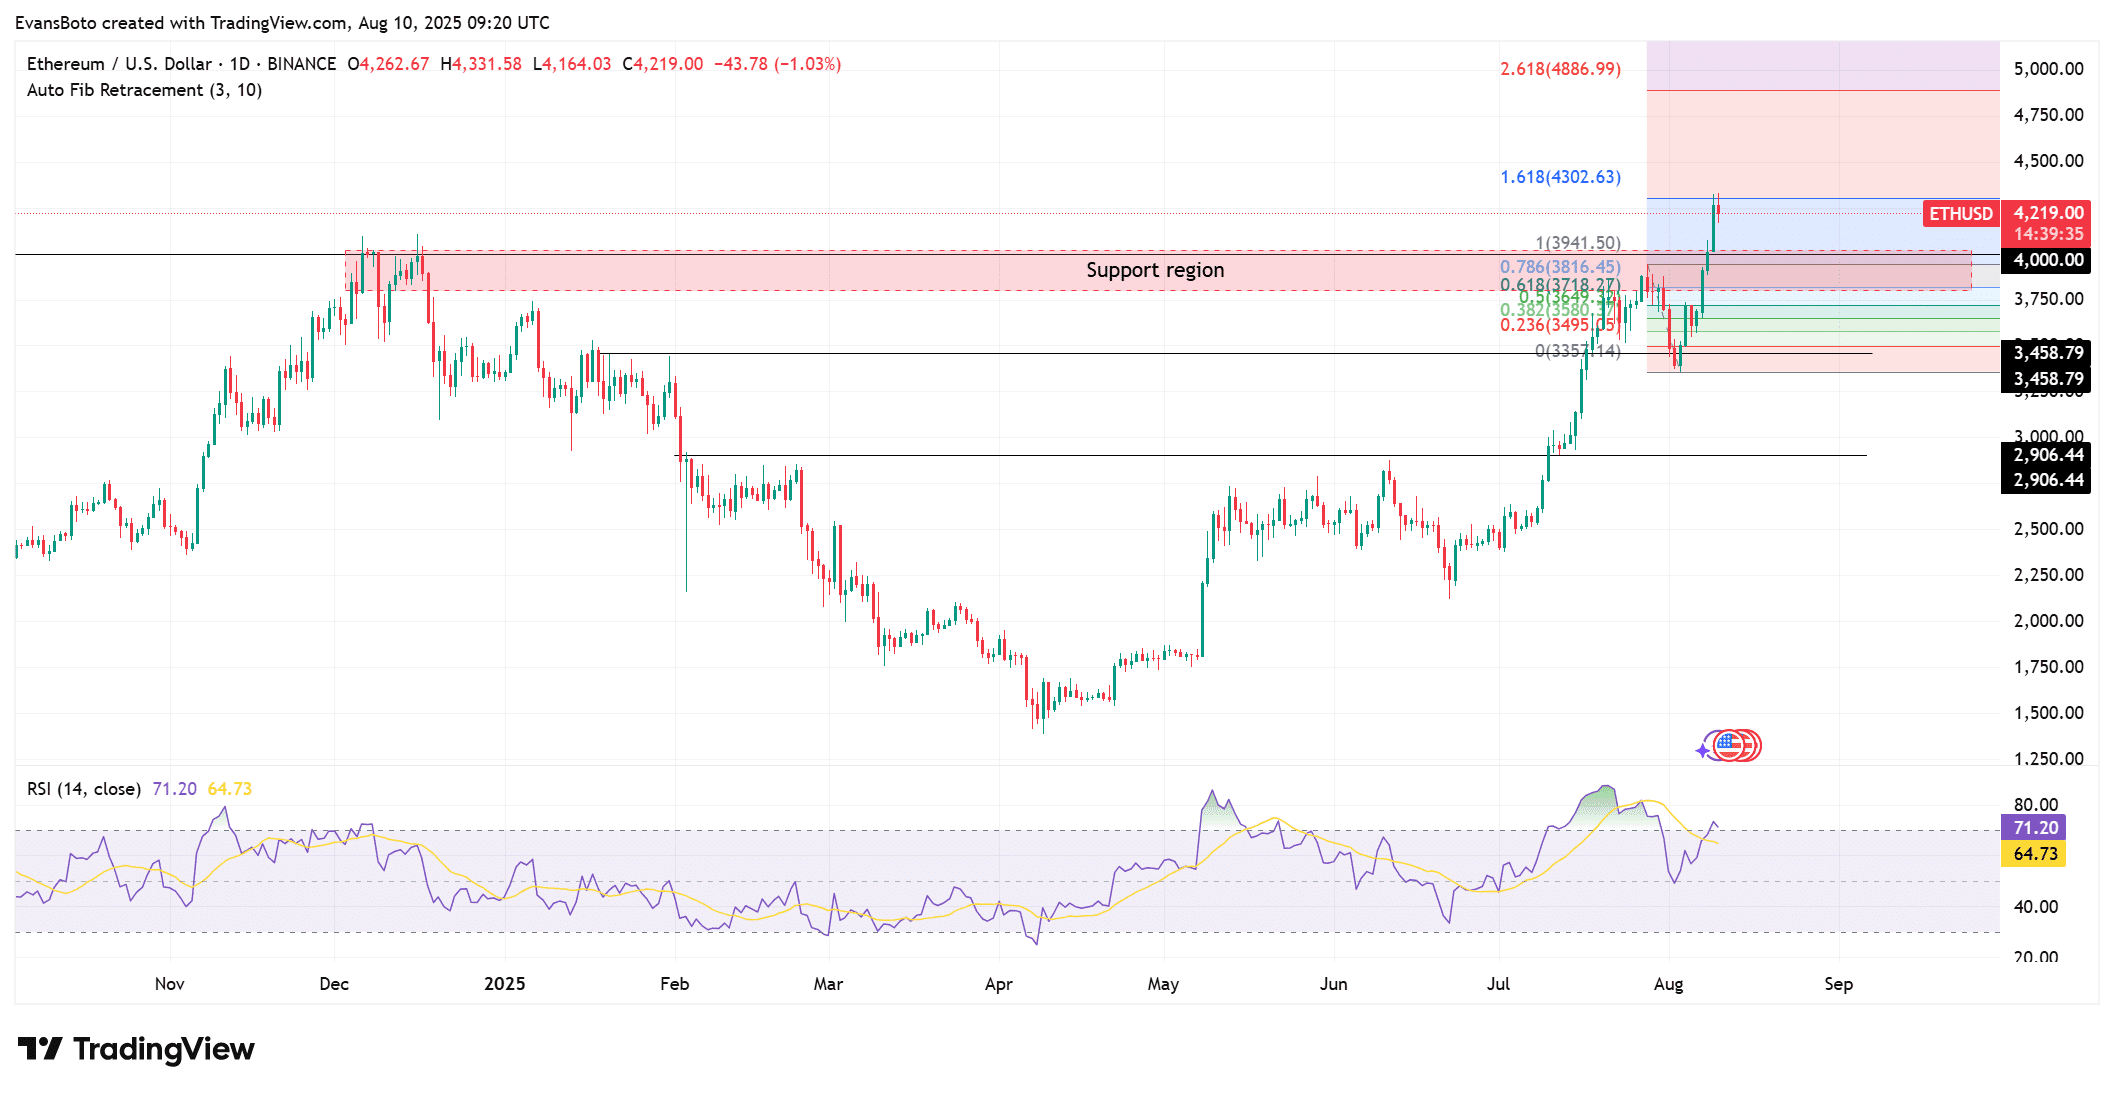
At the time of writing, the daily chart shows that Ethereum is testing the $4,400 mark while maintaining support around $4,000.
The Relative Strength Index (RMI) hovers around 71, indicating that the market may be entering overbought territory. In fact, Fibonacci extension lines show that $4,302 is the recent upside potential, and if momentum continues, the next target will be $4,886.
However, the rise in the RSI indicator does indicate the possibility of profit-taking. Therefore, traders may need to be vigilant for signs of weakness.
 Are futures traders pushing leverage to dangerous extremes?
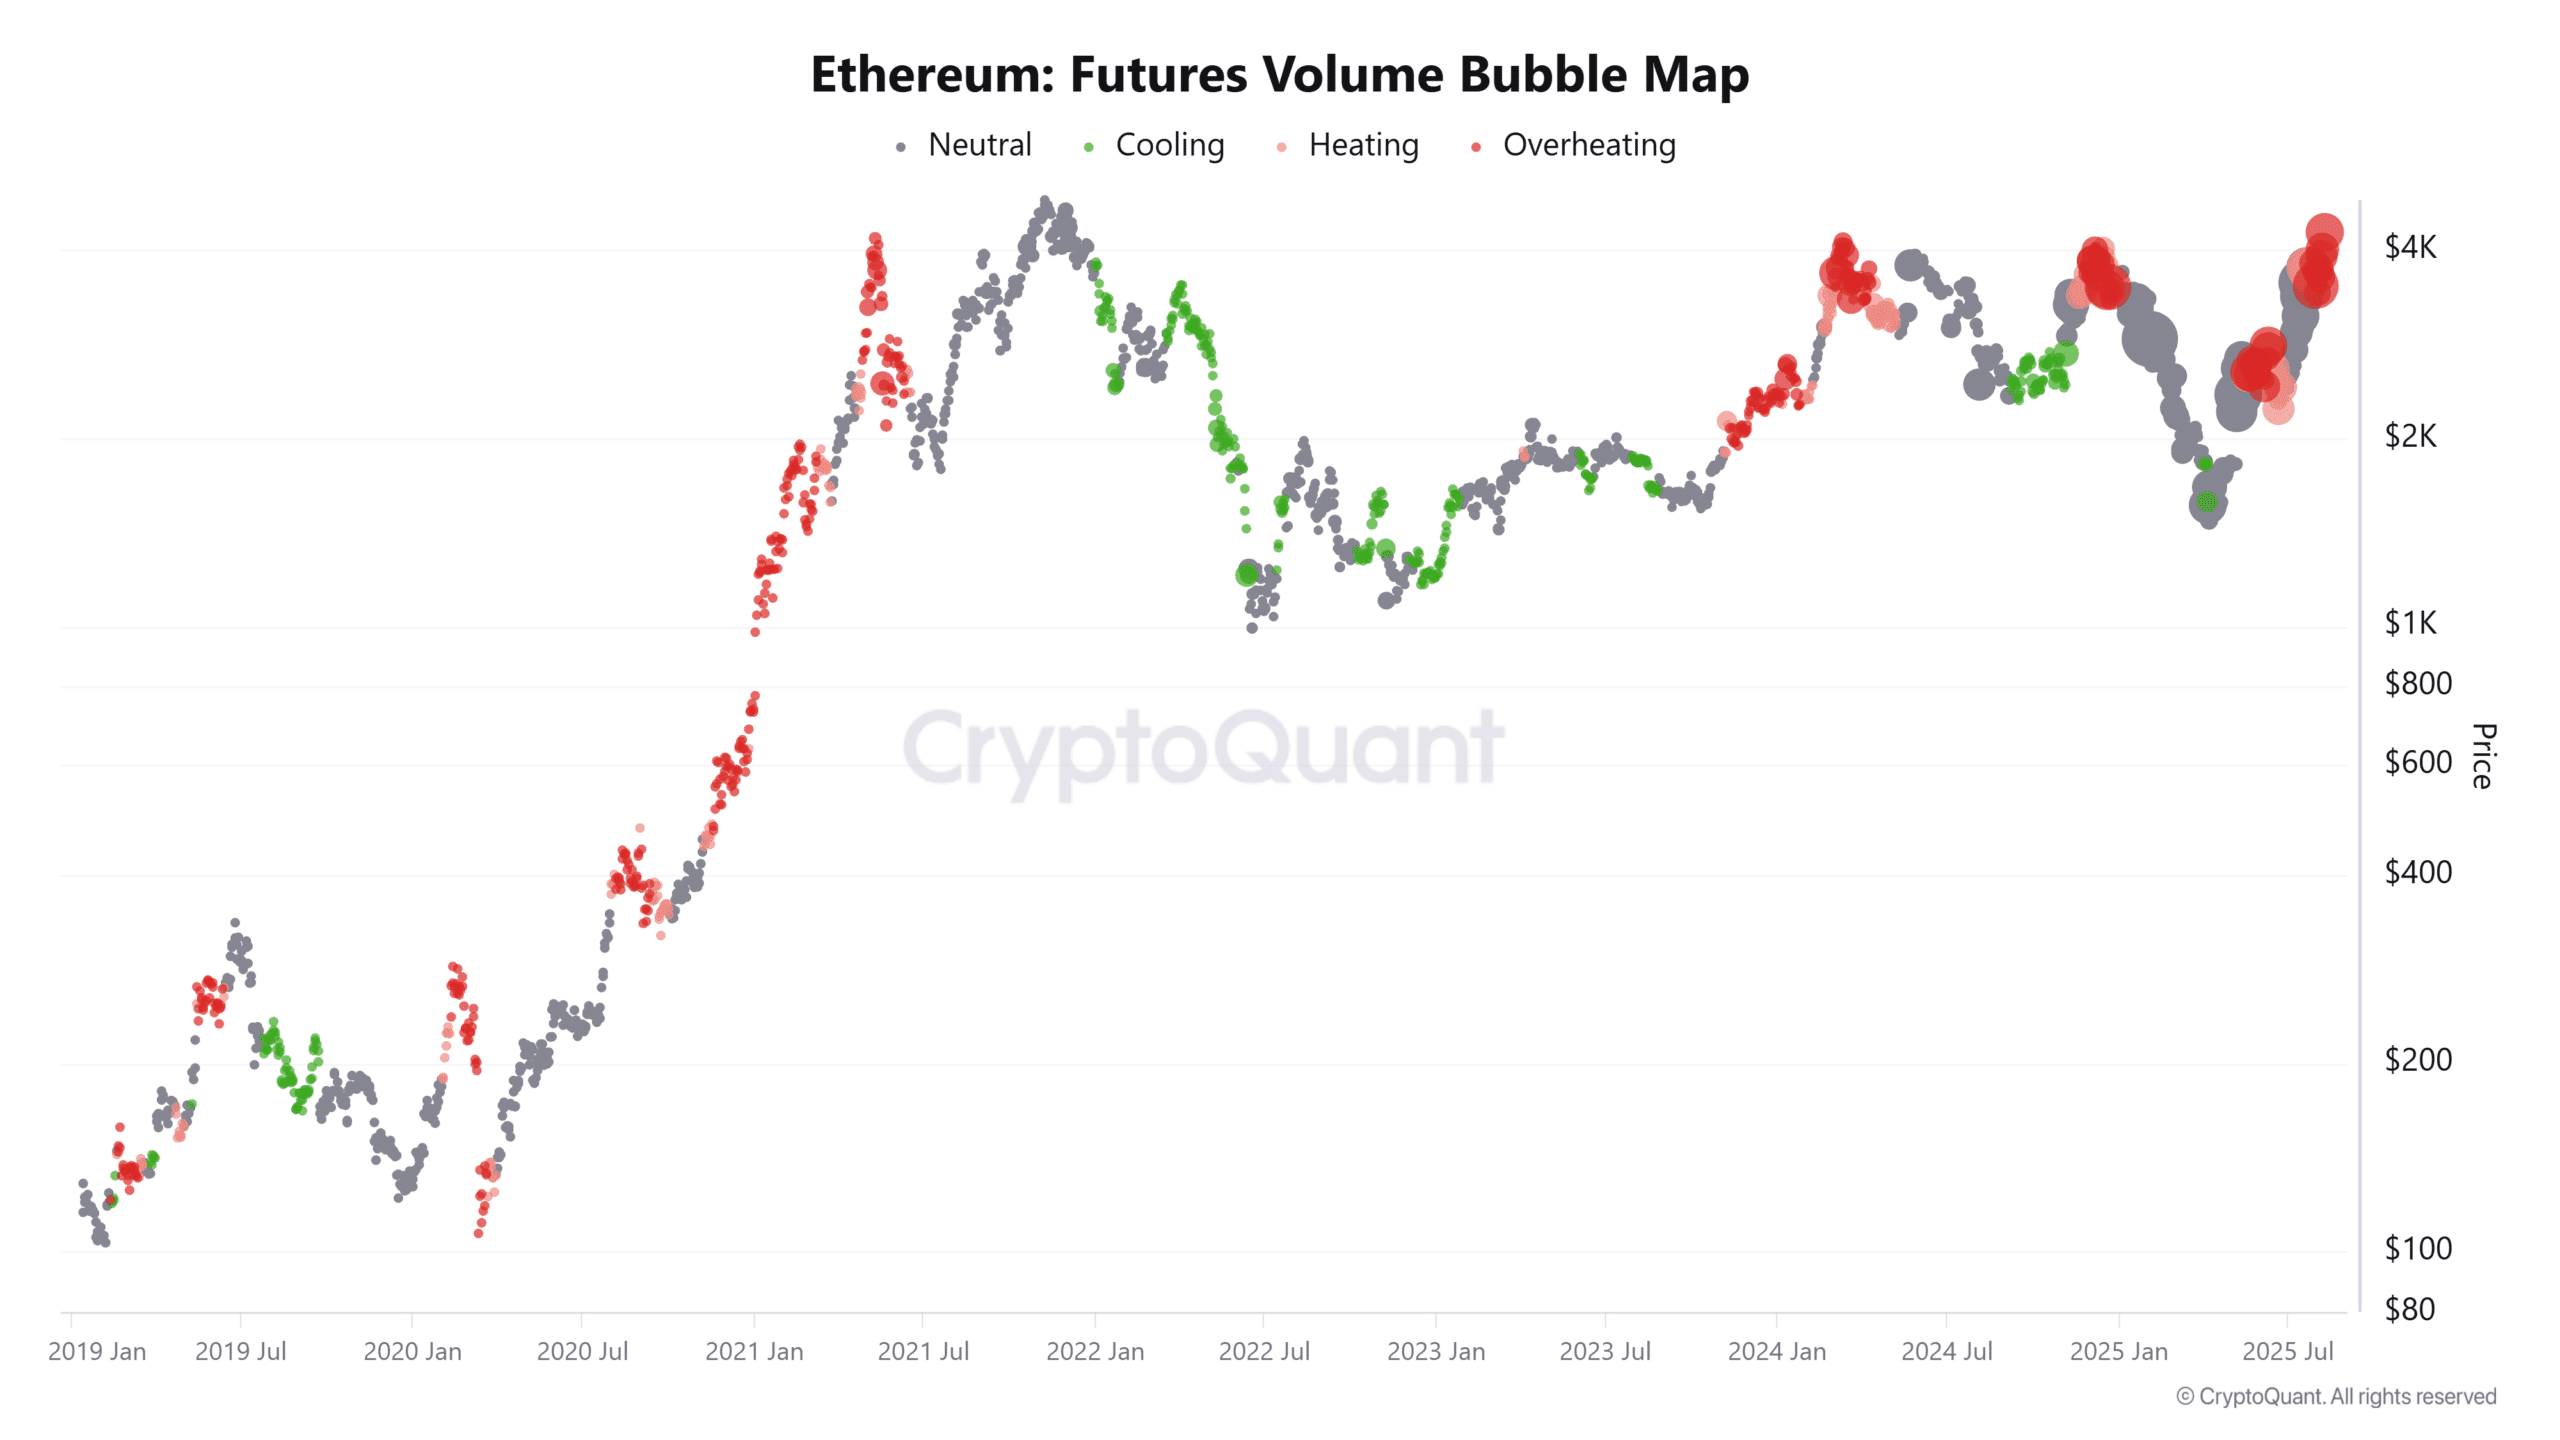
Due to the increasing leverage positions in recent trading days, futures trading volume data indicates that the market is 'overheated'.
Now, while leverage can accelerate bullish trends, it can also easily trigger significant liquidations if market sentiment reverses.
Historically, an overheated derivatives market often leads to rapid pullbacks, especially when approaching strong resistance levels. Therefore, the question is: Can buyers maintain control without triggering forced liquidations?
 Will whales permanently withdraw ETH from exchanges?
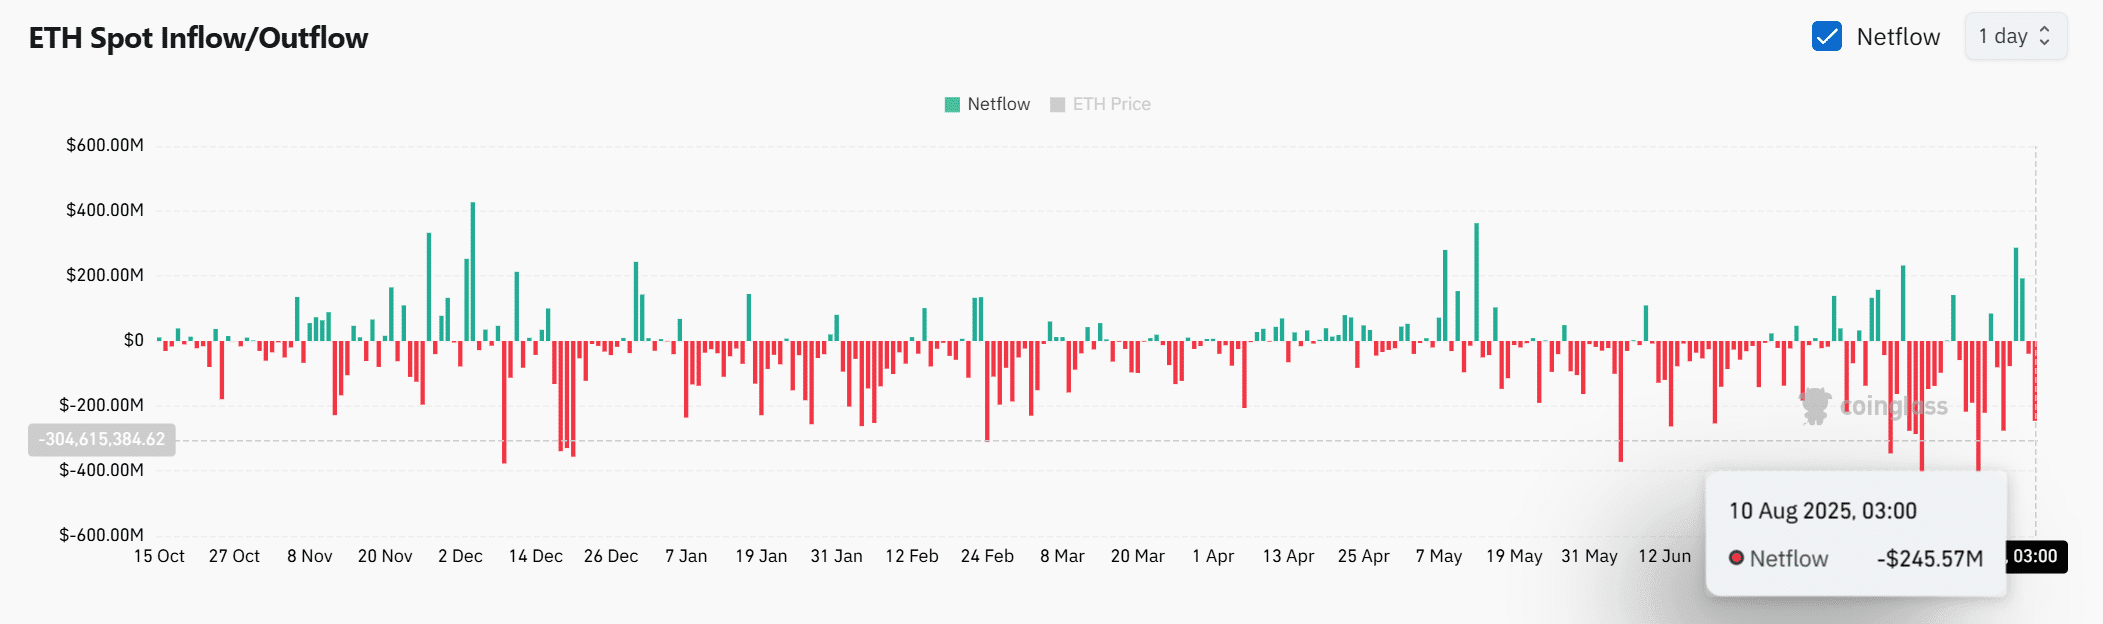
Netflow data shows that on August 10, outflows reached $245.57 million, further exacerbating the recent trend of continued withdrawals from exchanges.
This negative net flow often reflects investors moving assets into self-custody, which aligns with accumulation behavior and reduced short-term selling pressure.
However, the positive reading of the Binance ESR indicates that some traders are still transferring tokens to centralized exchanges for potential sales.
Although the long-term structure still favors further upside, the tug-of-war between accumulation willingness and selling pressure may heighten uncertainty in the short-term environment.
 Will these liquidation zones determine Ethereum's next move?
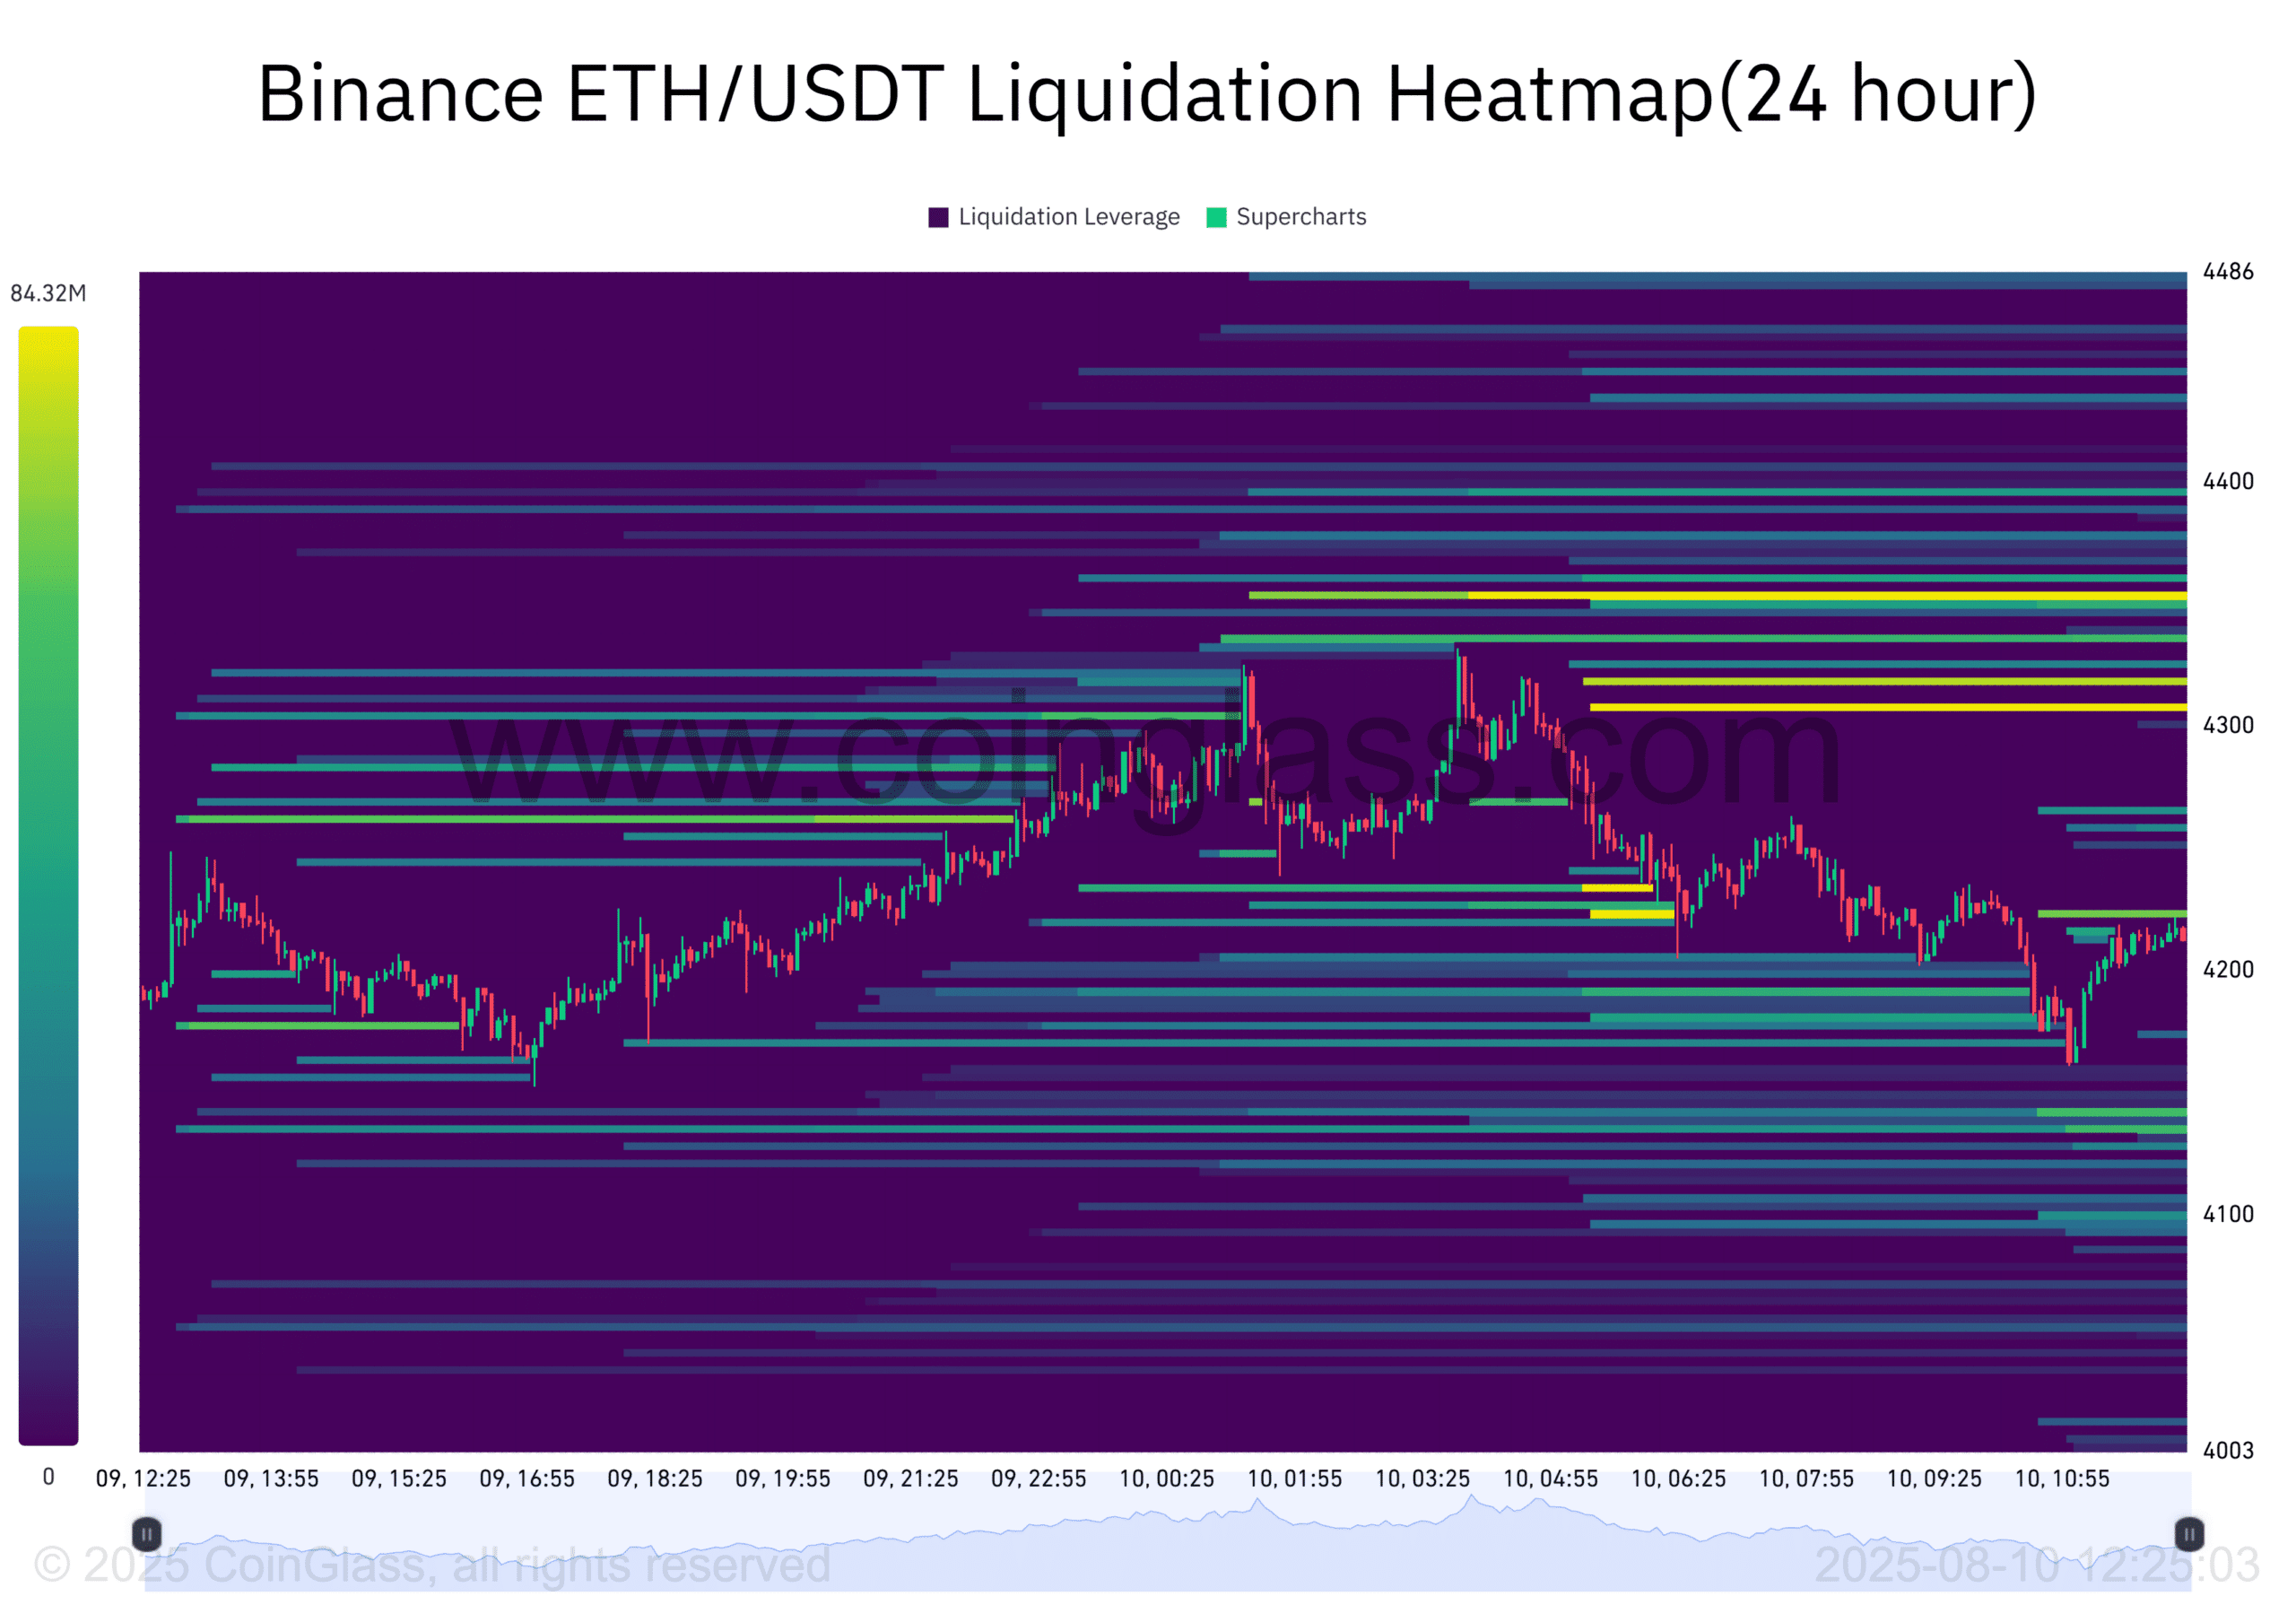
The liquidation heatmap emphasizes a dense cluster between $4,300 and $4,400—these levels could become price magnets in the short term.
A decisive breakthrough of these clusters could trigger a chain reaction of short-term liquidations, accelerating the rebound towards higher Fibonacci targets.
Conversely, if a failure occurs here, it could trigger significant selling and a pullback to the $4,000 support level. ETH's performance around these liquidity gaps may determine the next moves.
 Despite the risk of being overbought, can Ethereum break through $4,400?
Although the RSI is in overbought territory, Ethereum's structure and on-chain data appear to favor a breakout above $4,400.
Continued outflows from exchanges, declining overall exchange ESR, and strong accumulation could outweigh the risks posed by rising Binance ESR and high leverage.
If bulls maintain momentum, the price of gold could rise to $4,800. This would strengthen the bullish trajectory while limiting the short-term cooling effects caused by overheating data at the time of publication.
