Bitcoin price is correcting the gains in the $122,250 area. BTC is currently consolidating and may target the resistance level of $120,500.
Bitcoin begins to break through the $118,500 area and rises again.
Trading price is above $118,000 and the 100-hour simple moving average.
On the hourly chart of the BTC/USD pair, it broke below the key bullish trend line, with support at $119,500 (data from Kraken).
If it breaks through the resistance area of $120,500, this currency pair may start to rise again.
Bitcoin price is expected to rise again.
Bitcoin price finds support near $115,500 and begins a new round of upward movement. BTC successfully breaks through the resistance levels of $117,500 and $118,800.
The price even broke through the resistance level of $120,500 and entered the bullish zone. Eventually, the price tested the resistance level of $122,250. The price formed a high at $122,273 and recently retraced some gains. After that, the price fell below the $120,500 level.
The price fell below the 50% Fibonacci retracement level of the upward trend from the low of $116,282 to the high of $122,273. In addition, on the BTC/USD hourly chart, the price broke below the crucial bullish trend line, with support at $119,500.
Bitcoin is currently trading above $118,000 and the 100-hour simple moving average. The immediate resistance level on the upside is around $119,250. The first key resistance level is around $120,500.
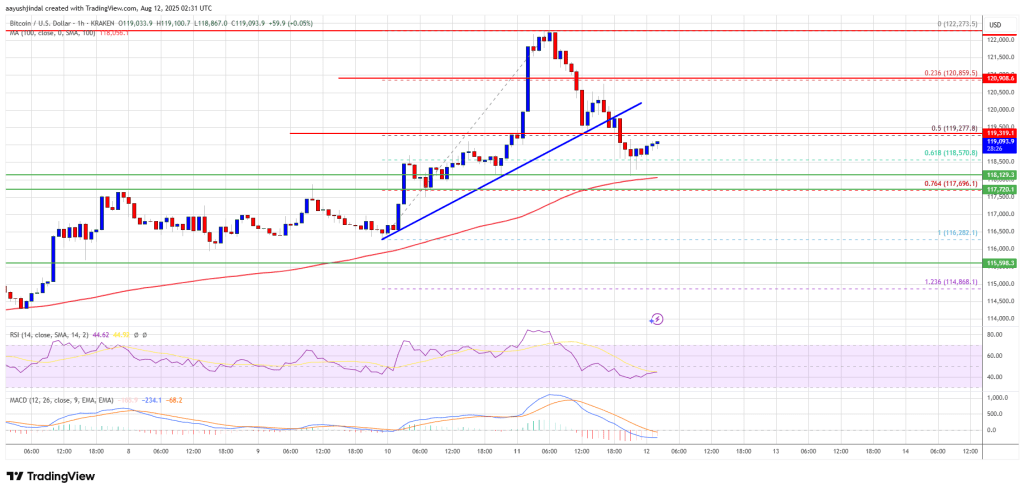 The next resistance level may be $121,250. If the closing price breaks through the resistance level of $121,250, it may further drive up the price. In this case, the price may rise and test the resistance level of $123,200. If it continues to rise, the price could approach $124,000. The main target level may be $125,000.
BTC loss more?
If Bitcoin fails to break through the resistance level of $120,500, it may decline again. Immediate support is near $118,200. The first major support level is around $117,800.
Currently, the next support level is near $116,550. If the price falls further, it may drop towards the support level of $115,500 in the short term. The main support level is at $113,500, and if this support level is broken, BTC may continue to fall.
Technical indicators:
Hourly MACD - The MACD is currently losing momentum within the bullish zone.
Hourly RSI (Relative Strength Index) - The RSI for BTC/USD is currently below the 50 level.
Major support level - $118,200, followed by $116,550.
Major resistance levels - $119,250 and $120,500.

