🔔 BNB INTRADAY BUY ALERT! (1-Hour Chart) 🔔
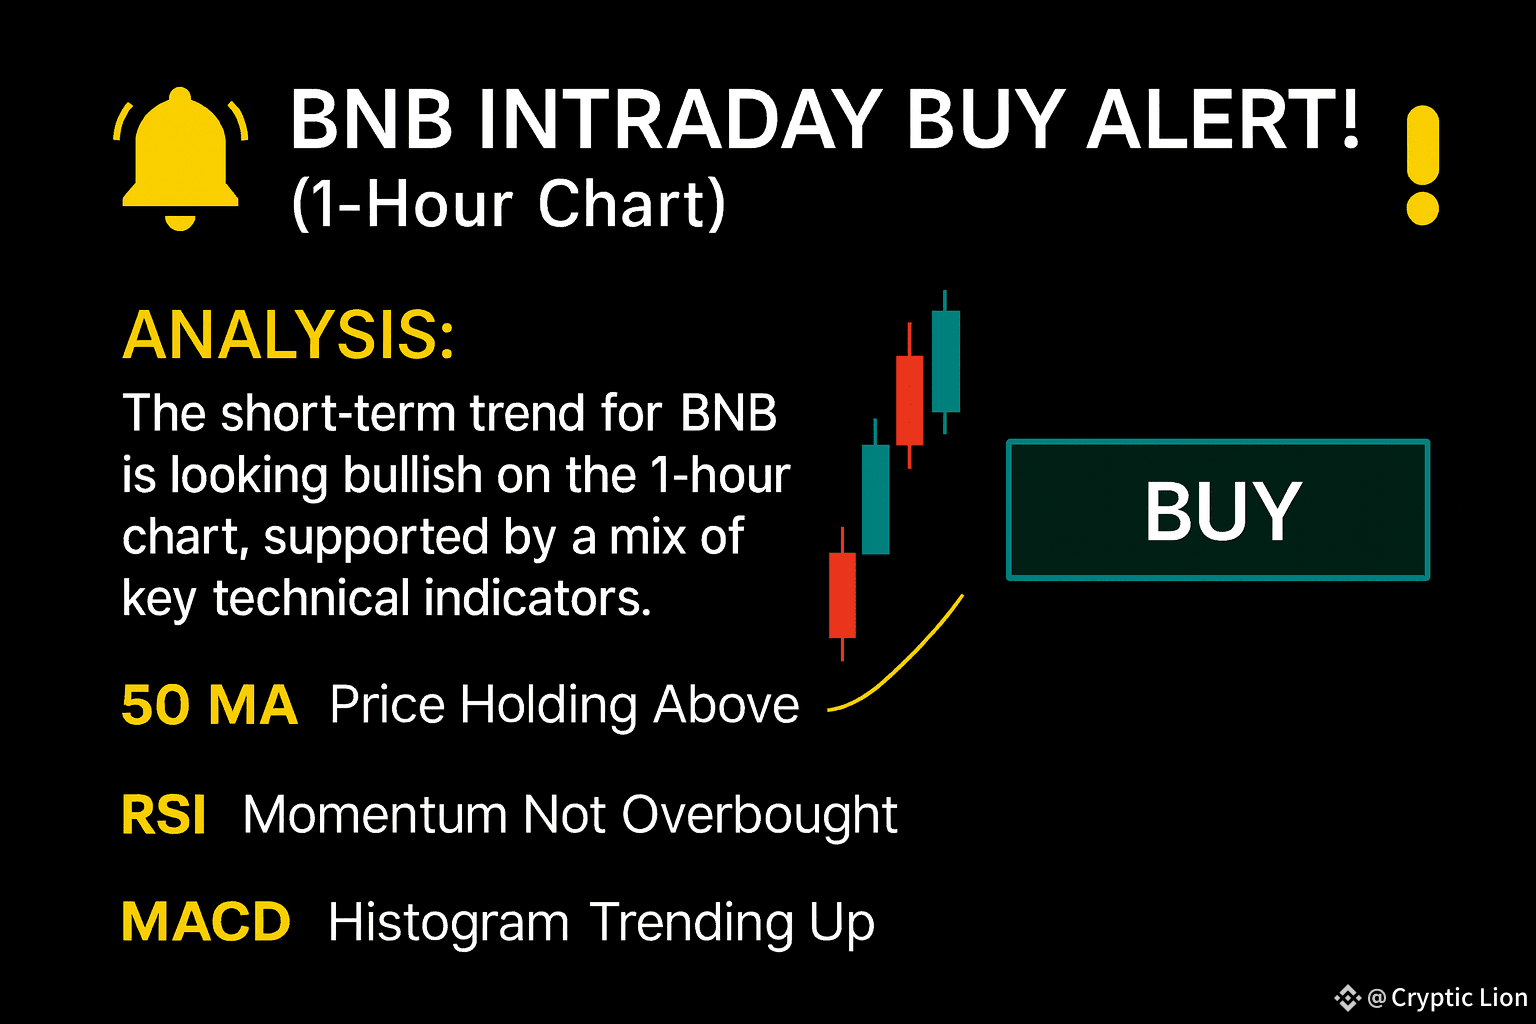
The short-term trend for BNB is looking bullish on the 1-hour chart, supported by a mix of key technical indicators. The price is currently holding above the 50-period Moving Average (MA), a key sign of short-term strength. The Relative Strength Index (RSI) is also showing that momentum is in favor of the bulls without being in the "overbought" territory, giving it room to run. Furthermore, the Moving Average Convergence Divergence (MACD) histogram is trending upwards, which signals increasing bullish momentum. This combination of indicators suggests a high probability of a continued upward push in the near term.
Buy Signals & Entry Points:
Optimal Entry: A conservative and high-probability entry would be on a retest of the $780-$790 support zone. This is a level where the 50-period MA is likely to act as a dynamic support, offering a good risk-to-reward ratio.
Aggressive Entry: For traders who want to capitalize on immediate momentum, a small position can be entered at the current market price (around $800-$810), with the intention of adding more if the price pulls back to the optimal entry zone.
Confirmation Signal: A confirmed buy signal is when the MACD line crosses above the signal line on the 1-hour chart, or when the price convincingly breaks above the previous high on a surge in volume.
Take Profit Levels:
TP1: $825. This is the first major resistance level on the 1-hour chart. A test of this level is the initial target for a quick, profitable trade.
TP2: $845. This is a more significant resistance zone, which coincides with the all-time high. Taking partial profits here is a smart move to secure gains.
TP3: $860+. This is a more ambitious target and would require sustained bullish momentum and a breakout above the previous all-time high. A trailing stop-loss is recommended to ride this move.
Sell Signals & Caution:
Invalidation Signal: A strong sell signal would be a decisive break below the $765 support level on the 1-hour chart, particularly if accompanied by a surge in selling volume. This would invalidate the current bullish structure and indicate a potential trend reversal.
Set a Stop-Loss: A tight stop-loss is crucial for intraday trading. Place your stop-loss just below the key support, at $765, to protect your capital.
RSI Divergence: Be cautious if you notice a bearish divergence on the RSI. This occurs when the price makes a higher high, but the RSI makes a lower high. This can be an early warning of a potential trend reversal.
Disclaimer: This is not financial advice. The crypto market is highly volatile, and intraday trading carries significant risk. Always do your own research (DYOR) and manage your risk accordingly.