In the crypto space, the best way for an average person to improve is: learning + practice!
1: Learn basic operational logic + imitate the methods and techniques of successful people!
2: Practice theory with small funds, summarize experiences through review
A must-read for crypto beginners, refuse to play around!
Proven method: In 30 days, I earned 60,000 USD from an initial 1,000 USD! Using the following method: (Four-step trading method, even small funds can make profits)
Snowballing)
From over 3000 USD to a ten-million-level capital scale, from an ordinary trader to the market's focus known as the 'owl', this is a story about navigating through bull and bear markets and breaking through by leveraging advantages.
From March to June 2024, AI, Meme, and inscription tracks collectively exploded, and during this round of market, he paid off all his debts and achieved a leap in capital. But what is truly worth studying is not just how much money he made but how he was able to earn it.
1. The leap from 'thousands' to 'millions' is a systematic breakthrough
The starting point is not high; the first BCH trade was just over 3000 USD. But he is not a gambler who became rich overnight; he took a full five years:
The first four years were continuous losses, honing the fundamentals;
From the fifth year, momentum builds, trading logic takes shape, and psychological barriers are broken;
Treat each market cycle as a trial ground, not a lifeline.
He relies on systematic growth rather than a sudden stroke of fortune.
It has also undergone three core phases:
1. Ability breakthrough period: gradually establishing a profitable model through event trading, intraday trends, and emotional games;
2. Trend-following period: 2024's second spring for inscriptions, AI explosion, Meme rotation, identifying opportunities to 'all in';
3. Psychological breakthrough period: from fearing losses and being hesitant to act, to decisively taking action and daring to heavily invest; this psychological transformation is the real watershed.
2. How does he assess market sentiment?
"I don't trade based on indicators; I trade based on logic."
The owl collects emotions in a multi-dimensional way:
Charts + market cap data to assess whether there is extreme turnover;
Macro event tracking, especially the linkage between the crypto space and external hot topics (like Elon Musk and Tesla events);
Observe KOL sentiment and FOMO performance to judge whether 'the crowd is chasing or selling off.'
For example, when the bearish sentiment of Doge exploded, he chose to heavily buy Ethereum; when the market missed the big rise of Ethereum, he seized the opportunity of the hippo project to catch up, earning millions in one round of operations.
3. The judgment logic of buying a coin
Market capitalization scale (e.g., 45K~120 million market cap represents medium-sized altcoins)
Timing position: Ethereum rises for three days, Meme has not yet launched
Emotion observation: Which project has the most turnover and high participation?
Price structure: Is there a breakout from the range, combined with moving average support?
For example, the owl made nine profitable trades in the hippo project in one day. Ethereum surged over the weekend; those who missed out rushed into supplementary assets, and he captured a full doubling in price while continuing to operate in segments.
4. Positioning and profit-taking and stop-loss philosophy: it’s not about 'calculating,' it’s about 'feeling'
Positioning with a maximum of 5 times leverage, but usually more like 2-3 times, keeping within a comfortable risk area
Profit-taking and stop-loss do not have standardized indicators; they rely on structural judgment and reverse validation
When operating with large funds, the leverage is lower, exchanging space for time and time for mindset
He once used 2x leverage during the CRV founder liquidation event, going long 3 million after a 20% drop, successfully capturing the rebound.
5. Underlying logic: He does not bet on rises and falls but on 'behavior patterns.'
"I don't look at candlesticks; I look at emotional structures, time rhythms, and capital flows."
The success of the 'owl' lies in forming a set of independent judgment thinking systems:
Multi-event compound analysis: Can news continue to influence prices for 2-3 days?
Highly time-sensitive: entering a minute early or exiting a minute late can lead to drastically different results.
Emotional games: Is there consistency formed? Has it reached an extreme?
Market structure: Is it at a triple top? Are there signs of major players selling off?
For instance, in May 2024, during Ethereum's consolidation phase, he entered the hippo project solely due to the emotional logic of 'Ethereum's four consecutive bullish candlesticks + the market's hot money missing out'; later, he shorted during a triple top, repeatedly capturing full segments.
6. Compounding and rhythm are his true moats
From February 26 to July 10, 2024, he went from 20,000 to 10 million; he did not continuously over-leverage but adhered to not making major mistakes and seizing key rhythms. His win rate was only 61%, but due to strict position control and a willingness to compound, he outperformed numerous high-frequency traders.
7. Long-term thinking and trading philosophy: The first four years lay the groundwork, the fifth year leaps forward
"Many people want to earn what takes ten years in one year, but he spent four years just to stop losing."
The 'owl' is not a genius but an ordinary person whose growth is compounded by 'time + thinking + effort.' He experienced four years of steady losses but did not give up; each failure honed a new strategic framework.
His greatest underlying ability is:
Energetic, highly efficient, and able to monitor the market for long periods, responding quickly;
Strong mindset, not greedy or impatient;
Long-term thinking, treating trading as a profession rather than a tool for turning things around.
He always adheres to a belief:
Do not trade with debt.
The market is already dangerous enough; do not let life risks overlap with trading risks.
Of course, the most important thing remains technical analysis and control; below, I will share some knowledge about technical aspects that you may find interesting!
This guide will teach you how to interpret candlestick patterns and provide detailed explanations of the 12 most popular candlestick patterns that every new trader should be familiar with in daily trading. For each pattern, we will introduce identification methods, trading strategies, and important related information to help you achieve the best trading performance. You will also learn which candlestick patterns are most suitable for day trading or long-term investment.
In trading, the candlestick chart refers to a specific type of price chart that provides traders with price information of a particular asset over a specific time period. Sometimes, these candlesticks can combine to form identifiable specific patterns. When these patterns are correctly interpreted, they can help traders reduce risks, confirm trends, and make more informed trading decisions.
Additionally, since trading itself is a high-risk activity, we will introduce four simple 'trading rules' that every trader should follow to minimize potential losses and maximize returns.
Trading rules
Rule 1. If in doubt, exit
Trading is far from an exact science. Although charts, trading patterns, and technical indicators can provide you with a statistical advantage when making trading decisions, they cannot guarantee success.
Unfortunately, some trades, even if they seem perfect in setup, may not develop as you wish. In practice, as much as 40% of trades may fail. Therefore, when making mistakes, one should quickly cut losses. If you start to doubt the performance of a trade after entering, you should swiftly close the position and exit.
Rule 2. Do not look back
Admitting to oneself that they made a mistake and closing positions while at a loss is psychologically very painful. Because of this, many traders tend to prolong their holding time. They think, 'I should have closed at a certain point but didn't, so I'll wait for the price to return to that level before exiting.' This is an extremely erroneous approach.
Once you realize you've misread the direction, decisively cut your losses and do not look back. Similarly, even if you just closed a trade and the price skyrockets afterward, do not look back. Traders must make decisions based on the information available at the time. It is easy to review past trades and try to determine what should have been done, but that is a waste of time. Make decisions based on the information at hand and then let go of the past.
Rule 3. Plan ahead to avoid poor performance
Trading requires you to spend enough time analyzing potential opportunities and planning based on trading patterns. Do not attempt to trade on impulse or 'wing it'; this is a reliable path to long-term losses. If you cannot find high-probability trading opportunities the night before a trading day, then wait and see for the next day. Missing out on potential profits is always better than compensating for actual losses.
Rule 4. Ignore market noise
If you are trading based on candlestick charts, do not let economic data or financial news interfere with your judgment. Unless it is shocking news that stuns the world, it should not affect your trading decisions. For example, the Russia-Ukraine war and the Iraq-Israel war are significant news events that should affect your trading. However, a central bank official's comment on a nearly irrelevant topic should not influence your trading judgment.
Candlestick patterns
These candlestick patterns apply to all tradable instruments with publicly available historical price data— including forex, futures, stocks, and cryptocurrencies—and can be applied to any time frame.
① Dark Cloud Cover
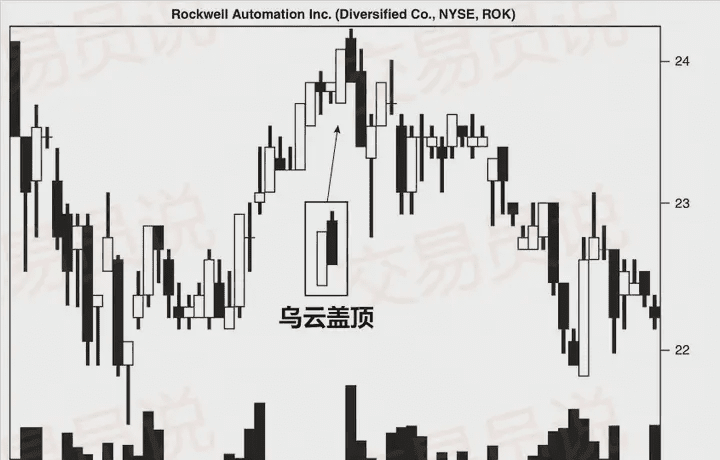 As shown in the figure above, the dark cloud cover pattern is ironically characterized by its starting point, which is usually in an upward trend where bulls continuously push the price higher. You should see a tall bullish candlestick (white candlestick), indicating that prices may continue to rise; the next day, the opening price is higher than the highest price of the previous day, creating a gap up. At this point, bears start to apply selling pressure, causing prices to fall sharply, ultimately closing near the day's lowest price, thereby forming a complete candlestick pattern.
Most traders believe that this candlestick pattern only makes sense if it appears after an upward trend. That is to say, as prices continue to rise, the reference value of this pattern in identifying trend reversals will increase. Conversely, if the price is in a consolidation or fluctuating state, the reliability of the dark cloud cover pattern will significantly decrease.
In summary, identifying the dark cloud cover pattern should meet the following five conditions:
◎ Currently in a clear upward trend
◎ A bullish candlestick appears in this upward trend
◎ A gap up occurs the next day
◎ After a gap up, a bearish candlestick is formed on the same day
◎ The closing price of the bearish candlestick is below the midpoint of the prior bullish candlestick's body
The dark cloud cover pattern usually indicates that the price may fall. Therefore, if the price continues to rise the next day, it can be reasonably judged that this pattern has failed; but if the price indeed falls, the pattern can be confirmed, and entry into trading can be considered.
Naturally, traders who recognize the dark cloud cover pattern should consider exiting all long positions promptly. For traders seeking to establish short positions, the best practice is to set a stop-loss order above the confirmed high of the bearish pattern candlestick. The confirmation candlestick refers to the bearish candlestick that validates the effectiveness of the pattern the following day.
When using the dark cloud cover pattern, it should be combined with other technical indicators to improve the probability of trading success. Many traders will incorporate the RSI when trading this pattern for auxiliary judgment. If the RSI reading is above 70, it indicates that the price is in an overbought state. Therefore, when the RSI is above 70 and accompanied by the dark cloud cover pattern, this combination signal is usually more reliable, indicating that the price is likely to fall soon.
Unlike other candlestick patterns, the dark cloud cover does not have a fixed profit target. Traders must rely on other indicators (such as RSI, moving averages, or fundamental factors) to determine when to exit for profit.
② Gravestone Doji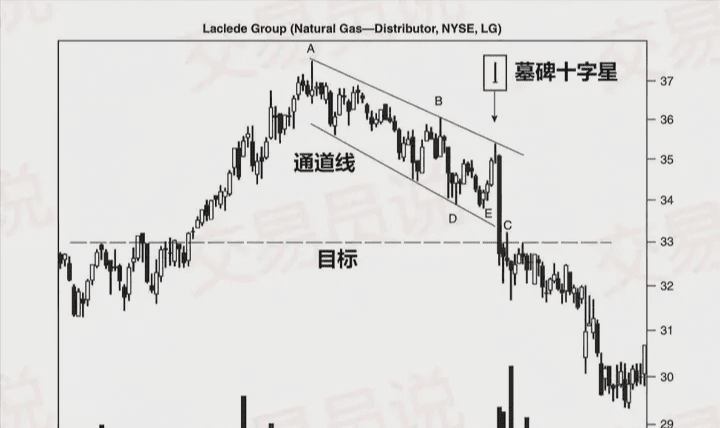 The gravestone doji name is quite fitting; it is a bearish reversal pattern indicating that the price is about to decline. Although we more commonly find the gravestone doji on assets in an upward trend, as shown in the figure above, this pattern can also appear in a downtrend, indicating that the price may further decline.
Since the gravestone doji suggests that the asset's price may soon decline, traders usually choose to exit all long positions and consider establishing short positions. Of course, just like identifying other candlestick patterns, it is best to confirm the signal's validity with other technical indicators. For the gravestone doji, 'volume' is a key confirming indicator.
Since the gravestone doji suggests that the price of the asset may soon decline, traders usually choose to exit all long positions and consider establishing short positions. Of course, just like identifying other candlestick patterns, it is best to confirm the signal's validity with other technical indicators. For the gravestone doji, 'volume' is a key confirming indicator.
As shown in the figure, shortly after the gravestone doji forms, trading volume significantly increases. This surge in volume indicates imminent selling pressure, ultimately pushing the price down. For traders trading this pattern, entering a short position as soon as the pattern appears is a wise move. Conversely, a reasonable stop-loss position is slightly above the lowest price of the previous trading day. For traders trading this pattern, entering a short position as soon as the pattern appears is a wise move. Conversely, a reasonable stop-loss position is slightly above the lowest price of the previous trading day.
In the gravestone doji pattern, it is challenging to set a fixed profit target. Therefore, traders must rely on their judgment and other indicators to assess when the price will bottom and when to take profits.
It is also important to note that the 'gravestone doji' is not a particularly reliable candlestick pattern. Therefore, it is recommended to use it in conjunction with other confirming indicators, such as volume, RSI, or MACD, to enhance the odds.
③ Dragonfly Doji
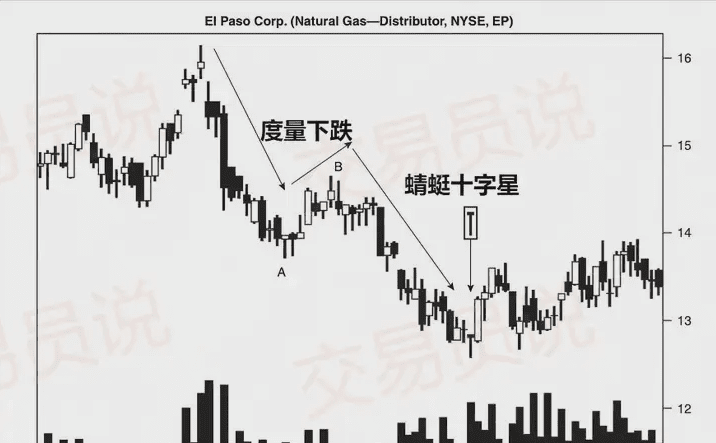 Dragonfly Doji is the exact opposite of the gravestone doji. However, similar to the gravestone doji, the formation of the dragonfly doji also requires the opening price and closing price to be at the same level.
Identifying the dragonfly doji is relatively easy due to its unique shape. This pattern usually appears on trading days when, after the opening, bears apply continuous selling pressure to push the asset price down. However, at a certain moment, bulls seize the opportunity to build positions at lower prices, pushing the price back up to near the opening price, ultimately closing at the opening price. Recall that the formation process of the gravestone doji is the exact opposite of that of the dragonfly doji.
Unfortunately, the dragonfly doji, like the gravestone doji and all other doji patterns, is not a particularly reliable candlestick signal. Therefore, it is recommended to use other technical indicators, such as volume, RSI, or MACD, to strengthen the confirmation effect of the pattern.
Similarly, when the price is in a consolidation range, the predictive power of the doji pattern is very limited. This is because the doji often requires a trend reversal to be effective; in a range-bound movement, since there is no clear trend to reverse, the doji pattern often fails to provide effective signals. The only exception is when the price is at the top or bottom of the range; in these cases, the doji may help confirm the validity of support or resistance levels.
For example: If the price of gold is in a range-bound state and is currently trading near the support line, if a dragonfly doji appears, it may indicate that the gold price is about to rise and help verify the reliability of the previously defined support line.
④ Morning Star
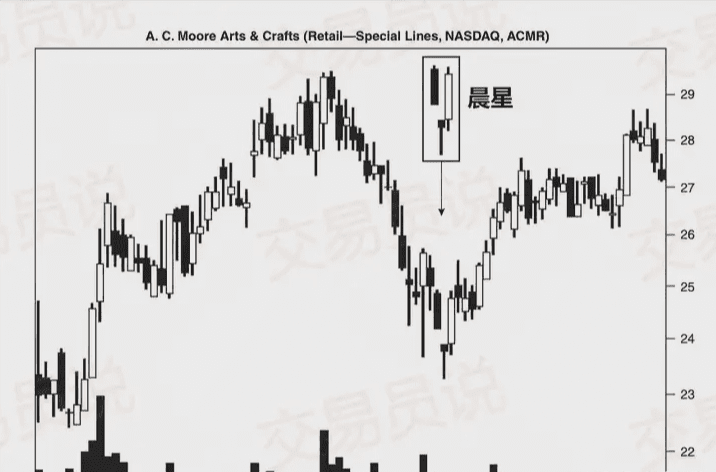 Morning Star is a bottom reversal pattern, indicating that after a period of decline, the price is expected to start rising. The name comes from Mercury's nickname 'Morning Star,' symbolizing the precursor of the sunrise.
As shown in the figure above, this pattern consists of three distinctly different candlesticks. The first is a larger black bearish candlestick, indicating that bears have complete control over the market; the second is a smaller black bearish candlestick (sometimes a doji), indicating that bearish strength is weakening and their ability to push prices down is declining; the third is a larger white bullish candlestick, recovering most of the declines of the first bearish candlestick, indicating that bulls are regaining control. You can see that these three candlesticks are labeled in the figure above.
Ideally, there should be a gap between the second and third candlesticks of the morning star pattern, but even if the gap is not significant, it does not greatly weaken the effectiveness of this pattern. The key to determining whether the morning star pattern is valid is: the third candlestick must rise strongly, recovering as much as possible of the decline caused by the first bearish candlestick.
Like other candlestick patterns, the morning star also has its limitations. The most significant limitation is that the entire pattern is not considered complete until the close of the third candlestick. Typically, by the time the third candlestick closes, the price has already shown a significant rebound, posing a challenge to traders' risk/reward ratios— in other words, by the time you enter, a large portion of potential gains may have already been consumed.
As the name suggests, since the morning star pattern indicates that the price will rise, traders should exit short positions promptly and consider establishing long positions. In this case, setting the stop-loss at the lowest point of the second candlestick is usually a more prudent approach.
However, before opening a position, it is always wise to use other technical indicators to confirm a price reversal. Since the morning star is a bullish pattern, the support line is especially useful during the confirmation process. Ideally, there should be a gradually increasing trend in volume throughout the formation of the three candlesticks, especially with the highest volume on the third day. High volume accompanying the third bullish candlestick is seen as the most reliable way to confirm the morning star pattern.
⑤ Evening Star
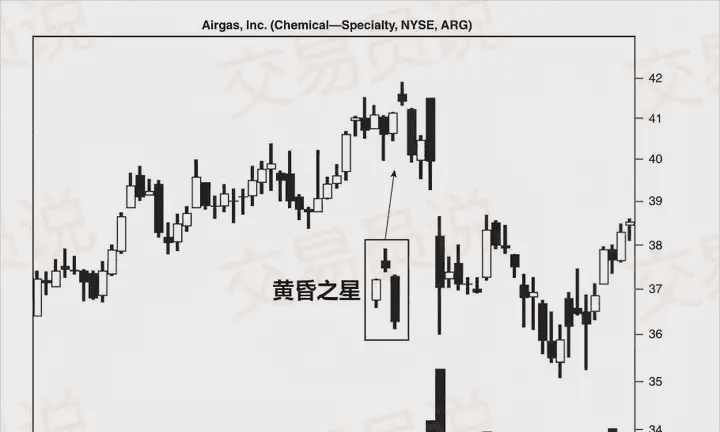 The Evening Star pattern, as the name suggests, is the 'bearish version' of the morning star. As you can see from the figure above, the name 'Evening Star' comes from the planet Venus, which appears in the sky before sunset.
The Evening Star pattern also consists of three distinct candlesticks. The first is a longer white bullish candlestick, showing strong bullish strength; followed by a smaller black bearish candlestick, which represents the 'star,' indicating that the upward momentum is waning and a top may have formed; the third is a larger black bearish candlestick, which retraces most of the gains of the first bullish candlestick, completing the entire Evening Star pattern. As you may have noticed, the formation logic of the Evening Star is the opposite of that of the Morning Star.
Ideally, there should be a gap between the second and third candlesticks of the evening star, but this gap is rarer in actual trading and is not a necessary condition for judging the effectiveness of the pattern. Although many teaching illustrations depict both the morning star and evening star with gaps, they are not always observable in practice. The key to judging whether the evening star pattern is valid is: whether the third candlestick significantly engulfs most of the gains of the first bullish candlestick.
The limitations of the evening star are the same as those of the morning star. That is to say, when the third candlestick confirms the validity of the pattern, the price has already declined significantly; from the risk/reward perspective, entering at this point may have consumed a significant portion of potential returns.
Since the evening star is a bearish pattern, resistance lines will be very valuable during the confirmation process. Similarly, the ideal volume characteristics should be: volume gradually increasing during the formation of the three candlesticks, with the highest volume on the third day. A significant volume drop on the third bearish candlestick is usually regarded as the strongest confirmation signal for the evening star pattern.
⑥ Shooting Star
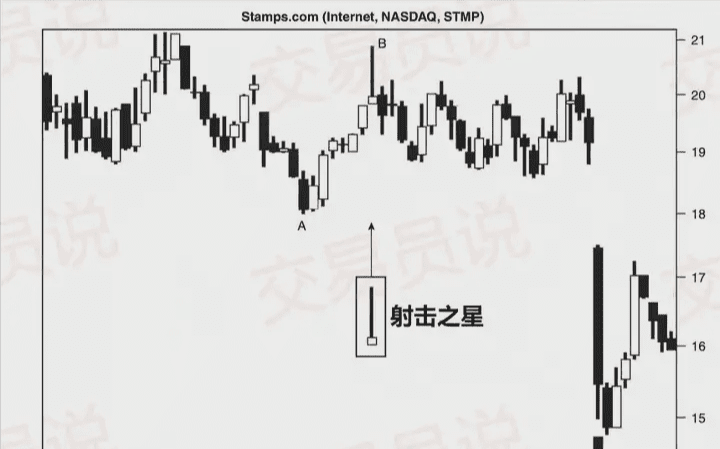 Shooting Star is a bearish reversal candlestick pattern that appears after an upward trend. As shown in the figure above, the characteristics of a shooting star include: a long upper shadow, a very small body, and a very short or almost non-existent lower shadow. The name of this pattern comes from an old Japanese proverb: "A meteor in the sky indicates bad omens."
As a bearish pattern, the shooting star must appear after a series of continuous upward movements. Its effect is most pronounced when it appears after three or more continuously rising bullish candlesticks. Of course, even if it appears after a series of bearish candlesticks, as long as the price is generally in an upward trend during that period, it can still be valid.
The formation process of the shooting star is as follows: the price rises after the opening but then encounters strong bearish selling pressure, causing the price to fall back near the opening price and ultimately forming this candlestick pattern. The longer upper shadow represents the bulls' attempt to push higher but ultimately fails; those who chased the price have fallen into losses.
An ideal shooting star should exhibit a gap between its body and the previous candlestick. You can see this in the figure above. However, like many other patterns, this gap may not always appear in practice and is not a necessary condition for forming the pattern. However, if the gap does not appear and other technical indicators do not support the pattern's effectiveness, the reliability of the pattern may be compromised.
If you remember the previously discussed gravestone doji, you will notice that the shooting star resembles it in shape. This is because the gravestone doji can be seen as a special form of the shooting star: the gravestone doji has almost no body (because the doji pattern has no body), which makes it a stronger bearish signal than the shooting star.
The main issue with the shooting star is that it is not a particularly strong bearish pattern and can only appear after a clear upward movement. This is also its most obvious limitation. In a strong upward trend, the significance of a single candlestick should not be overly magnified. Therefore, traders need to wait for the price to truly begin to decline to confirm the effectiveness of the shooting star.
Unfortunately, since the shooting star itself is not particularly strong, even if a brief decline occurs after its formation, the price may quickly rebound and continue to rise.
Therefore, by the time the pattern is truly confirmed, the ideal entry point is often missed. Traders wishing to trade the shooting star should combine other technical indicators to assess its validity and potential downward space. Indicators that help assess the subsequent trend of the shooting star include: Relative Strength Index (RSI), resistance lines, moving averages (MA), and trading volume (Volume).
Before continuing to learn the next candlestick pattern, we should also point out one thing: the shooting star looks almost identical to another candlestick pattern called the inverted hammer. The only difference is that the shooting star appears after a significant upward movement, while the inverted hammer typically appears after a significant downward movement.
⑦ Hammer
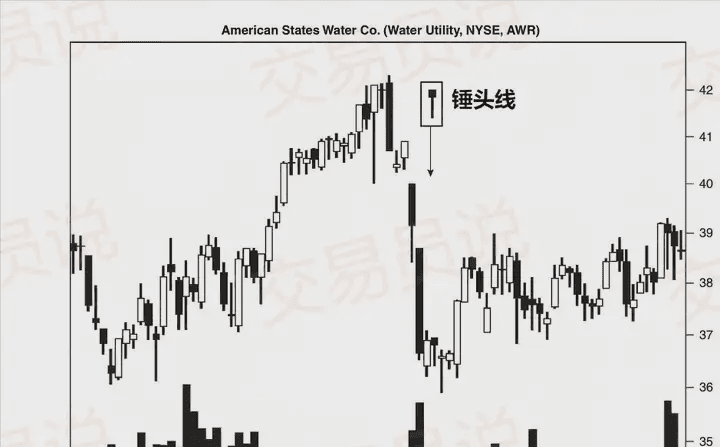 As shown in the figure, the hammer pattern is characterized by: a small body plus a long lower shadow. Although the hammer pattern is a bullish reversal pattern, its body can be either bullish (white) or bearish (black). This is because even a hammer with a bearish body can trigger strong upward movements.
However, for the average reader, we can assume that a bullish candlestick's hammer pattern typically represents a stronger reversal signal, while a bearish candlestick represents a relatively weaker reversal signal. That said, in my personal experience, the color of the hammer's body has no substantial impact on the effectiveness of its pattern.
The key criteria for identifying the hammer pattern are the length of the shadows. The lower shadow (also known as the 'wick' or 'tail') should be at least two to three times the length of the body to qualify as a hammer. Now let’s take a look at how this is represented in actual charts.
As shown in the figure, two potential hammer patterns appear here. However, the lower shadow of the first hammer is too short, failing to meet the pattern requirements, thus it cannot be recognized as a hammer. In comparison, the lower shadow of the second candlestick is particularly long, exceeding the standard of two to three times its body, which is key to forming a valid hammer.
The importance of candlestick length lies in the fact that it indicates the market's attempt to significantly push down prices but ultimately fails. The bulls' buying interest pulls the price back near the opening price (forming the body of the hammer). The Japanese refer to this movement as a bullish 'kamikaze reversal.' The failure of the market to push prices further down indicates a potential upcoming reversal.
This reversal signal (and the hammer itself) needs to be confirmed when the next day's trading continues to rise. If the price continues to rise the next day, then the hammer pattern is considered confirmed, and traders can consider entering.
However, if the market turns to a downward trend again, always remember trading rules 1 and 2: either do not enter or quickly cut losses. Remember, missing out on some profit is better than using profits to cover losses.
Like the shooting star pattern, the hammer also has a very similar 'relative'—the hanging man. The only difference between the two is that the hammer appears at the end of a downtrend as a bullish pattern, while the hanging man appears at the end of an uptrend as a bearish pattern.
⑧ Bearish Harami
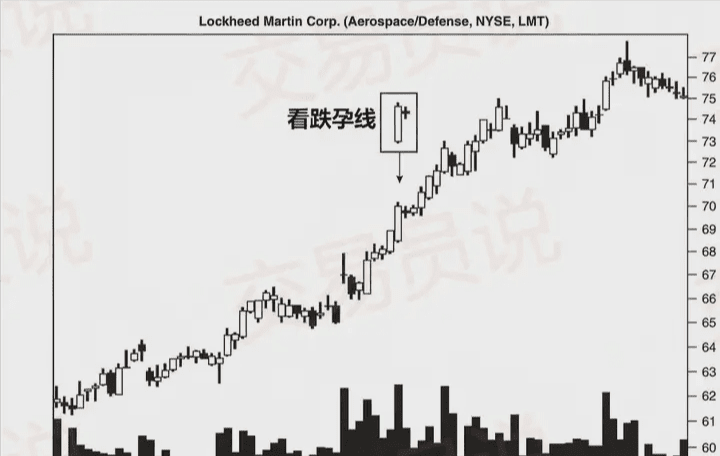 Bearish Harami is a pattern made up of two candlesticks, indicating that the price of an asset may soon turn into a downtrend. However, as clearly shown in the figure above, the bearish harami is not foolproof; this pattern can also fail.
The image shows a structurally perfect bearish harami, but the price failed to turn bearish and instead continued to rise. Therefore, it is necessary to point out from the outset that the bearish harami is a particularly unreliable pattern, with a relatively high failure rate. Therefore, traders should be especially cautious when trading based on this pattern.
Identifying the bearish harami is actually relatively simple. This pattern consists of a long bullish candlestick (white) as the main candlestick, followed closely by a smaller black bearish candlestick. The only judgment requirement is that the second black bearish candlestick must be completely engulfed within the body range of the first bullish candlestick.
The strength of the reversal is inversely correlated with the size of the second candlestick's body—the smaller the bearish candlestick, the higher the likelihood of reversal. However, it must be emphasized that no matter how small the second candlestick is, this pattern always carries the risk of failure. As shown in the figure, even when the second candlestick is clearly smaller than the first, the price still did not reverse.
Due to the instability and high failure rate of the bearish harami pattern itself, traders typically combine it with other technical indicators. Although many indicators can be used, the 200-day moving average is particularly popular when trading the bearish harami. Of course, RSI and stochastic oscillators can also be used to assist in validating the effectiveness of this pattern.
Although it is advised to set stop-loss orders in any trade, when using this pattern, it should be emphasized that stop-losses are a must. The setting of stop-loss levels depends on the trader's risk tolerance:
For traders with lower risk tolerance, it is recommended to set the stop-loss at the bottom of the second bearish candlestick after the price confirms the downward trend.
Traders with a higher risk tolerance may choose to set their stop-loss at the top of the first bullish candlestick.
⑨ Bullish Harami
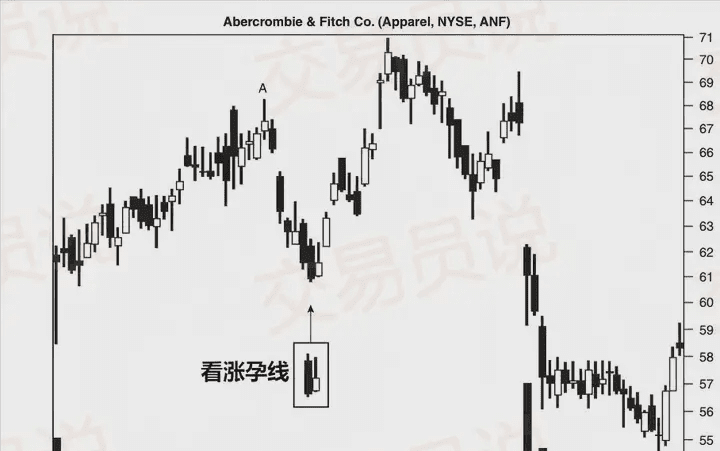 Bullish Harami is the bullish counterpart of the bearish harami pattern, indicating that the downtrend is about to reverse upwards. Like the bearish harami, the bullish harami is a two-day pattern, where the body of the first main candlestick is longer than that of the second small candlestick.
The first day of this pattern usually shows a clear bearish trend and generally occurs at the end of a downtrend. On the second day, although the bulls attempt to push the price up, the force is limited, and the closing price is still lower than the opening price of the first day. This trading behavior forms the basic structure of the bullish harami pattern. Let's take a look at how to identify this candlestick pattern.
Identifying a reliable bullish harami should pay attention to the following characteristics:
◎ The price is in a downtrend
◎ The body length of the first main candlestick is greater than that of the second small candlestick
◎ The main candlestick should be a bearish one (downward)
◎ The second small candlestick is bullish (closing price higher than opening price)
◎ The opening price of the second candlestick is higher than the closing price of the first main candlestick
◎ The closing price of the second candlestick is lower than the opening price of the first main candlestick
As shown in the figure, all the characteristics of the above-mentioned bullish harami are reflected, leading to a temporary reversal of the downtrend. The image emphasizes that while the bullish harami may correctly predict a reversal, it cannot determine how long that reversal will last. The reversal may also be short-lived, with the downtrend quickly resuming thereafter. Therefore, traders should set reasonable profit targets and strictly execute stop-loss orders.
If the price closes higher on the third day, the bullish harami pattern can be confirmed. More cautious traders often wait for the confirmation signal before entering. However, in financial markets, it is always necessary to weigh the risk/reward ratio. Since the bullish harami reversal can be short-lived, by the time you enter, you may have missed a significant portion of the gains. Therefore, traders with higher risk tolerance may choose to enter near the close of the second candlestick.
Ultimately, how to operate with such patterns depends on your personal trading goals, strategies, and risk tolerance, which is a choice you need to weigh yourself.
⑩ Bullish Engulfing pattern
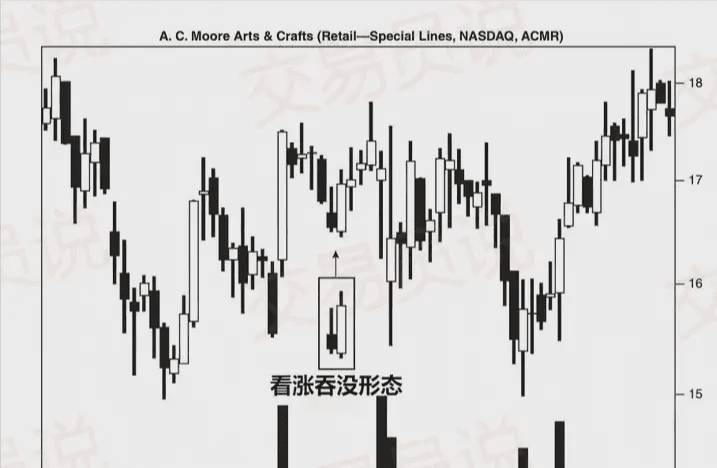 The bullish engulfing pattern is another reversal pattern made up of two candlesticks, indicating the end of the downtrend and the beginning of the uptrend. The name of this pattern comes from its structural feature: the second candlestick completely engulfs the first candlestick, exhibiting very strong bullish strength, hence called 'bullish engulfing.'
Let's take a look at how to identify potential bullish engulfing patterns.
The main features of identifying this pattern are: the first candlestick is a bearish one (downward), and the next day is followed by a larger bullish candlestick. To form a valid bullish engulfing pattern, the following conditions must be met simultaneously:
◎ The length of the shadow (upper and lower shadows) of the second candlestick must be greater than the length of the shadows of the first candlestick
◎ The highest price of the second candlestick is higher than the highest price of the first candlestick
◎ The lowest price of the second candlestick is lower than the lowest price of the first candlestick
◎ The body length of the second candlestick is greater than that of the first candlestick
As long as the above four points are all met and the pattern appears in a downtrend, it can be relatively reliably identified as a bullish engulfing pattern.
It is important to emphasize that no matter how accurately you identify this pattern, candlestick patterns are not absolutely effective. Although the bullish engulfing pattern is usually quite reliable, failures can still occur.
Generally speaking, if the price breaks below the lowest point of the first candlestick, it means that the pattern has failed. In other words, if the price continues to break below the lowest point of the first bearish candlestick, the pattern is invalid. Therefore, this low point is a good position to set a stop-loss. However, some traders with a higher risk tolerance may choose to set their stop-loss at the lowest point of the second bullish candlestick to gain more operational space in the trade.
When the price continues to rise on the third day, it means that the pattern is confirmed, and the trend reversal is established. The question is, when is the most appropriate time to enter? More cautious traders often choose to wait for the confirmation signal on the third day before entering, but this inevitably sacrifices some potential profits.
Meanwhile, risk-seeking traders may choose to enter early near the close of the second bullish candlestick. For such traders with a higher risk tolerance, it is recommended to closely monitor trading volume near the close of the following day. If the volume increases along with the price rise, it is safer to believe that market sentiment has changed, and the next trading day will confirm the pattern.
Although the bullish engulfing pattern is a strong reversal signal, it also has limitations. First, the second candlestick is sometimes very large, which means that traders setting their stop-loss at the lowest point of the second bullish candlestick may assume higher risks. Secondly, this pattern does not provide a clear profit target, making it difficult to determine a reasonable take-profit point. Traders need to combine other technical indicators or methods to set reasonable profit targets.
⑪ Bearish Engulfing pattern
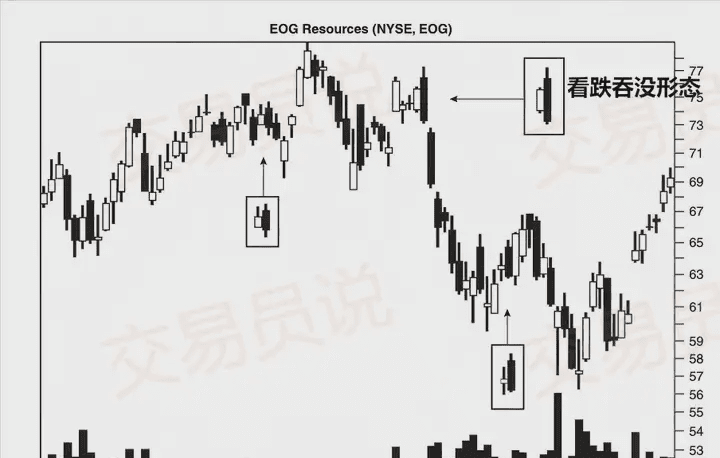 As the name suggests, the bearish engulfing pattern is the bearish counterpart of the bullish engulfing pattern mentioned earlier. It is a pattern made up of two candlesticks, signaling the end of an upward trend and the potential start of a new downward trend.
Identifying this pattern's main features includes: the first main candlestick is bullish (upward); the next day is followed by a larger bearish candlestick. When the opening price of the second bearish candlestick is noticeably higher than the closing price of the first bullish candlestick, this pattern is considered more reliable.
Moreover, the reliability of this pattern is higher when the upward trend has lasted a long time. If the price movements are fluctuating or in a consolidation phase, although bearish engulfing patterns may frequently appear, they often fail or lead to limited and short-lived price declines.
Similar to the bullish engulfing pattern, if the price continues to decline on the third day, it confirms the validity of the bearish engulfing pattern. Cautious traders will wait for this confirmation signal before entering, but doing so may sacrifice some potential profit. In contrast, traders who prefer higher risk may choose to enter near the close of the second bearish candlestick. Such traders should closely monitor changes in trading volume, as volume can reflect the reliability of this pattern.
When trading the bearish engulfing pattern, it is usually recommended to set the stop-loss order at the opening price of the second bearish candlestick. If the price rebounds to this level, it means that the bulls have regained control of the market, and the pattern may fail.
Moreover, when trading the bearish engulfing pattern and other candlestick patterns, it is particularly important to consider larger trends. For example, when an asset is in a significant upward trend, the effectiveness of the bearish engulfing pattern may be short-lived, especially in the absence of other supporting indicators.
However, if the asset starts to rebound after a significant decline and forms a bearish engulfing pattern, this could be an excellent opportunity to enter a short position.
The limitations of this pattern are similar to those of the bullish engulfing pattern. Since the second bearish candlestick may have a larger body, if traders set their stop-loss at the lowest point of the second bearish candlestick, the risk may be high. Additionally, this pattern does not provide a clear profit target, so traders need to use other tools or methods to set reasonable take-profit points.
⑫ White Three Soldiers pattern
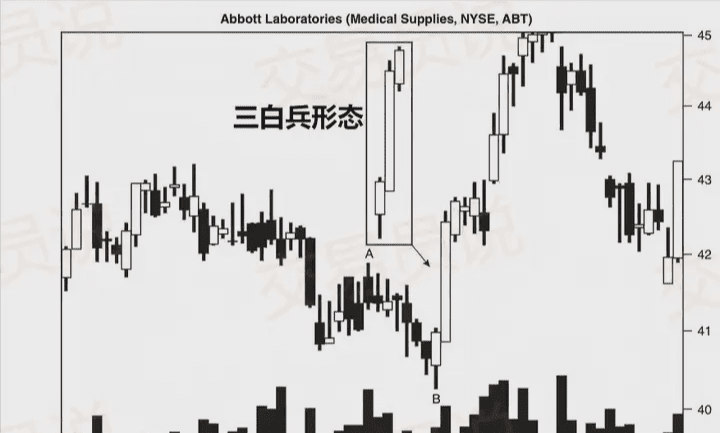
As shown in the figure above, the White Three Soldiers (AWS) pattern consists of three consecutive bullish candlesticks. Typically, when this pattern appears in a weak range near support during a price decline, it signals an imminent significant rebound.
Identifying the white three soldiers pattern is relatively simple; traders just need to observe the price closing up with three continuous bullish candlesticks during a downtrend. To conform to the AWS pattern, the opening price, highest price, lowest price, and closing price on the second day should all be higher than those on the first day, and the four prices on the third day should also be higher than those on the second day. This price movement is usually quite aggressive, signaling a strong reversal in the downtrend, dominated by bulls.
When trading the AWS pattern, note that a rapid price increase may lead to an overbought signal on the RSI indicator. Remember that after a quick surge, the price often undergoes a phase of consolidation, and only after some time does it continue to rise. Therefore, traders entering based on the AWS pattern should be prepared to wait patiently.
Like other patterns, the white three soldiers can also fail. Traders should confirm the validity of the pattern with other indicators, such as moving averages and trend lines, before opening positions.
Trading volume is a key indicator to focus on when trading the AWS pattern. If the volume during the formation of the pattern is low, it indicates that the upward momentum lacks sufficient support, and the rebound may be difficult to sustain. Generally, if the volume is low, remember the first trading rule: 'If in doubt, exit!'
If there is sufficient volume and other indicators support your judgment, it is still advisable to set a stop-loss when opening a position. For the AWS pattern, many traders prefer to set the stop-loss at the lowest price of the second bullish candlestick. Although this stop-loss position is relatively loose, due to the small pullbacks that often occur after a significant surge, leaving some stop-loss space is beneficial for the smooth execution of the trade. If the stop-loss is too strict, it may be triggered by a pullback, leading to missing subsequent profitable trends.
Now that you understand the basics of the 12 major candlestick patterns, you might be curious about how to better identify tradable patterns.
Ideally, traders should spend time analyzing the chart patterns of planned trades the night before, referring to relevant indicators, and determining stop-loss and take-profit positions before opening a position. Always remember the third rule in trading: "Plan ahead to avoid poor performance."
Candlestick charts are one of the important tools for traders to analyze price movements. Through studying this guide, you will gain a deeper understanding of market trends and the rules of price changes, thus understanding why candlestick charts are so popular in the trading field.
However, the most important point of this article is that although candlestick patterns can provide valuable references, they are not infallible. Even perfectly formed patterns can fail. Therefore, do not blindly trade any emerging patterns without validating them through other indicators or chart tools.
Be sure to assess risk and reward in every trade, set stop-losses to guard against adverse price movements, and have a comprehensive trading plan before entering.#下一任美联储主席人选 $BTC
