1️⃣ Current technical situation
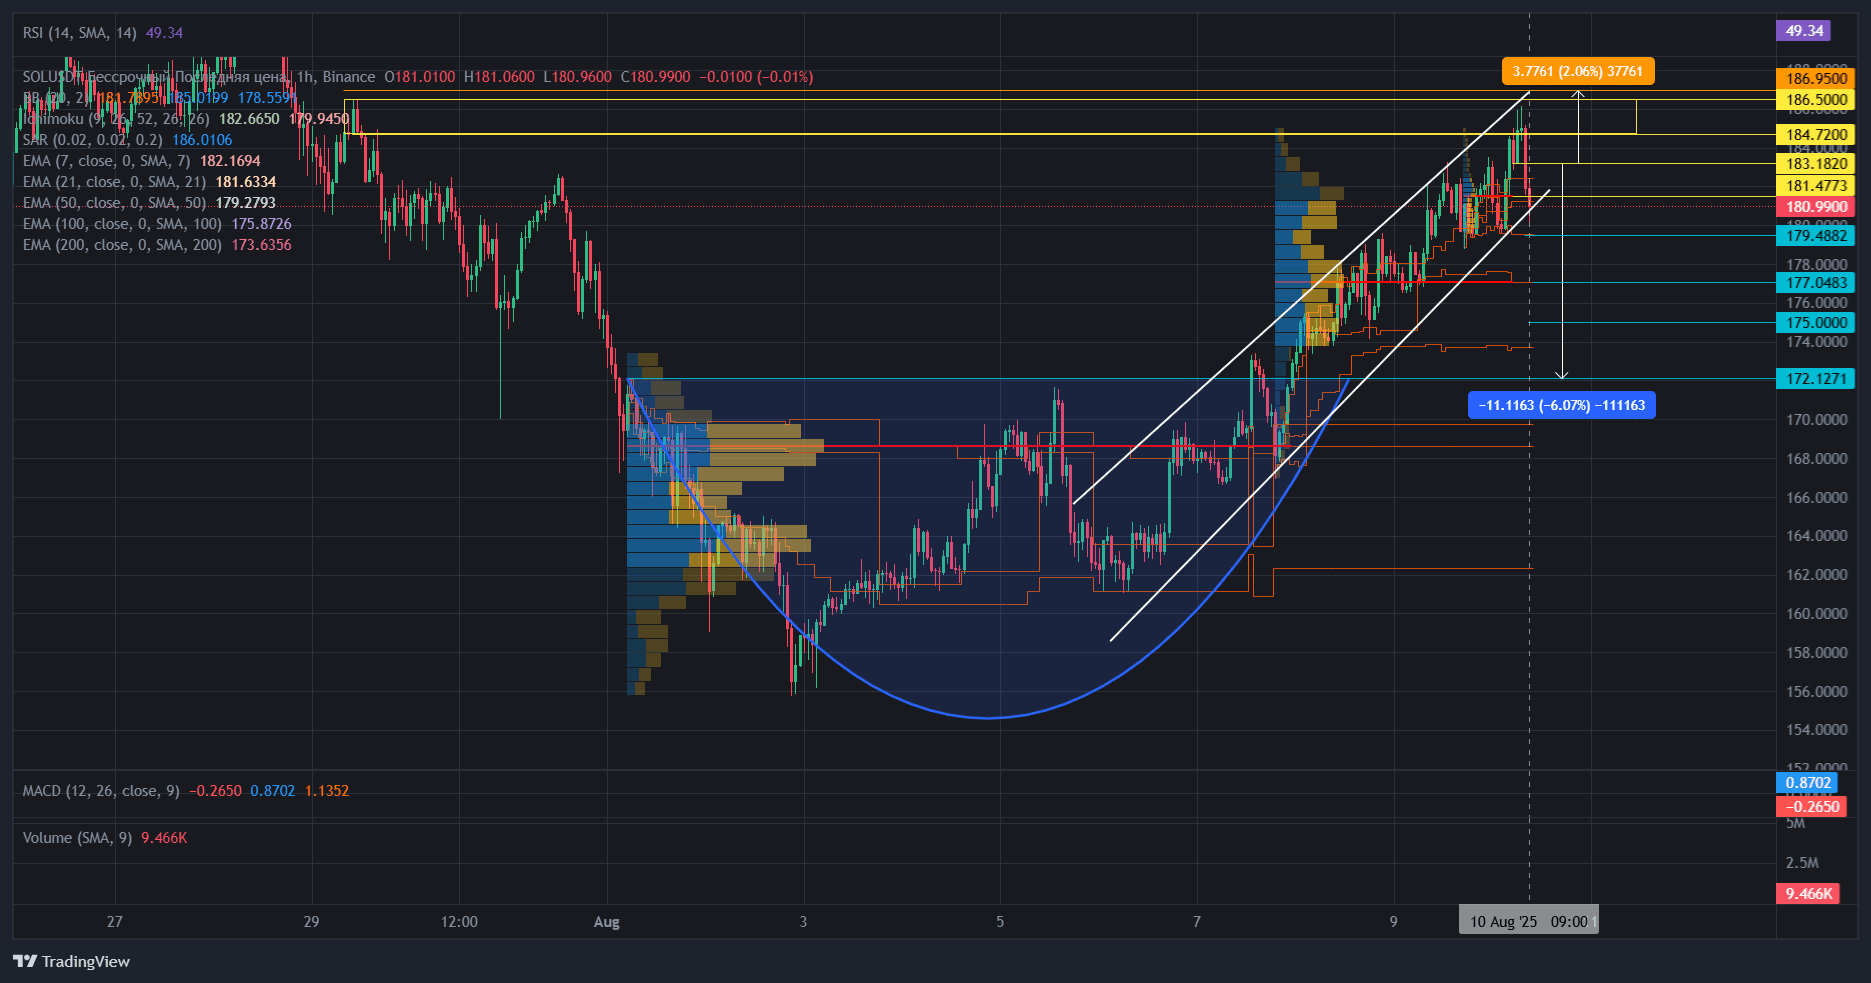
Price: 180.99, just above the key EMA50 (179.27) and EMA100 (175.87).
The white trendline (below the price) is an ascending support within a rising wedge.
Figure: "Rounded Bottom" + ascending channel → usually indicates continuation of growth, but as it approaches the upper boundary of the channel, pullbacks often occur.
Volume: volume is decreasing — this may indicate a slowdown in momentum.
SAR: 186.01 — point of potential resistance/profit fixation.
RSI: 49.34 — neutral, there is room to move.
MACD: bullish, but slowing down (the histogram is shrinking).
Bollinger Bands: price is closer to the middle line (181.78), which means there is room to the upper band (185.02).
2️⃣ Strong levels
Support: 179.48 (local level + EMA50), then 176.0 and 172.12.
Resistance: 183.18 – 184.72 – 186.50 (key fixation zone).
3️⃣ Scenario for effective entry (LONG)
Entry: 180.8 – 181.3 (bounce from the white line + EMA7/21).
Take profits:
183.18
184.72
186.50 (and partial fixation before SAR).
Stop: 179.2 (below EMA50 and the trendline).
Shoulder: 5–7x (risk is moderate since the stop is close).
RR (risk/reward): ~1:3.
4️⃣ Alternative scenario (SHORT)
Only if the white trendline breaks down and consolidates below 179.2.
Entry: 179.0
Take profits: 176.0 → 172.12.
Stop: 180.7.
Shoulder: 4–5x (the correction may be quick, but not necessarily deep).
💡 Currently, the long scenario is more effective because:
Price is above all key EMAs.
Trendline below the price.
Accumulation pattern has not yet played out completely.
RSI is not overbought.
🔥 Insights from INVESTIDEAUA: Intraday trading, LONG/SHORT strategies, SPOT, education.
🎯 I would be pleased to know that my work has not been in vain.
🎯 I would appreciate a subscription
🎯 Your support and feedback always inspire me to continue sharing quality content.
#cryptotrading #CryptoStrategy #CryptoNews #Altcoins