$BTC is holding steady on the 1-hour chart after a recent push toward $124,203, and short-term traders should be watching closely. The price is now consolidating around a key Fibonacci zone, hinting at either a breakout or a dip-buying opportunity.
📉 Buy Zones / Support:
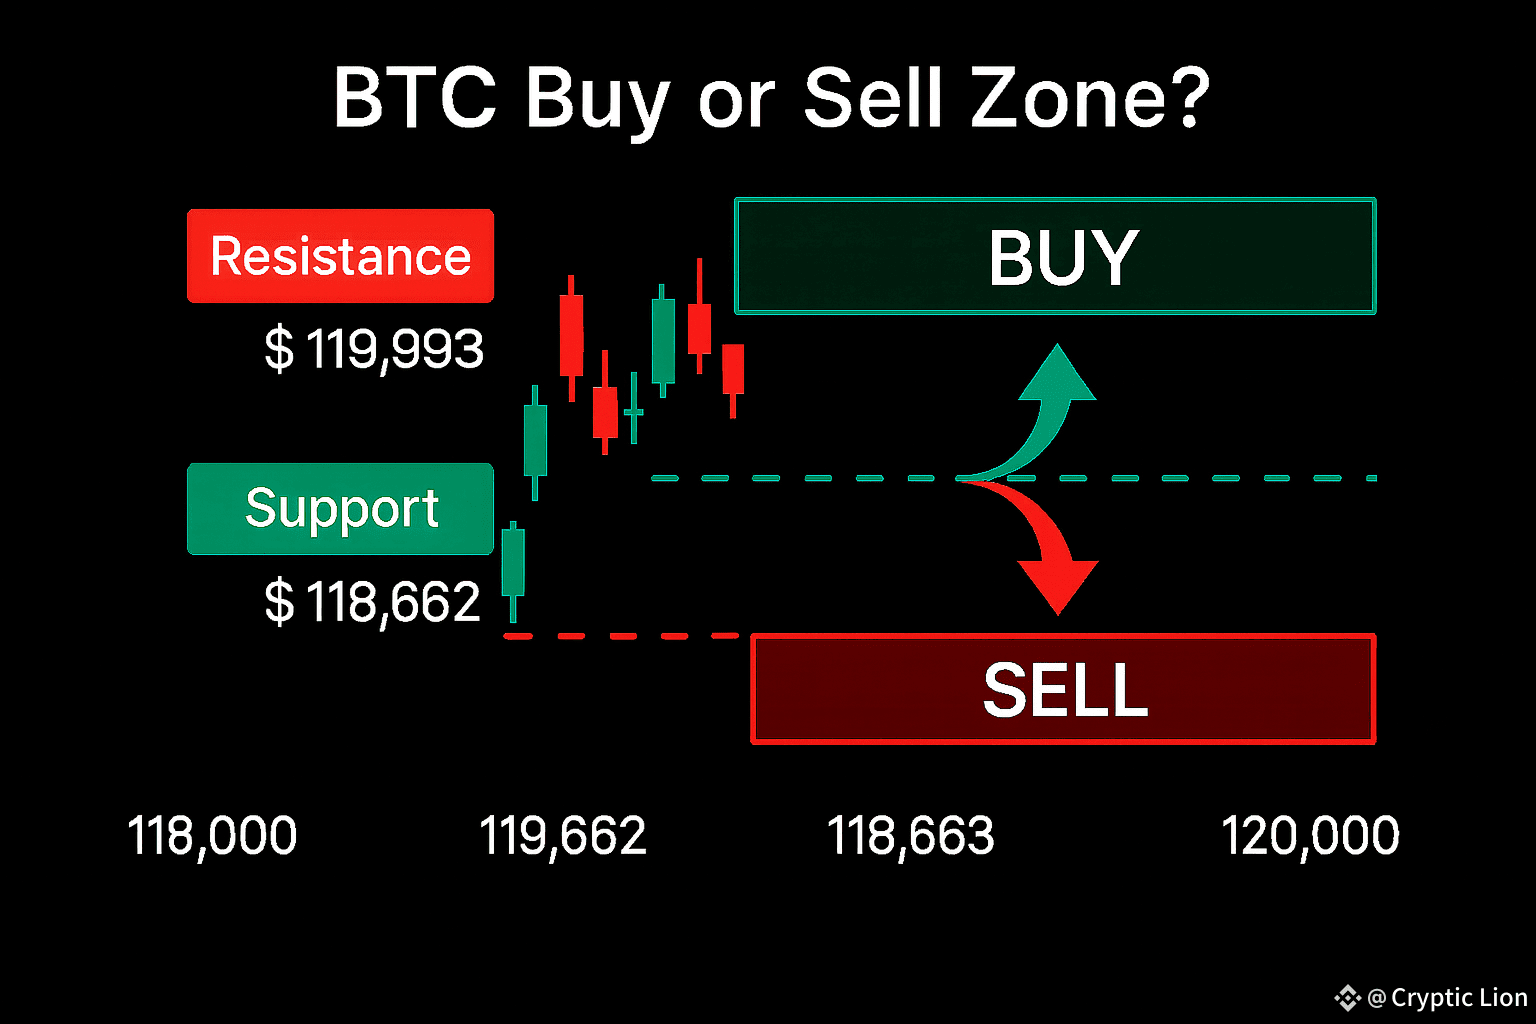
The immediate support lies between $118,650–$118,700, right at the Fib 0.5 retracement ($118,662) and close to the recent breakout base. If this zone holds, it could trigger a short-term bounce. Deeper support is around $115,684 (Fib 0.236), offering a potential bargain entry for patient traders.
📈 Sell Zones / Resistance:
The first resistance is at $119,993 (Fib 0.618) — a level where the price has faced recent rejection. A clean breakout here could open the way toward $121,889 (Fib 0.786) and potentially retest the recent high at $124,203.
💡 Trading Plan:
Aggressive traders: Consider entries near $118,650 aiming for $119,993–$121,889.
Conservative traders: Wait for a confirmed breakout above $119,993 before targeting $121,889–$124,203.
🔥 BTC is sitting at a critical decision point — will you buy the dip or ride the breakout?
Click the $BTC cashtag now and position yourself before the market decides!
Spot trading only. Manage your risk.
$BTC #bitcoin #Write2Earn