Most new traders think you need huge capital for life-changing profits. The truth? With just $680 and one powerful skill — pattern recognition — you can scale it into $40,000.
Chart patterns are the blueprint of market psychology. They reveal when to enter, where to exit, and how to ride trends. Master these 16 patterns, and every chart becomes a profit map.
---
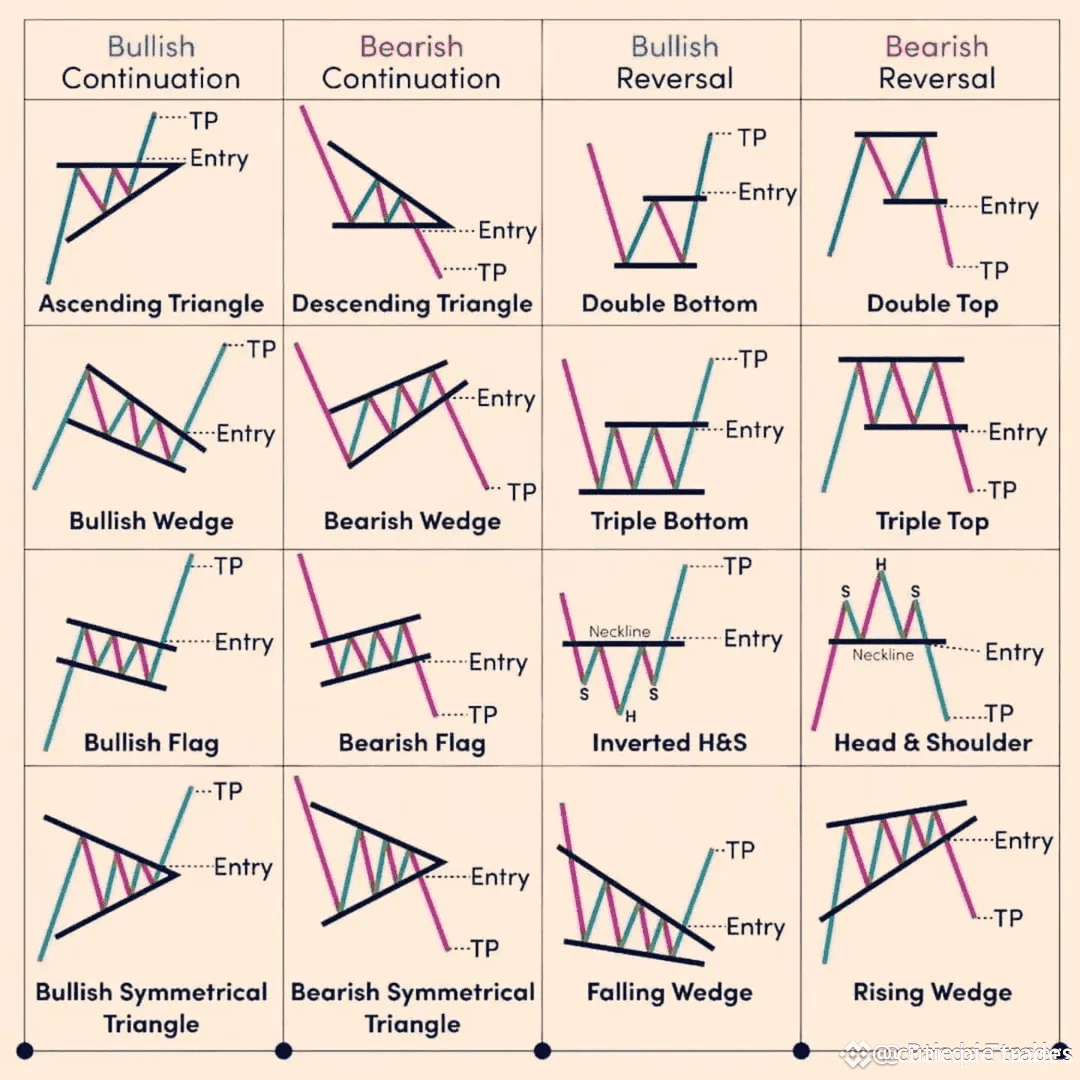
Step 1: Learn the 4 Categories of Patterns
1️⃣ Bullish Continuation 🚀
Patterns: Ascending Triangle, Bullish Wedge, Bullish Flag, Bullish Symmetrical Triangle
Meaning: Price pauses, then continues upward — perfect for joining trends early.
2️⃣ Bearish Continuation 📉
Patterns: Descending Triangle, Bearish Wedge, Bearish Flag, Bearish Symmetrical Triangle
Meaning: Price consolidates before falling further — great for short setups or exiting longs.
3️⃣ Bullish Reversal 🔄
Patterns: Double Bottom, Triple Bottom, Inverted Head & Shoulders, Falling Wedge
Meaning: Signals the end of a downtrend and start of an uptrend — ideal for catching bottoms.
4️⃣ Bearish Reversal ⚠️
Patterns: Double Top, Triple Top, Head & Shoulders, Rising Wedge
Meaning: Marks the end of an uptrend and warns of a drop — lock in profits before the fall.
---
Step 2: Build a Trading Plan Around Them
Capital Allocation: Start with $680, risk only 2–3% per trade (~$14–$20).
Leverage: Use 3–5× only on high-conviction setups (avoid overleveraging).
Entry & Exit: Enter at breakout, set Stop Loss just outside the pattern.
Take Profit: Target = height of the pattern projected from breakout point.
---
Step 3: Compound Small Wins into Big Results
Consistent small gains snowball into massive growth:
Average win: 3–5% per trade
100+ disciplined trades = $680 → $40,000+
Example Growth Path:
Trade 1: $680 → $714
Trade 10: $960 → $1,008
Trade 50: $5,200 → $5,460
Trade 100+: $40,000+
---
Step 4: Master Risk Management
Always set a Stop Loss
Never chase missed trades
Avoid trading against the market trend
---
Step 5: Practice Before Going Live
Backtest on historical charts. Learn to spot real vs. fake breakouts. Use RSI, MACD, and volume for confirmation.
---
💡 Bottom line: If you can identify these 16 patterns in real time and pair them with solid risk control, your $680 isn’t just going to grow — it can explode into a portfolio you once thought was impossible.#BinanceHODLerPROVE #ETH4500Next?