This is an EXPERIMENT to see if 3 charts (Global M2, Inverse DXY, and Gold) act as confluence, and if they can predict *when* BTC's next short term price move up will begin for BTC.
Pictured:
• Global M2 [yellow line]
• Inverse DXY [blue line]
• Gold [pink line]
Each was offset by 82 days to match the most recent price moves. This offset was chosen purely visually and for recency. It was overfitted on purpose. For a longer term view (which is not what we're looking at here) an offset of about 90 has a stronger average correlation.
I want to be very clear: this is just an attempt at guessing the next short term move based on short term confluence. This is NOT intended to give some big macro picture. This is an EXPERIMENT to see if these three charts can offer us increased odds of determining the next short term price move correctly. Let's watch and see. 🍿
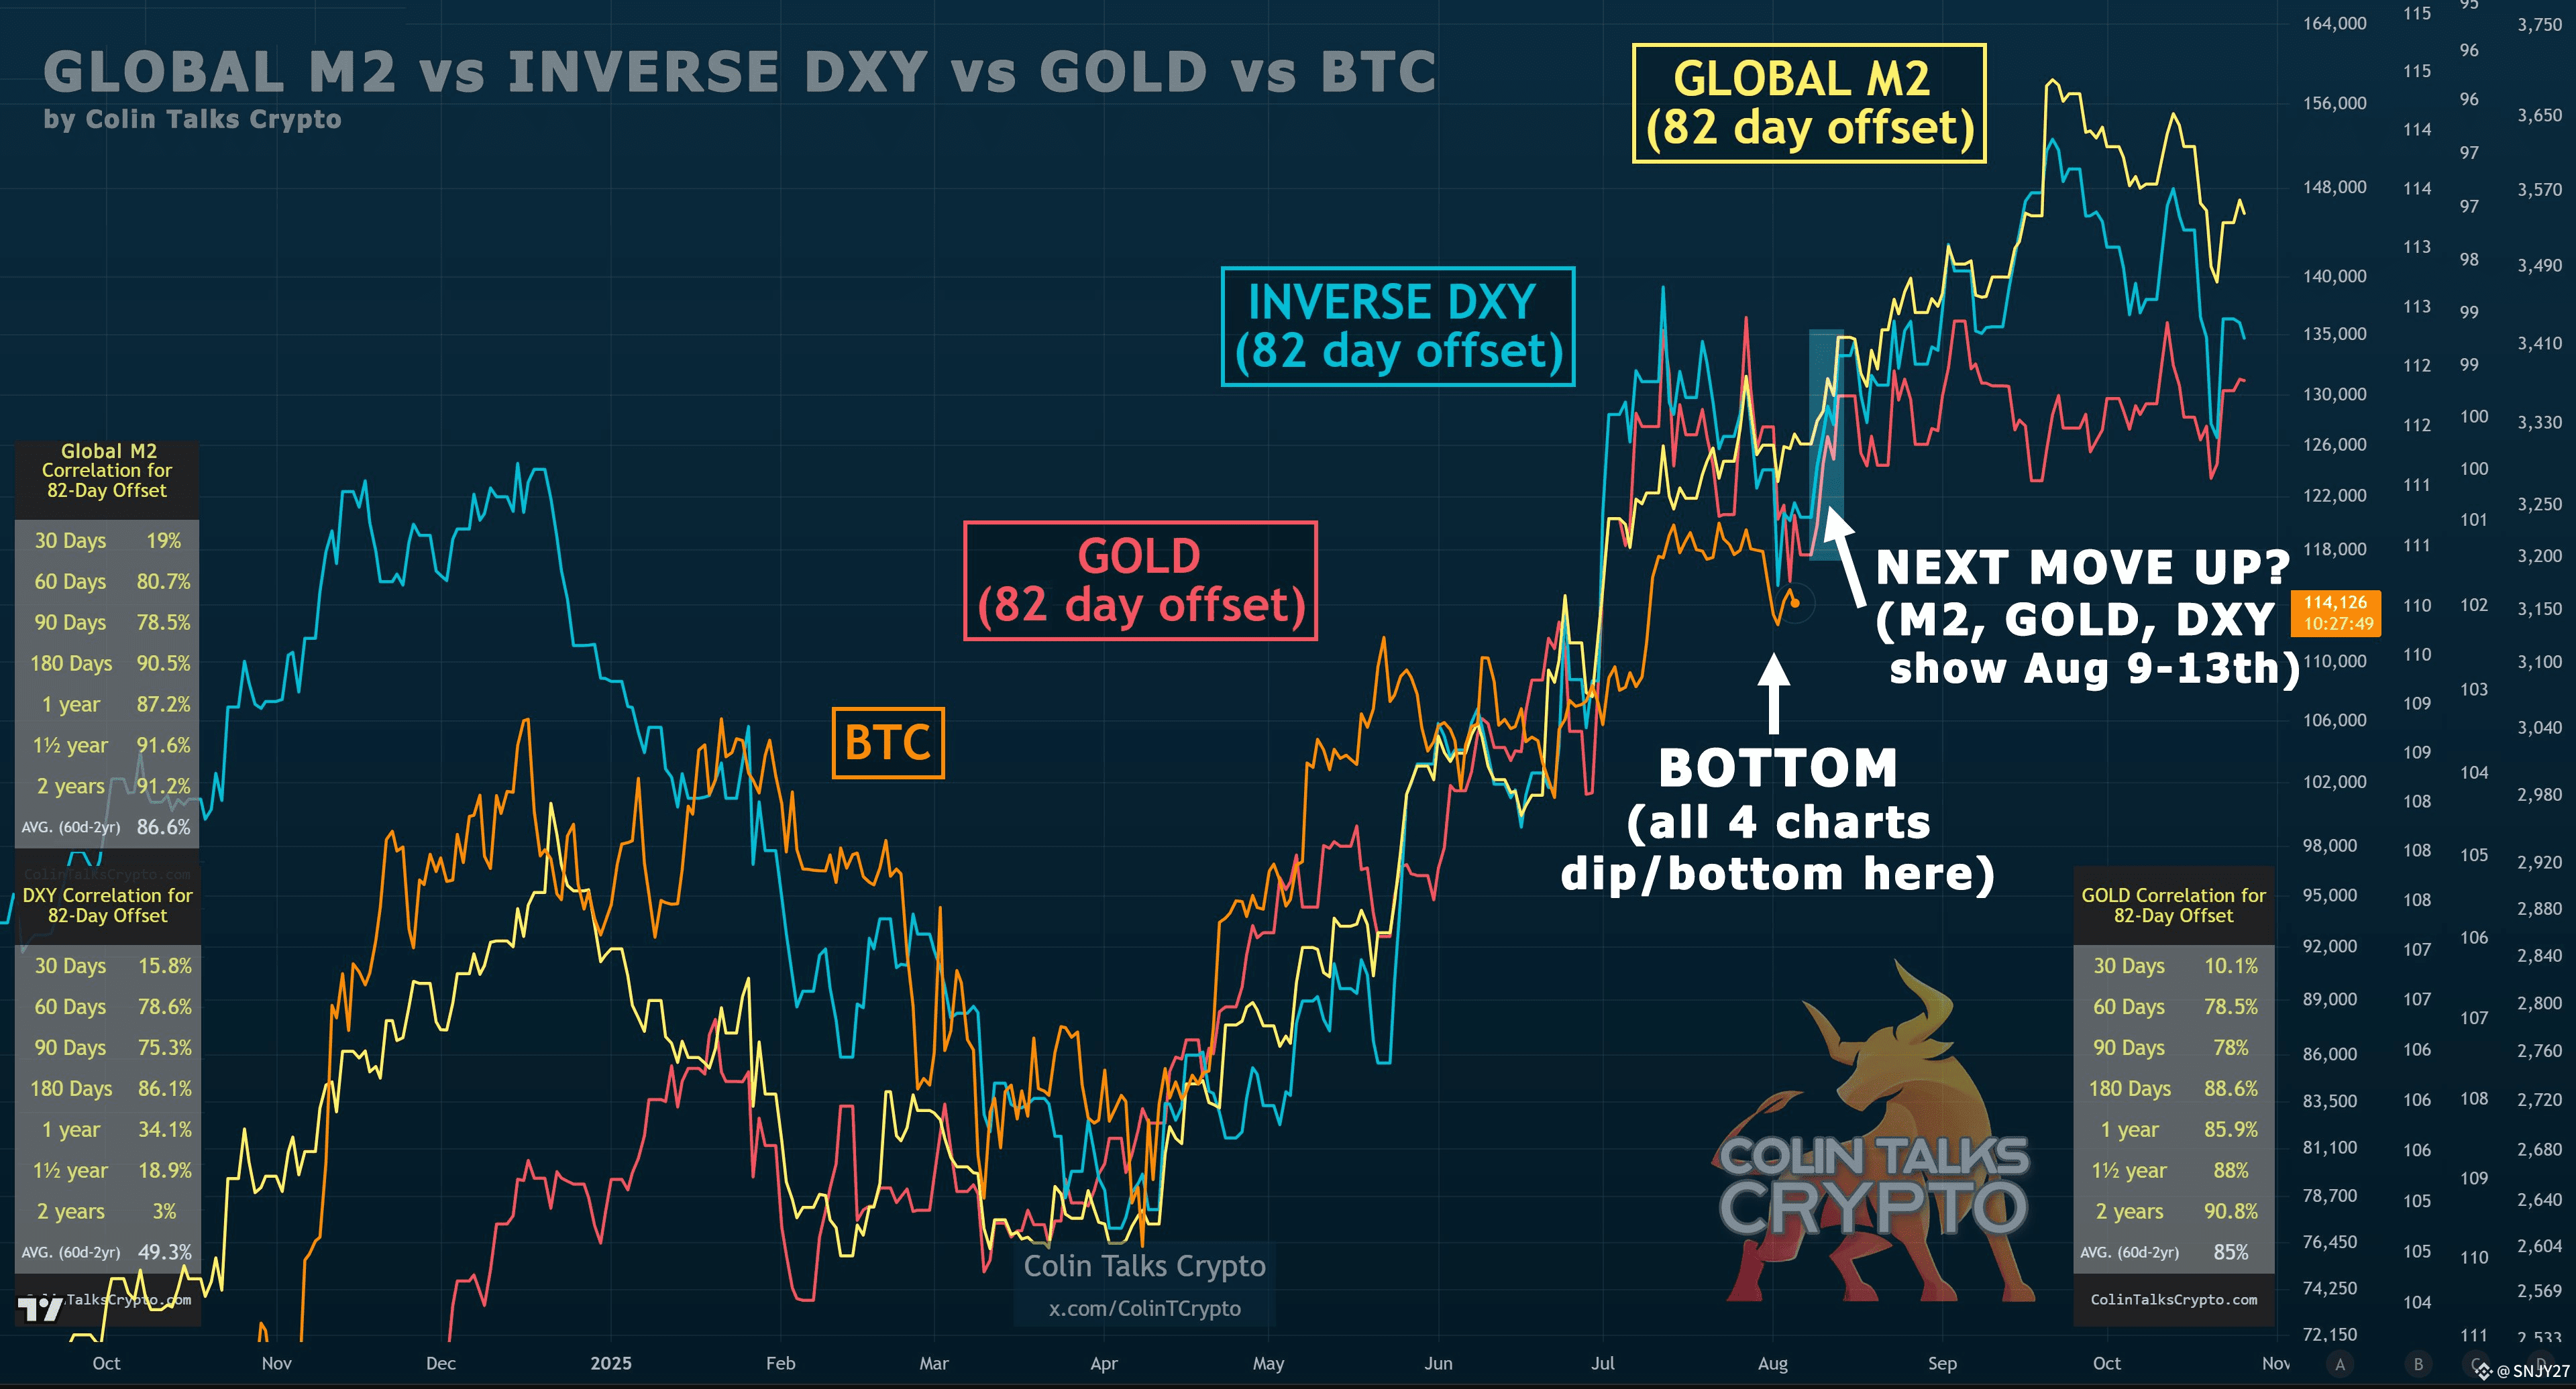
It's fascinating that all 3 charts (Global M2, Inverse DXY and Gold) all have a roughly 3 month lead on $BTC.
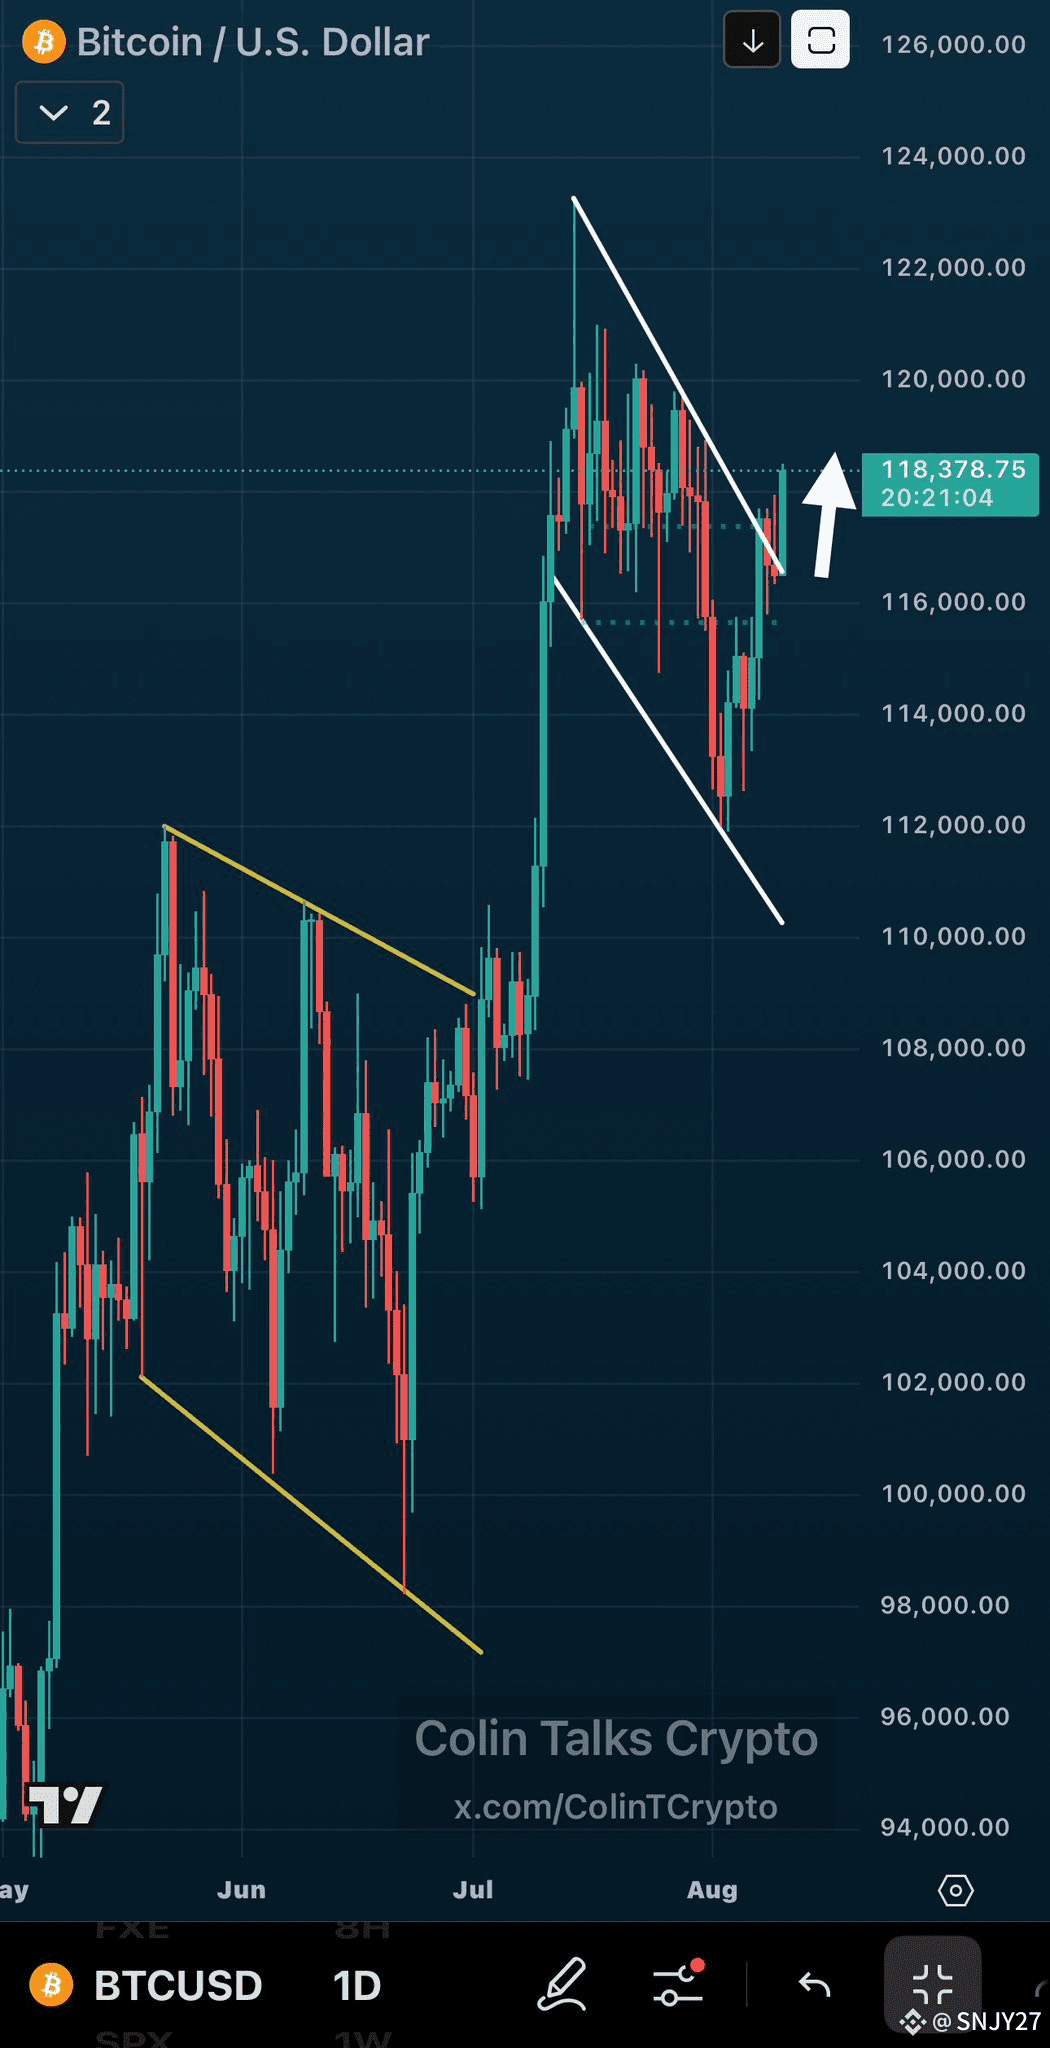
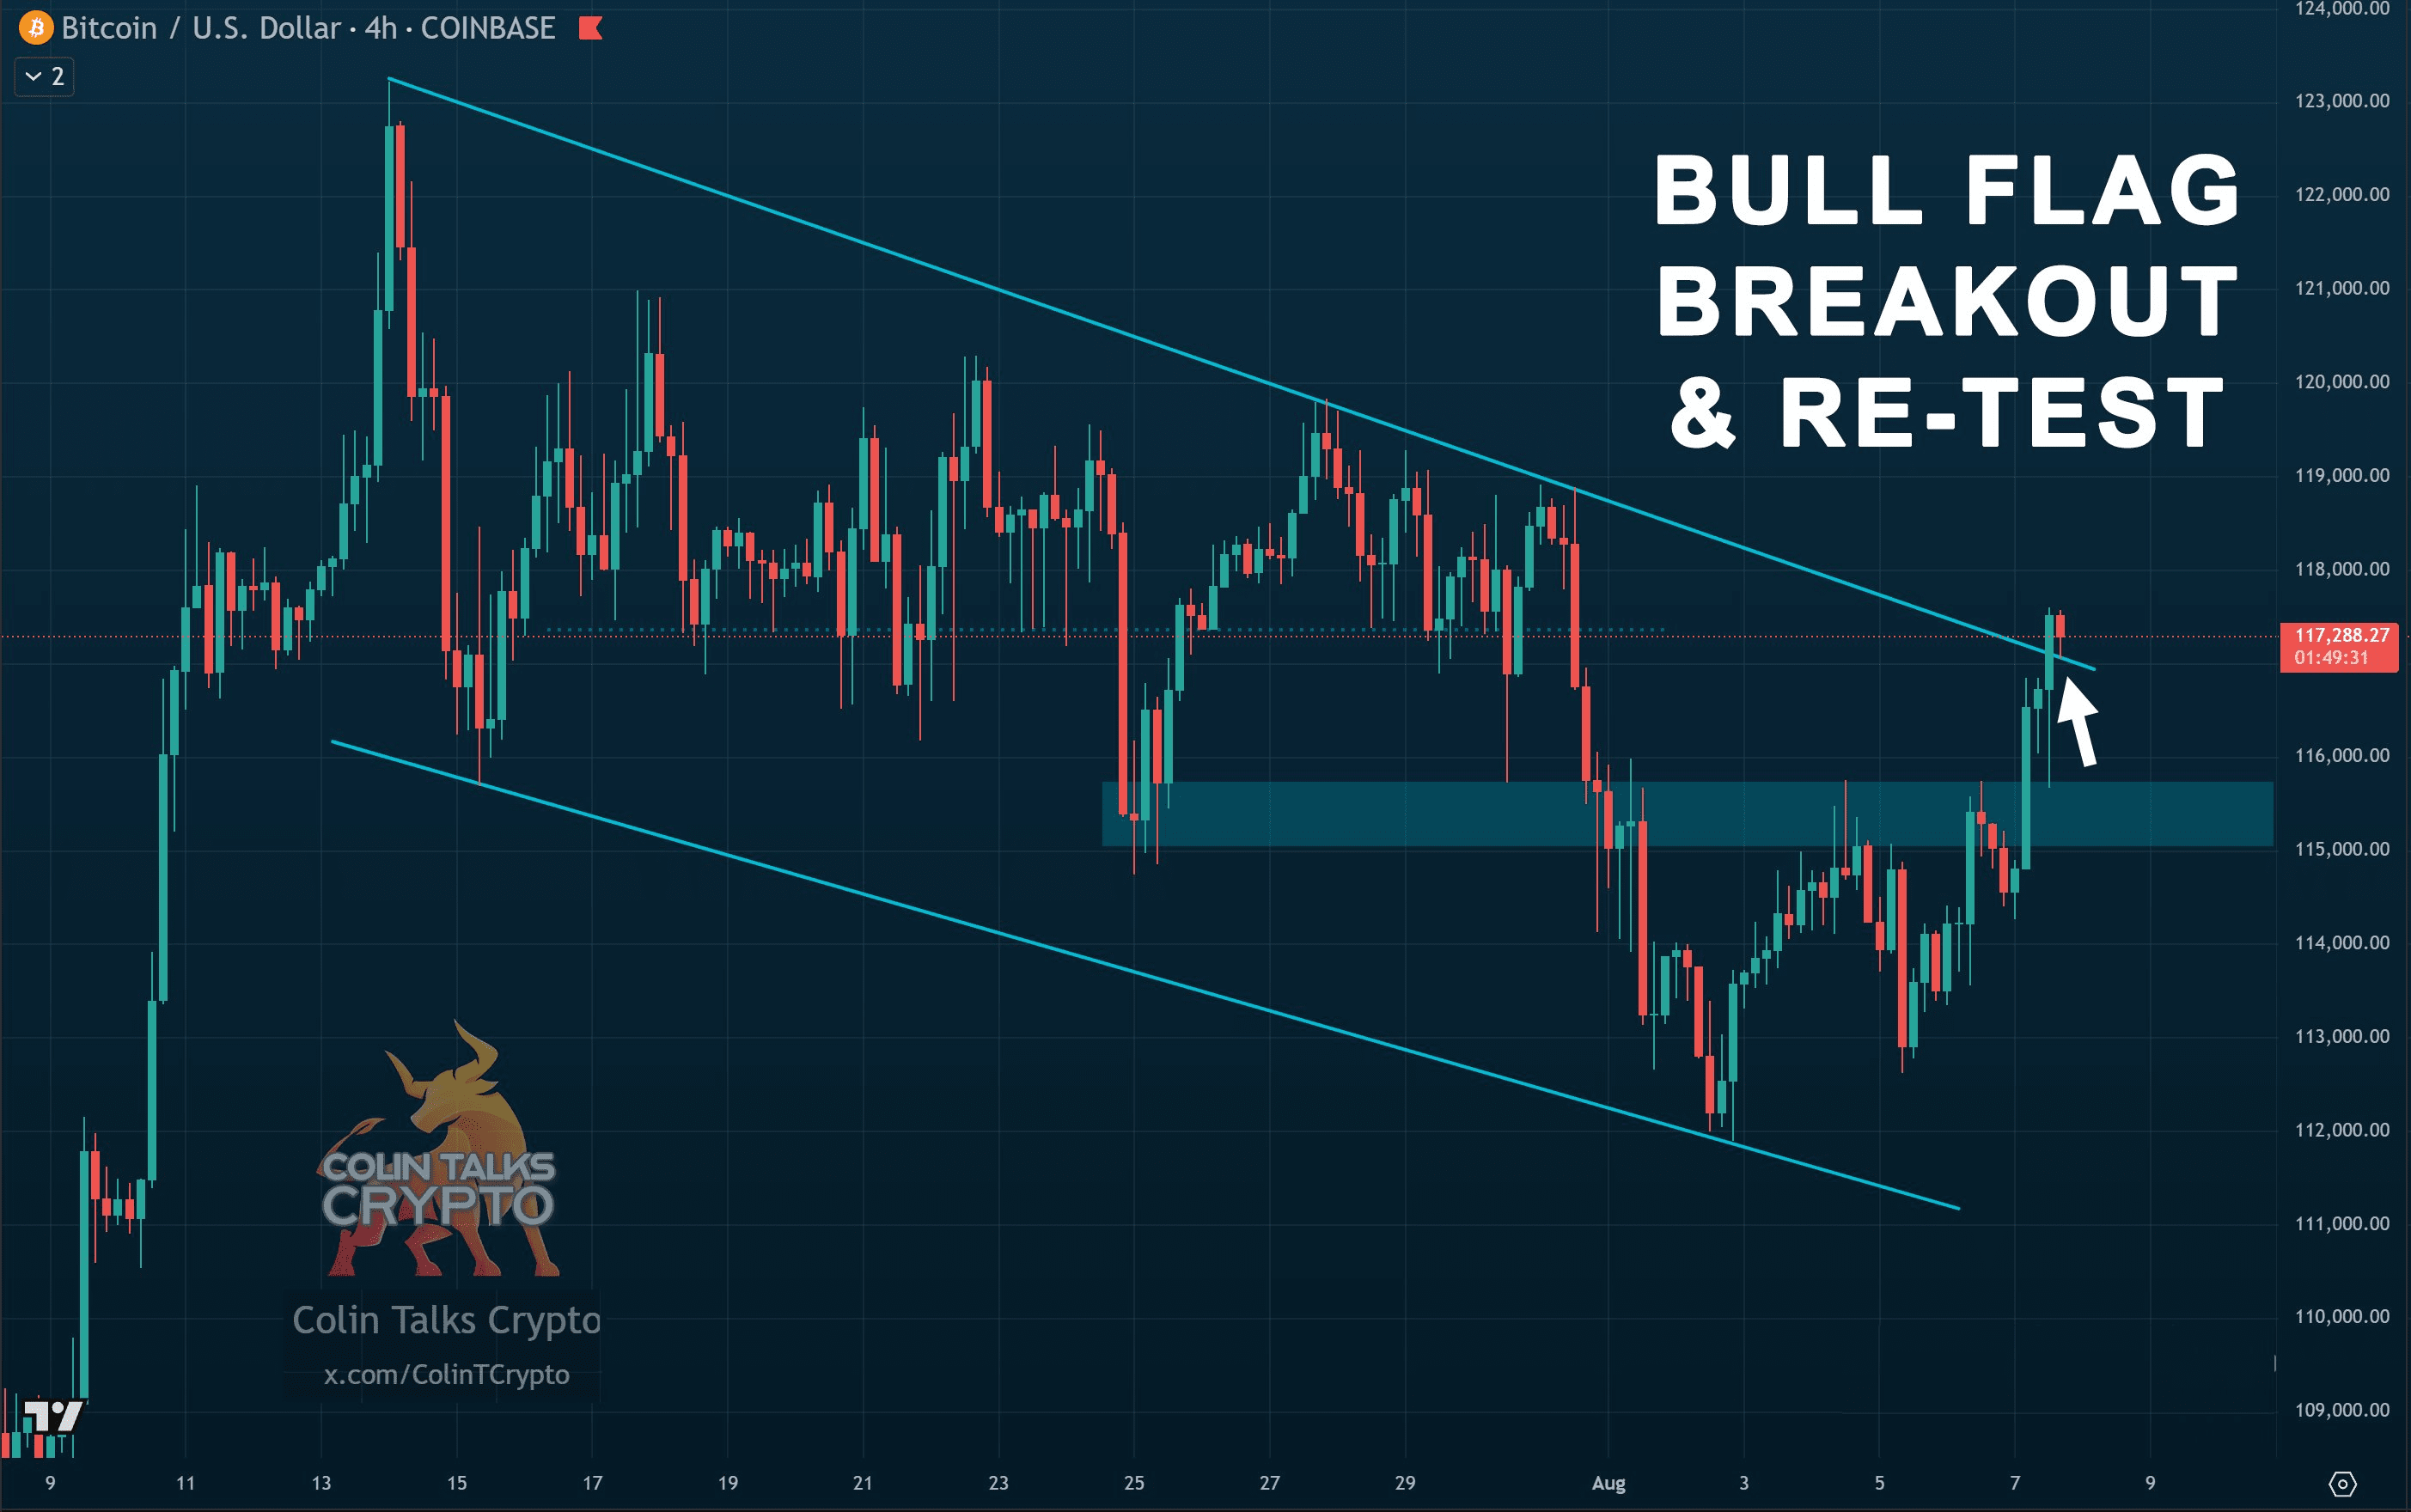
It’s August 10, And Bitcoin is breaking out of the bull flag. ✅
I kinda feel that a massive pump just started. This eth rush was kinda weird. 60+% in30d after looking dead forever. I don’t know. It’s a gut feeling that maybe it’s rocket time for BTC. And alts will follow like always. I don’t care about shitcoins. But I know you care lol. No offense intended. It’s just weird all the etf and btc treasury stuff and bitcoin kinda still needing some viagra. Maybe someone is holding horses to accumulate? 🇺🇸#ETH4500Next? #BTC🔥🔥🔥🔥🔥 #Notcoin #Write2Earn #Notcoin
Top 5 Altcoins for Massive Gains in AltSeason! Analysis
ALTSEASON list of altcoins with biggest Potential for 2026
can buy any coin from this post, if you want to buy then by your buying I will get some percentage commission from Binance🙏🏻
like follow comment 👇🏻
