
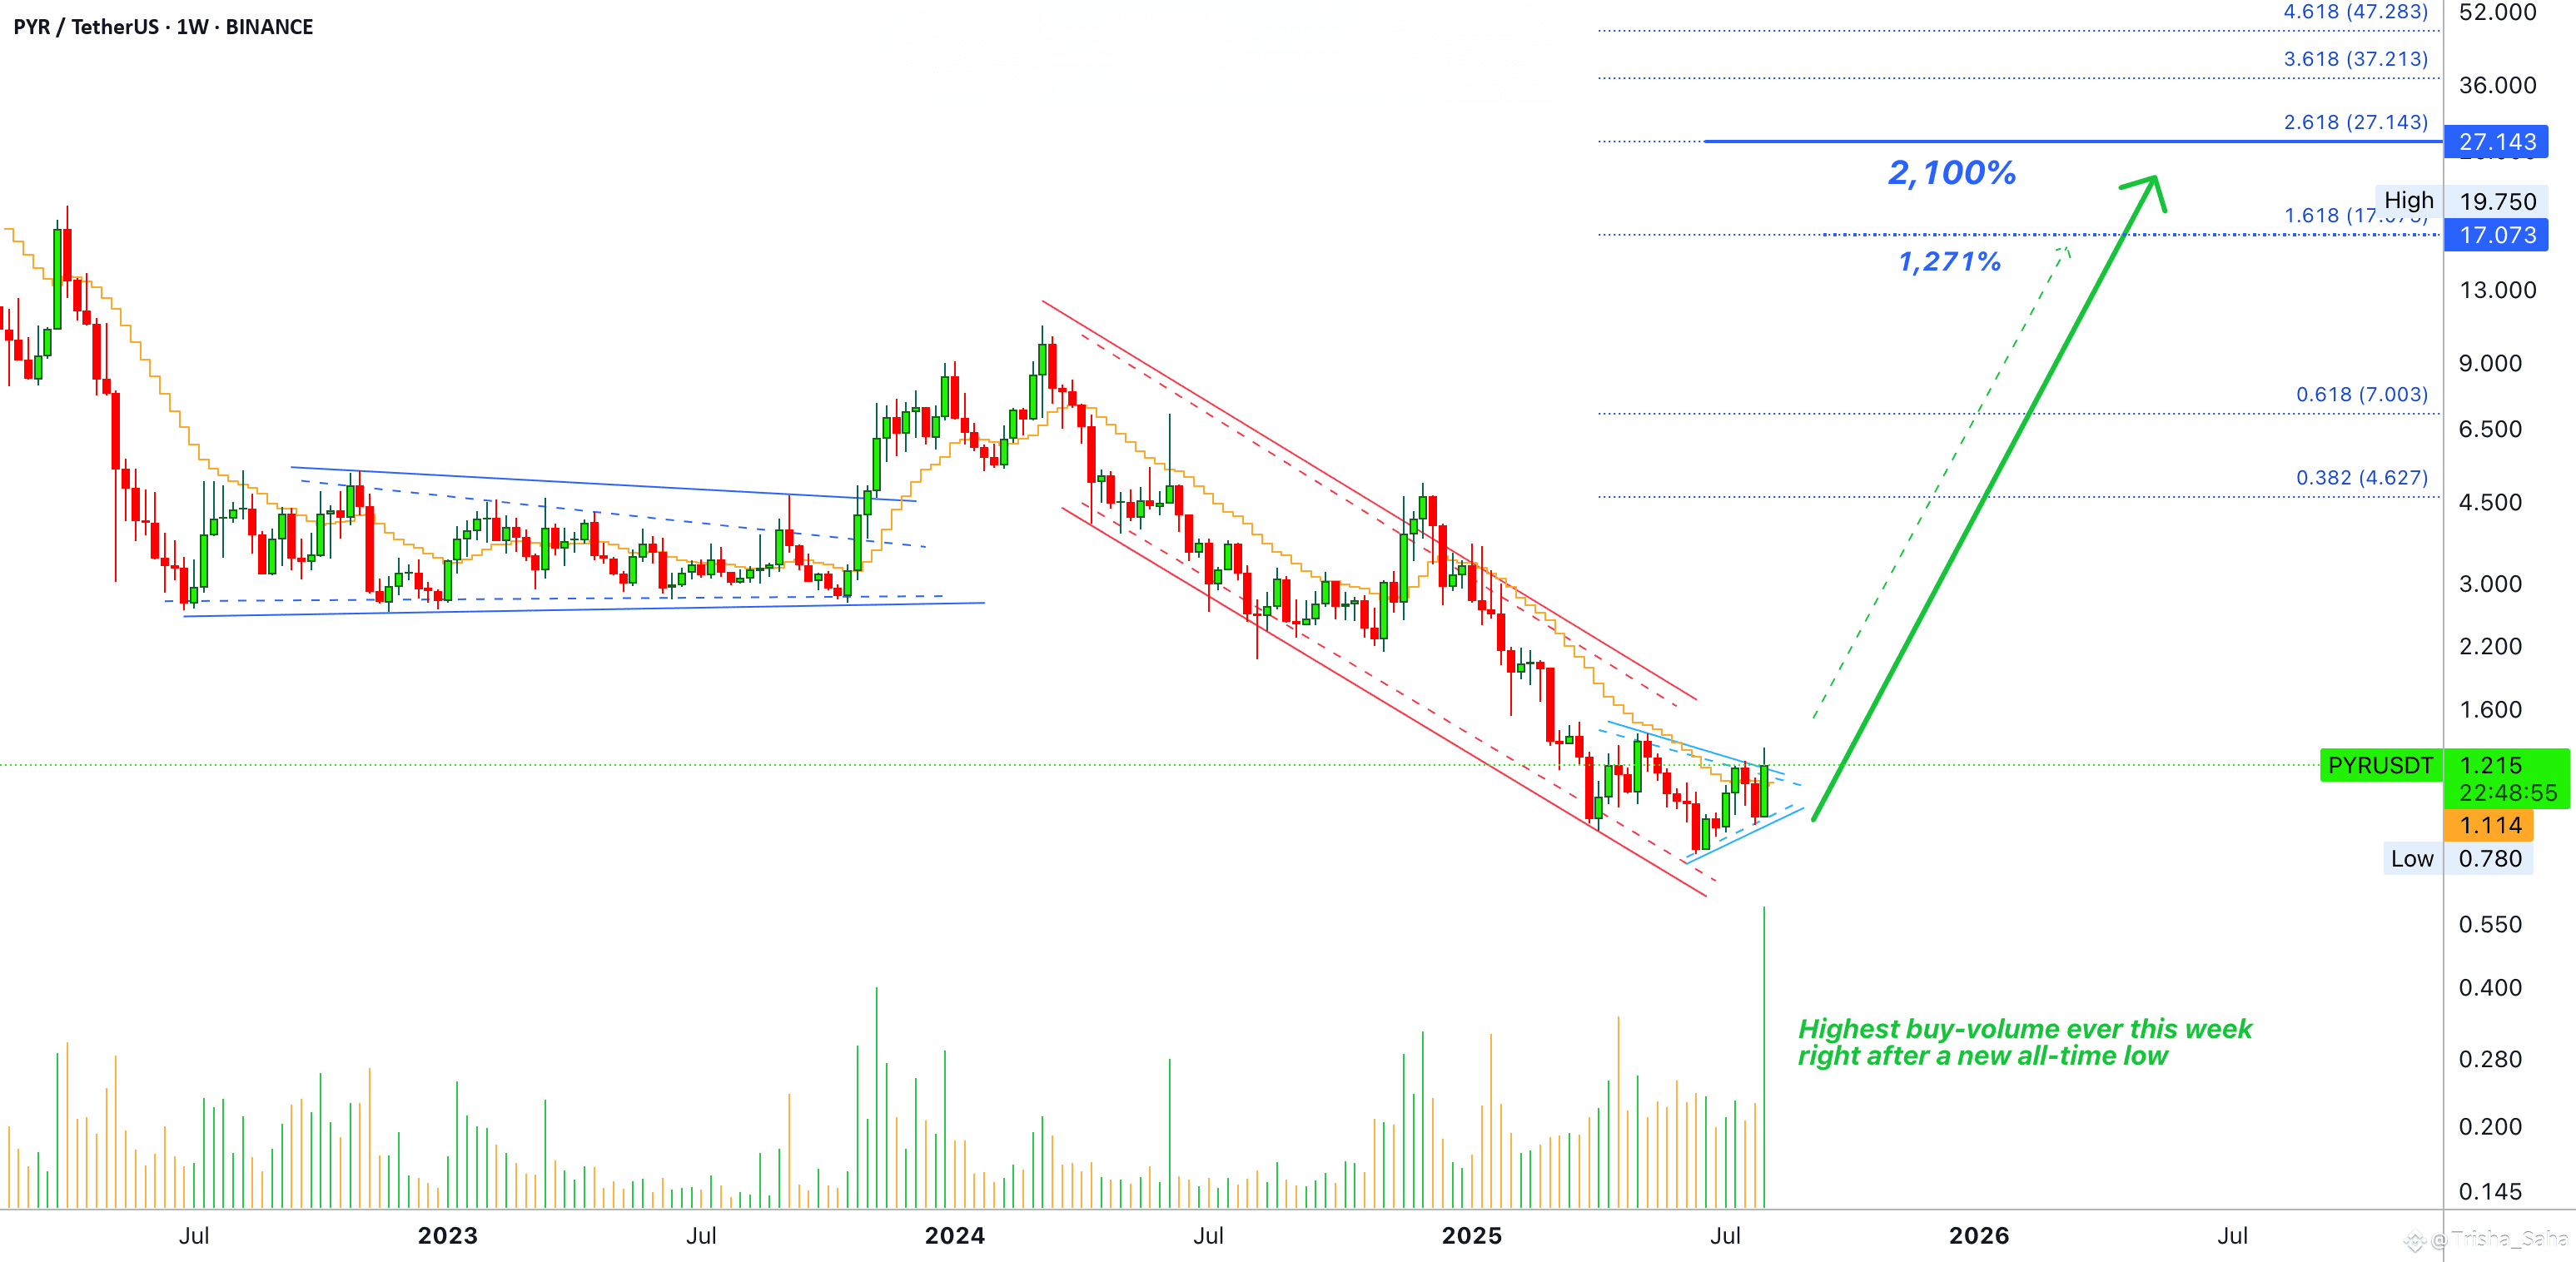
PYRUSDT just produced its highest buy-volume ever, this week just after producing a new all-time low. Let's see, high buying at bottom prices... The chart looks good.
This is a classic pattern now, many charts look the same. A small rise in late 2023 and a major downtrend starting March 2024. The bearish cycle ended June 2025 for PYRUSDT.
Variations. Some pairs hit bottom early, February 2025. Other pairs bottomed mid-March, around the 10th. The majority of the altcoins market hit bottom 7-April and then some pairs continued lower until June, July and even in August some projects were hitting new lows. As you can see, there is a big difference between February and August, but that is just how big the market has become.
The signals are good but we can go deeper.
PYRUSDT is trading weekly above EMA8 and EMA13. This confirms that the bulls are now entering the game. This same week these levels are being conquered as resistance.
The MACD is above the signal line, the classic bullish cross already happened. The weekly MACD is still below zero but trending upwards and with a strong bullish divergence. It bottomed years ago, mid-2022.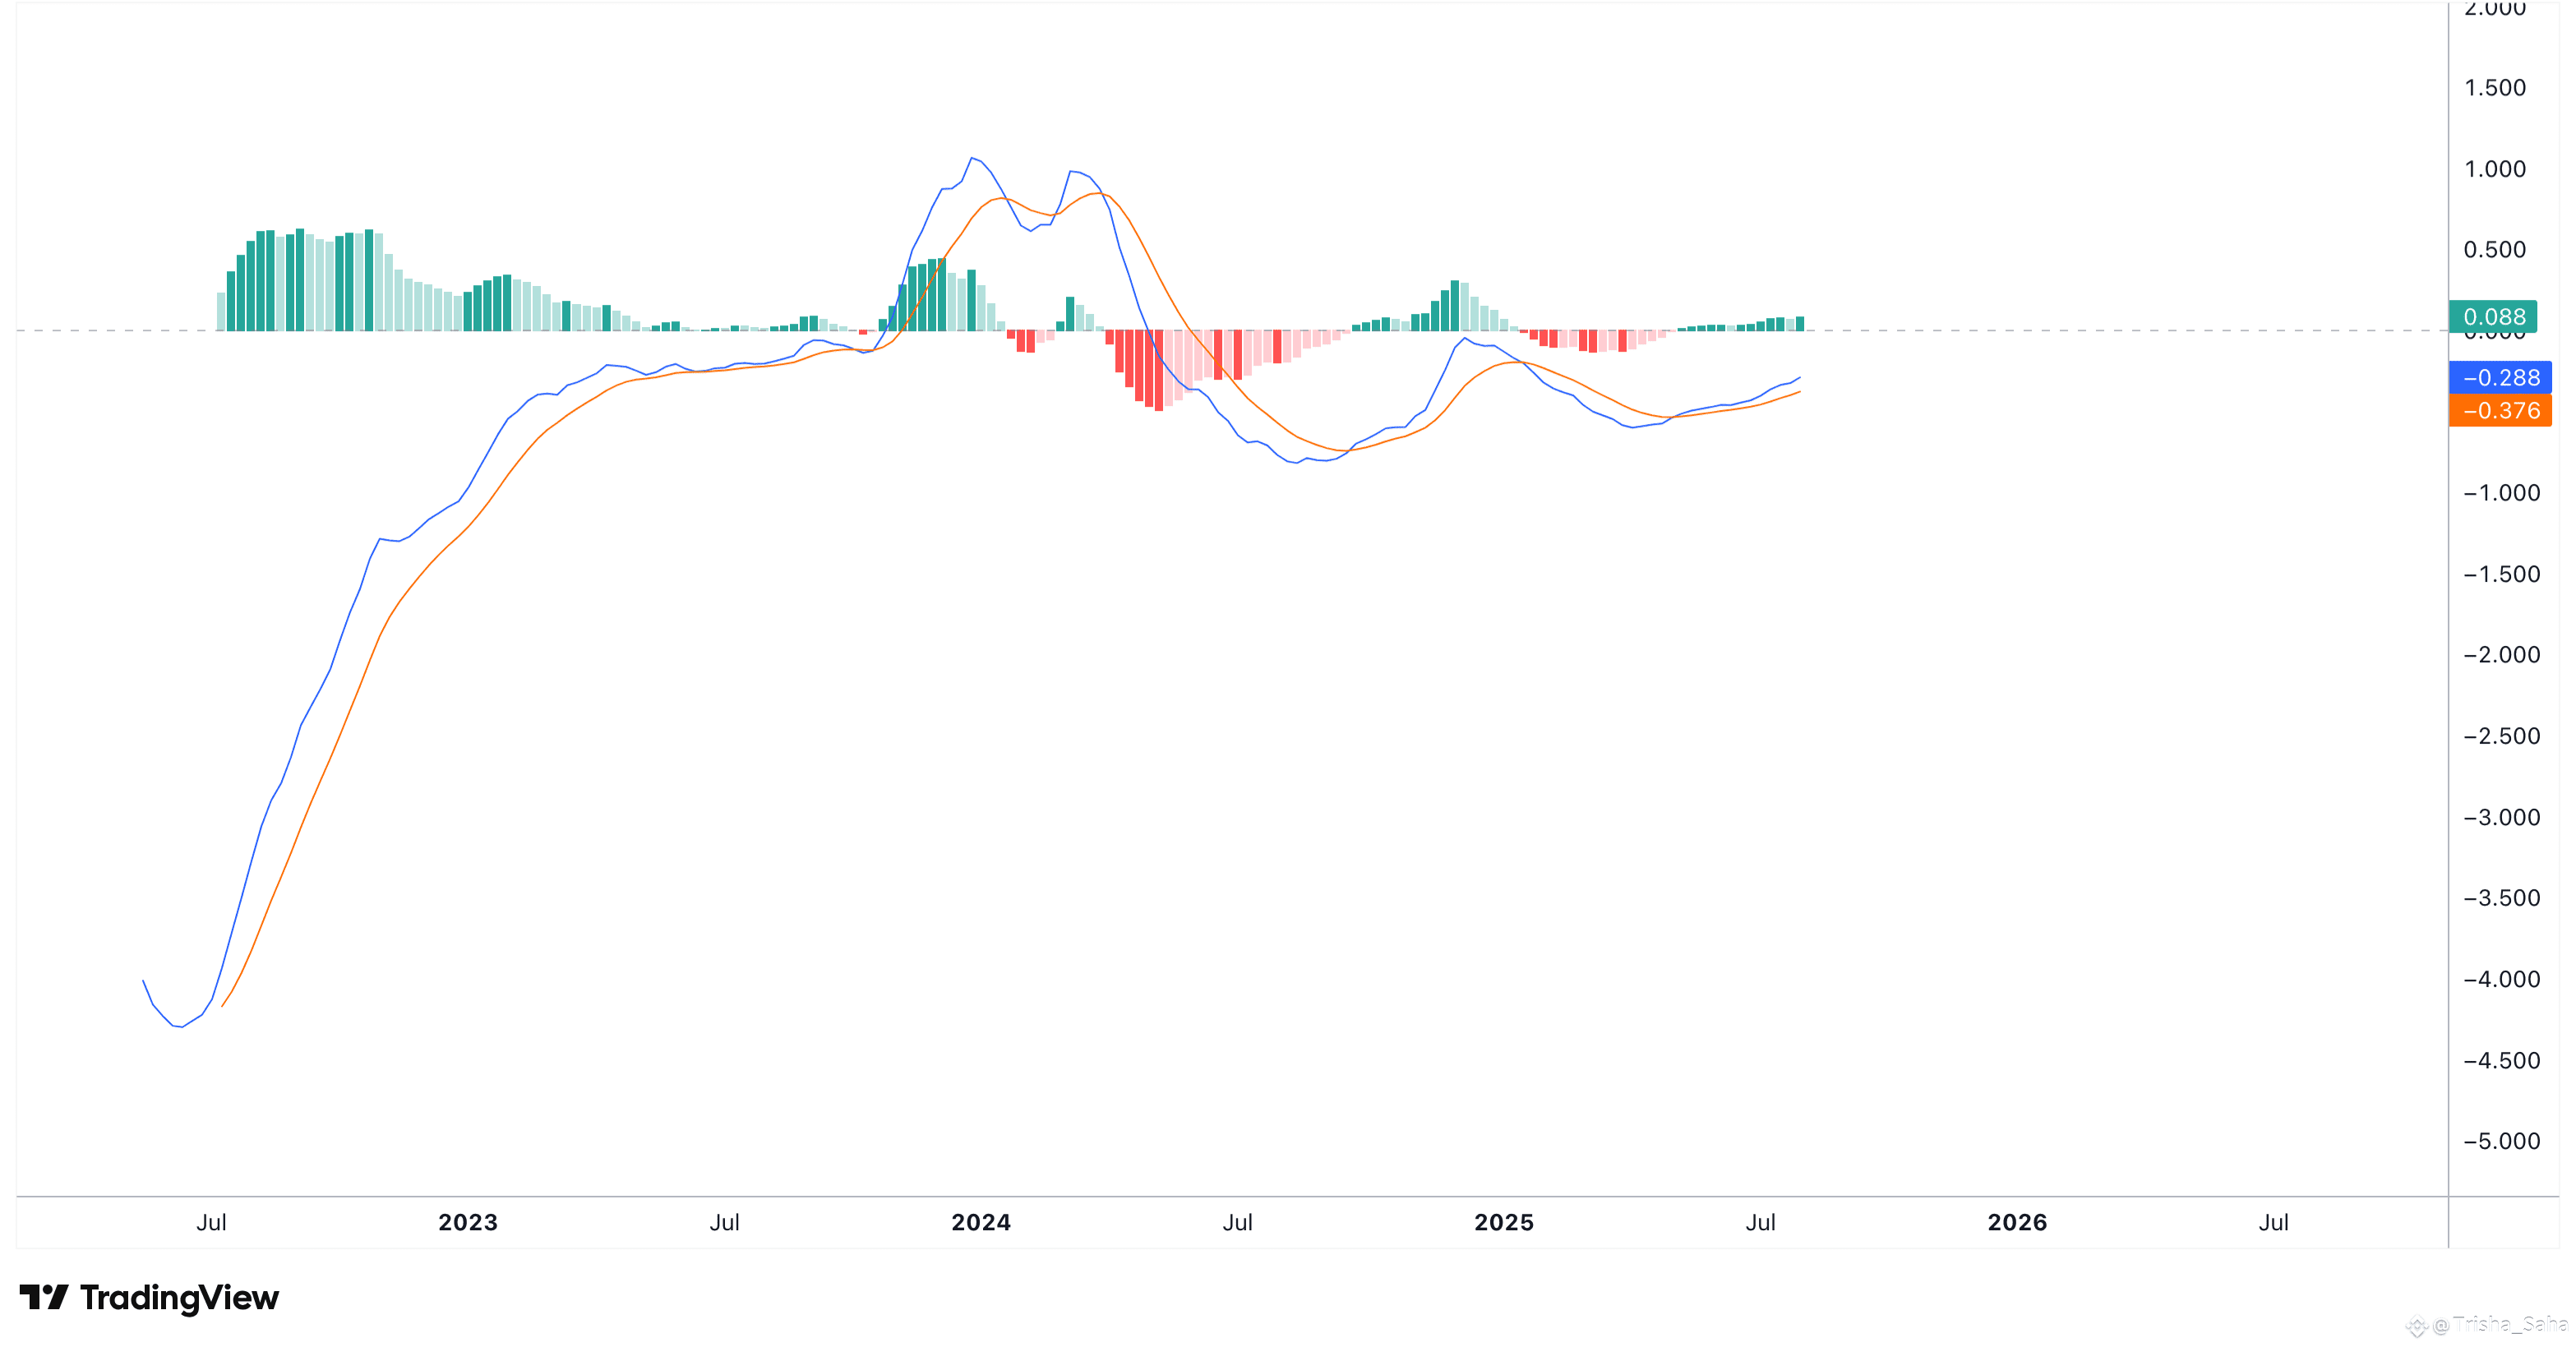
The weekly RSI hit bottom in March 2022 and in March 2025 we have a long-term higher low, another strong bullish divergence.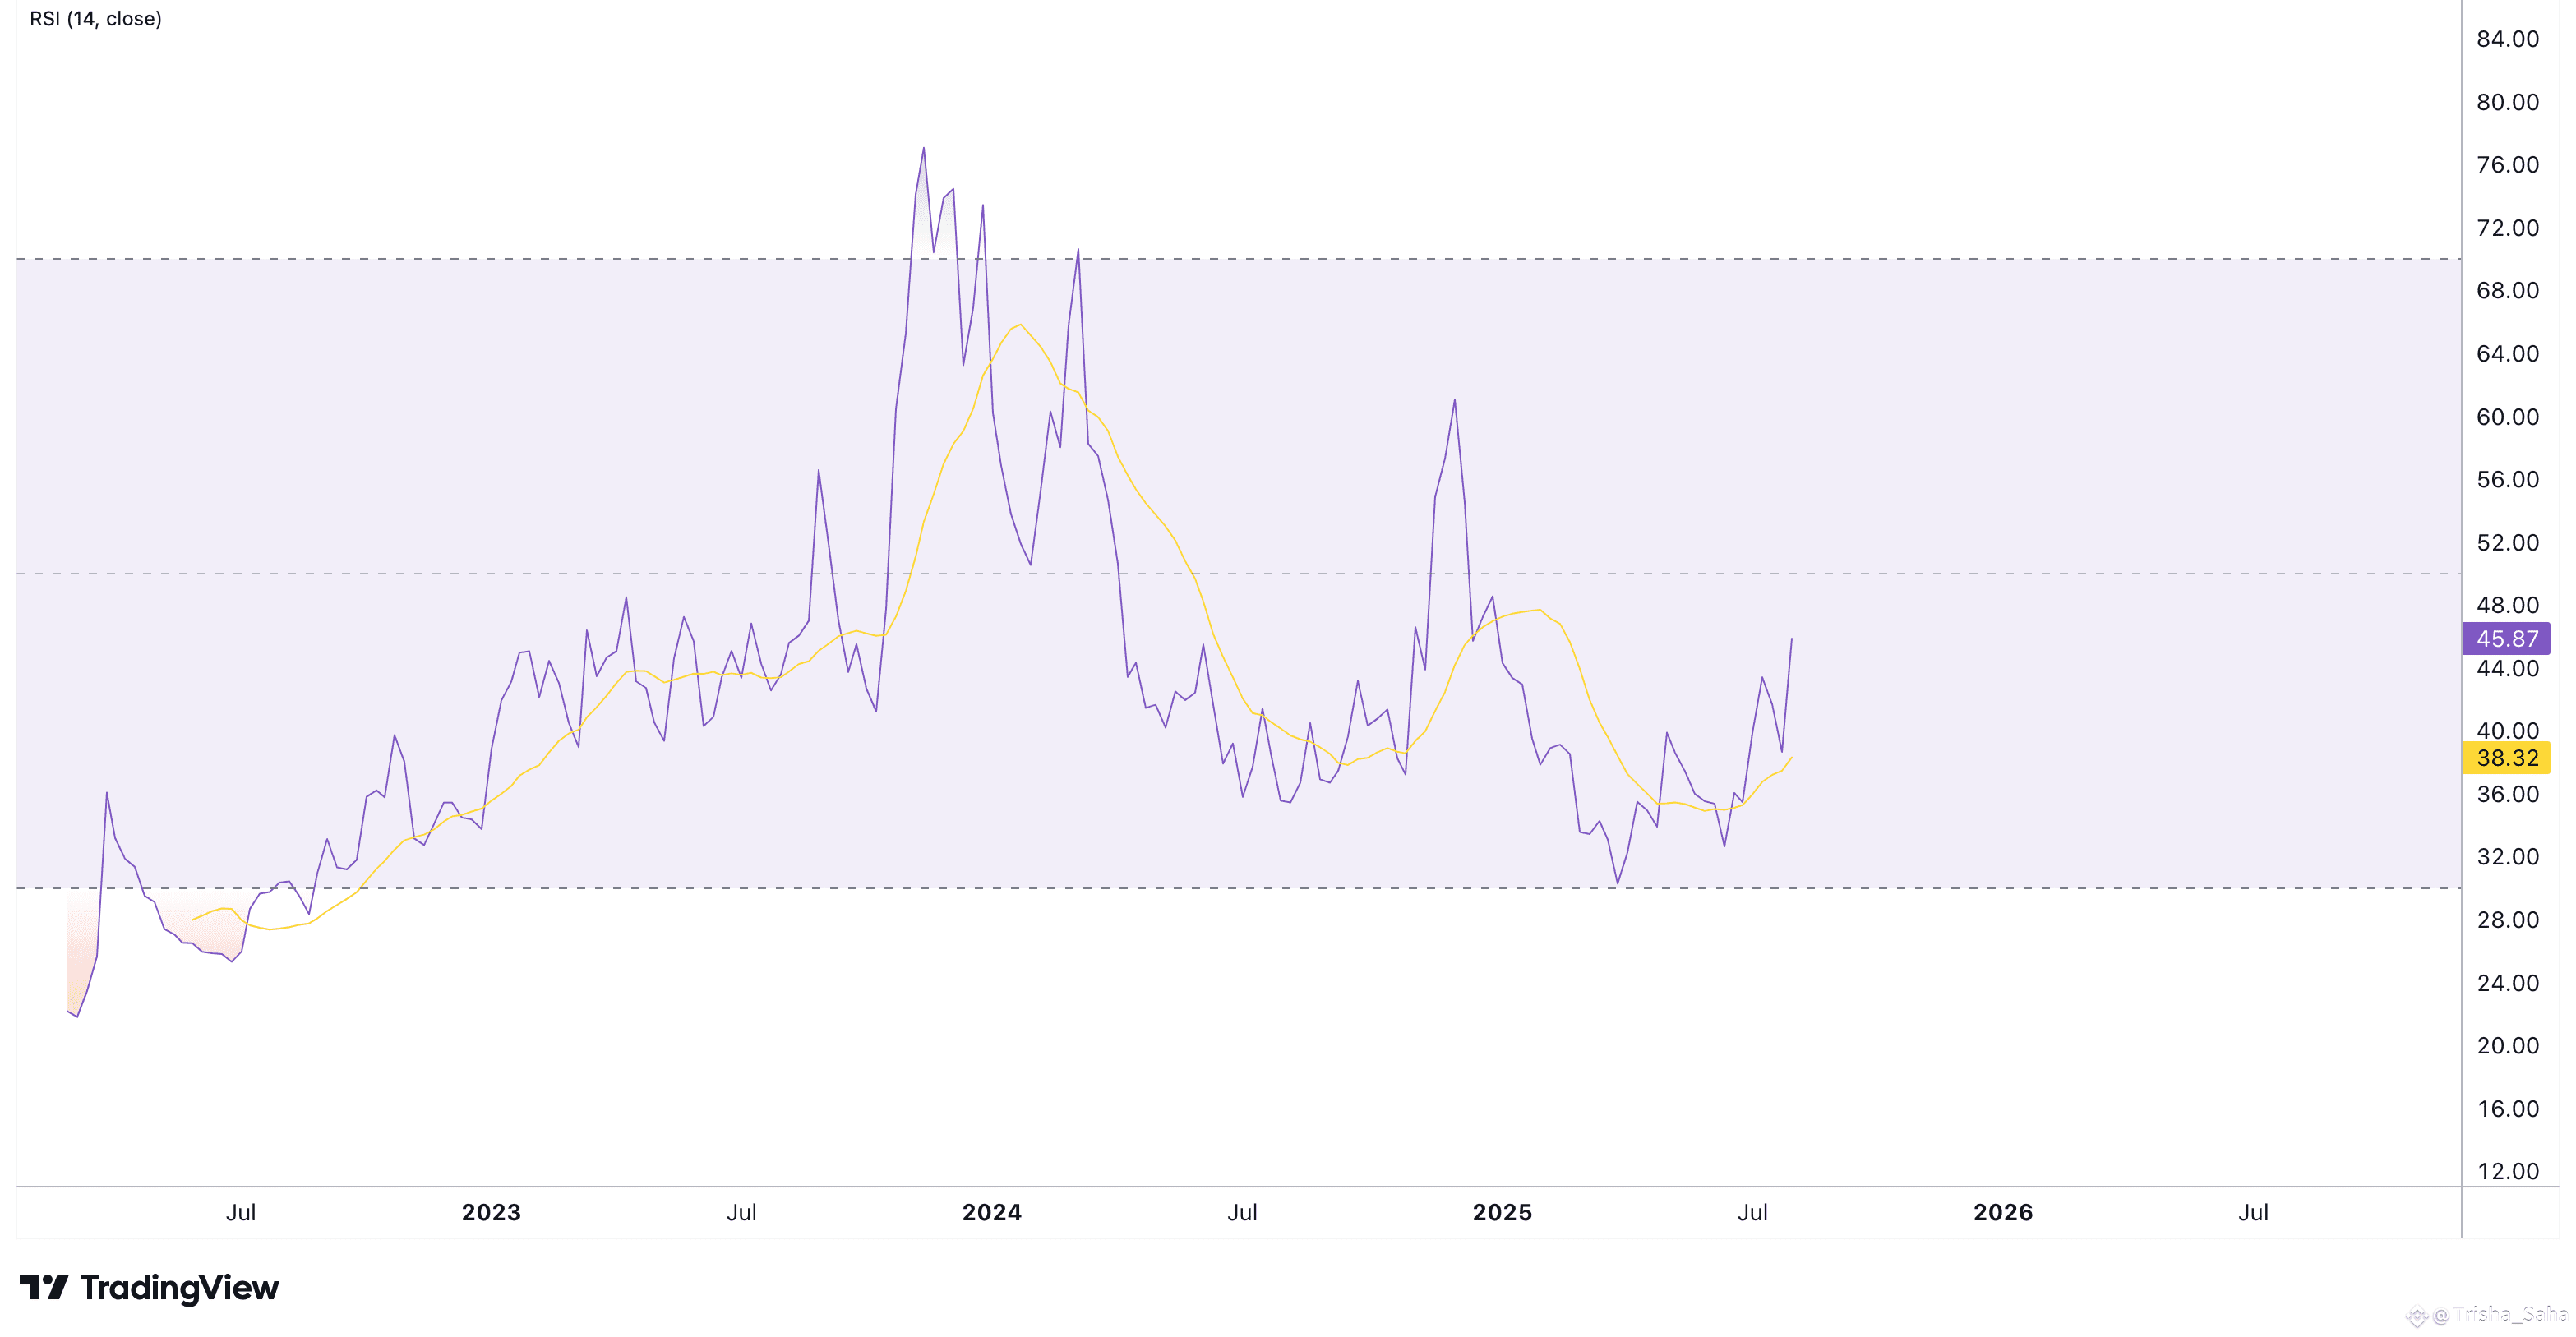
The reading on the RSI is good and improving. It is clearly pointing higher, straight up.
A $27 target has 2,100% profits potential while a $17 target has 1,270%.
Thank you for reading, your support is truly appreciated.
Namaste.