Do you want to trade confidently and read the market like professionals?
Technical indicators are your tools for understanding direction, momentum, and liquidity. Analyzing ETH/USDT reveals precise signals… Here’s a simplified and inspiring explanation of the most important indicators, with practical examples to help you make smarter trading decisions:
---
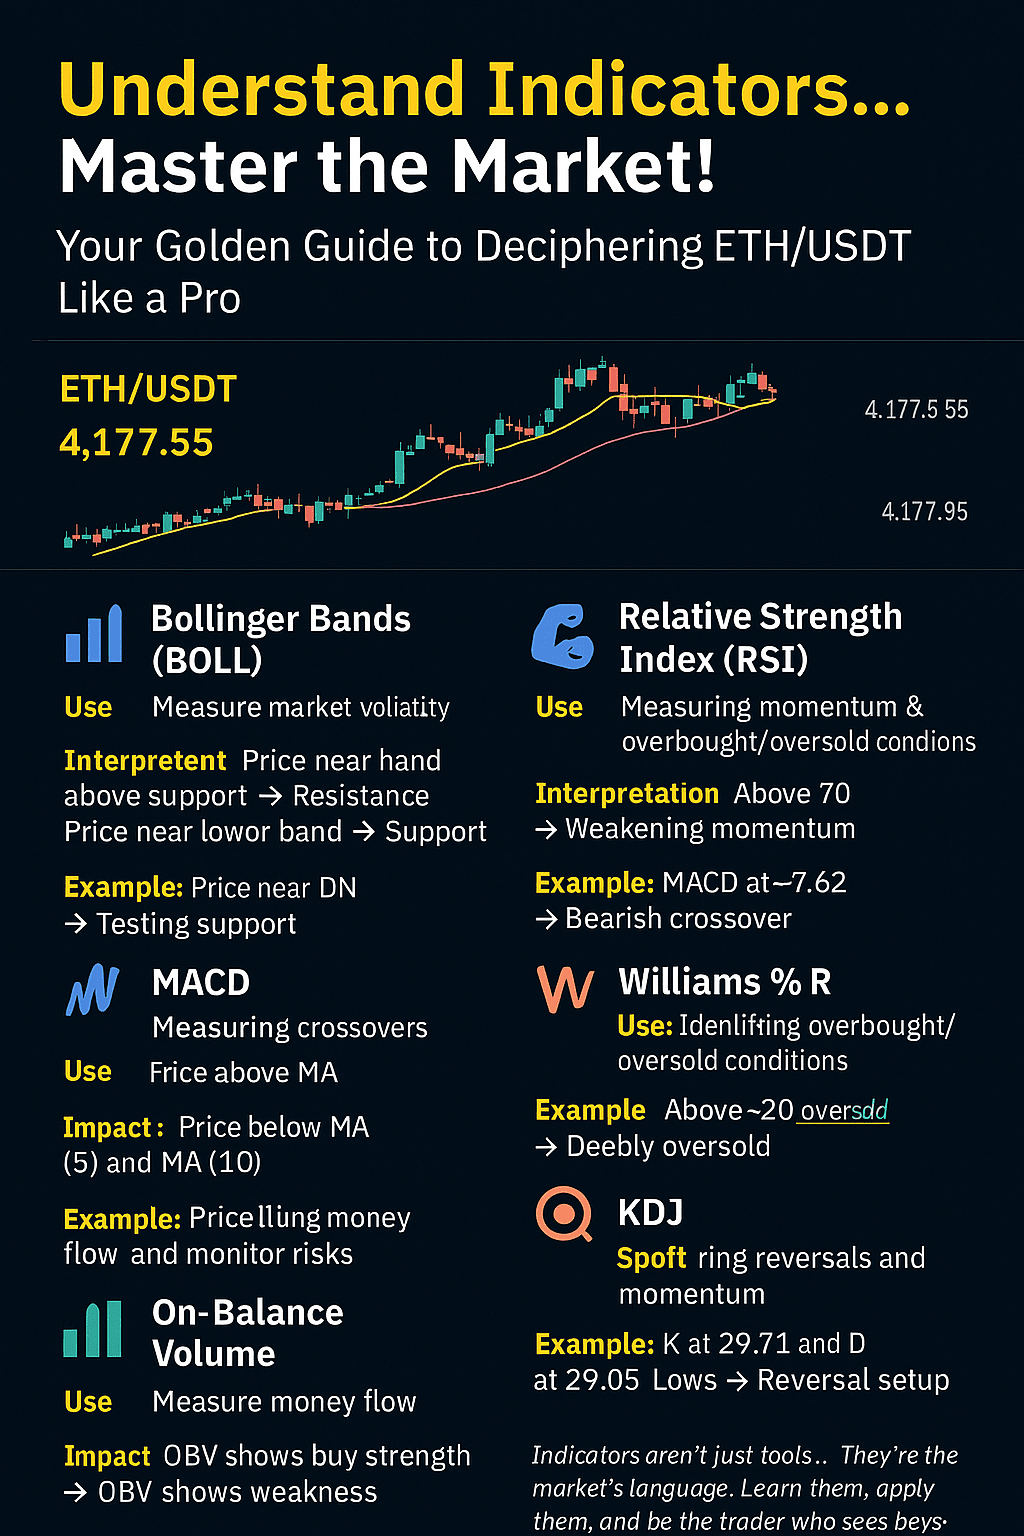
📈 Bollinger Bands (BOLL):
- Usage: Measuring market volatility and identifying support and resistance areas.
- Meaning:
- Price near the upper limit ➜ Potential resistance
- Price near the lower limit ➜ Potential support
- Example: Current price 4,177.55 close to DN: 4,164.46 ➜ The market is testing support… A rebound opportunity is likely.
---
💪 Relative Strength Index (RSI):
- Usage: Measuring momentum and identifying overbought areas.
- Meaning:
- Above 70 ➜ Overbought
- Below 30 ➜ Oversold
- Example: RSI(6) at 42.08 ➜ Moderate momentum leaning weak… Watch for a potential reversal.
---
🔄 MACD (DIF, DEA, MACD):
- Usage: Detecting crossovers to identify reversals.
- Meaning:
- DIF > DEA ➜ Buy signal
- DIF < DEA ➜ Sell signal
- Example: MACD at -7.62 ➜ Negative crossover, but the narrow gap may precede a reversal.
---
📊 Moving Averages (MA):
- Usage: Identifying the overall trend.
- Meaning:
- Price above MA ➜ Uptrend
- Price below MA ➜ Downtrend
- Example: Price below MA(5) and MA(10) ➜ Clear selling pressure… but the gap may create an entry opportunity.
---
📉 On-Balance Volume (OBV):
- Usage: Measuring liquidity flow.
- Meaning:
- OBV rising ➜ Support from buyers
- OBV declining ➜ Weakness in the trend
- Example: OBV below MA and EMA ➜ High outflow liquidity… Watch for direction change.
---
📌 Williams %R:
- Usage: Accurately identifying overbought areas.
- Meaning:
- Above -20 ➜ Overbought
- Below -80 ➜ Oversold
- Example: Wm %R at -68.86 ➜ In the oversold area… Potential rebound opportunity.
---
⚡️ Stochastic RSI & MASTOCHRSI:
- Usage: Measuring instantaneous momentum.
- Meaning:
- Below 20 ➜ Oversold
- Above 80 ➜ Overbought
- Example: STOCHRSI at 7.96 ➜ At the momentum bottom… A prompt signal for a quick rebound.
---
🎯 KDJ (K, D, J):
- Usage: Identifying reversal points and momentum.
- Meaning:
- K and D crossover ➜ Entry or exit signal
- Value J shows the instantaneous deviation
- Example: K at 29.71 and D at 29.05 ➜ The indicator is in low areas… Entry opportunity before reversal.
---
💡 Summary:
Indicators are not just tools… They are the language of the market.
Understand it, apply it, and be the trader who sees what others do not.
#TradingSignals #ETH #BinanceSquare #esmatalmohammedi $ETH