

🔍 Analysis for BTC/USDT
📅 Timeframe: 1D | Price: $116,142
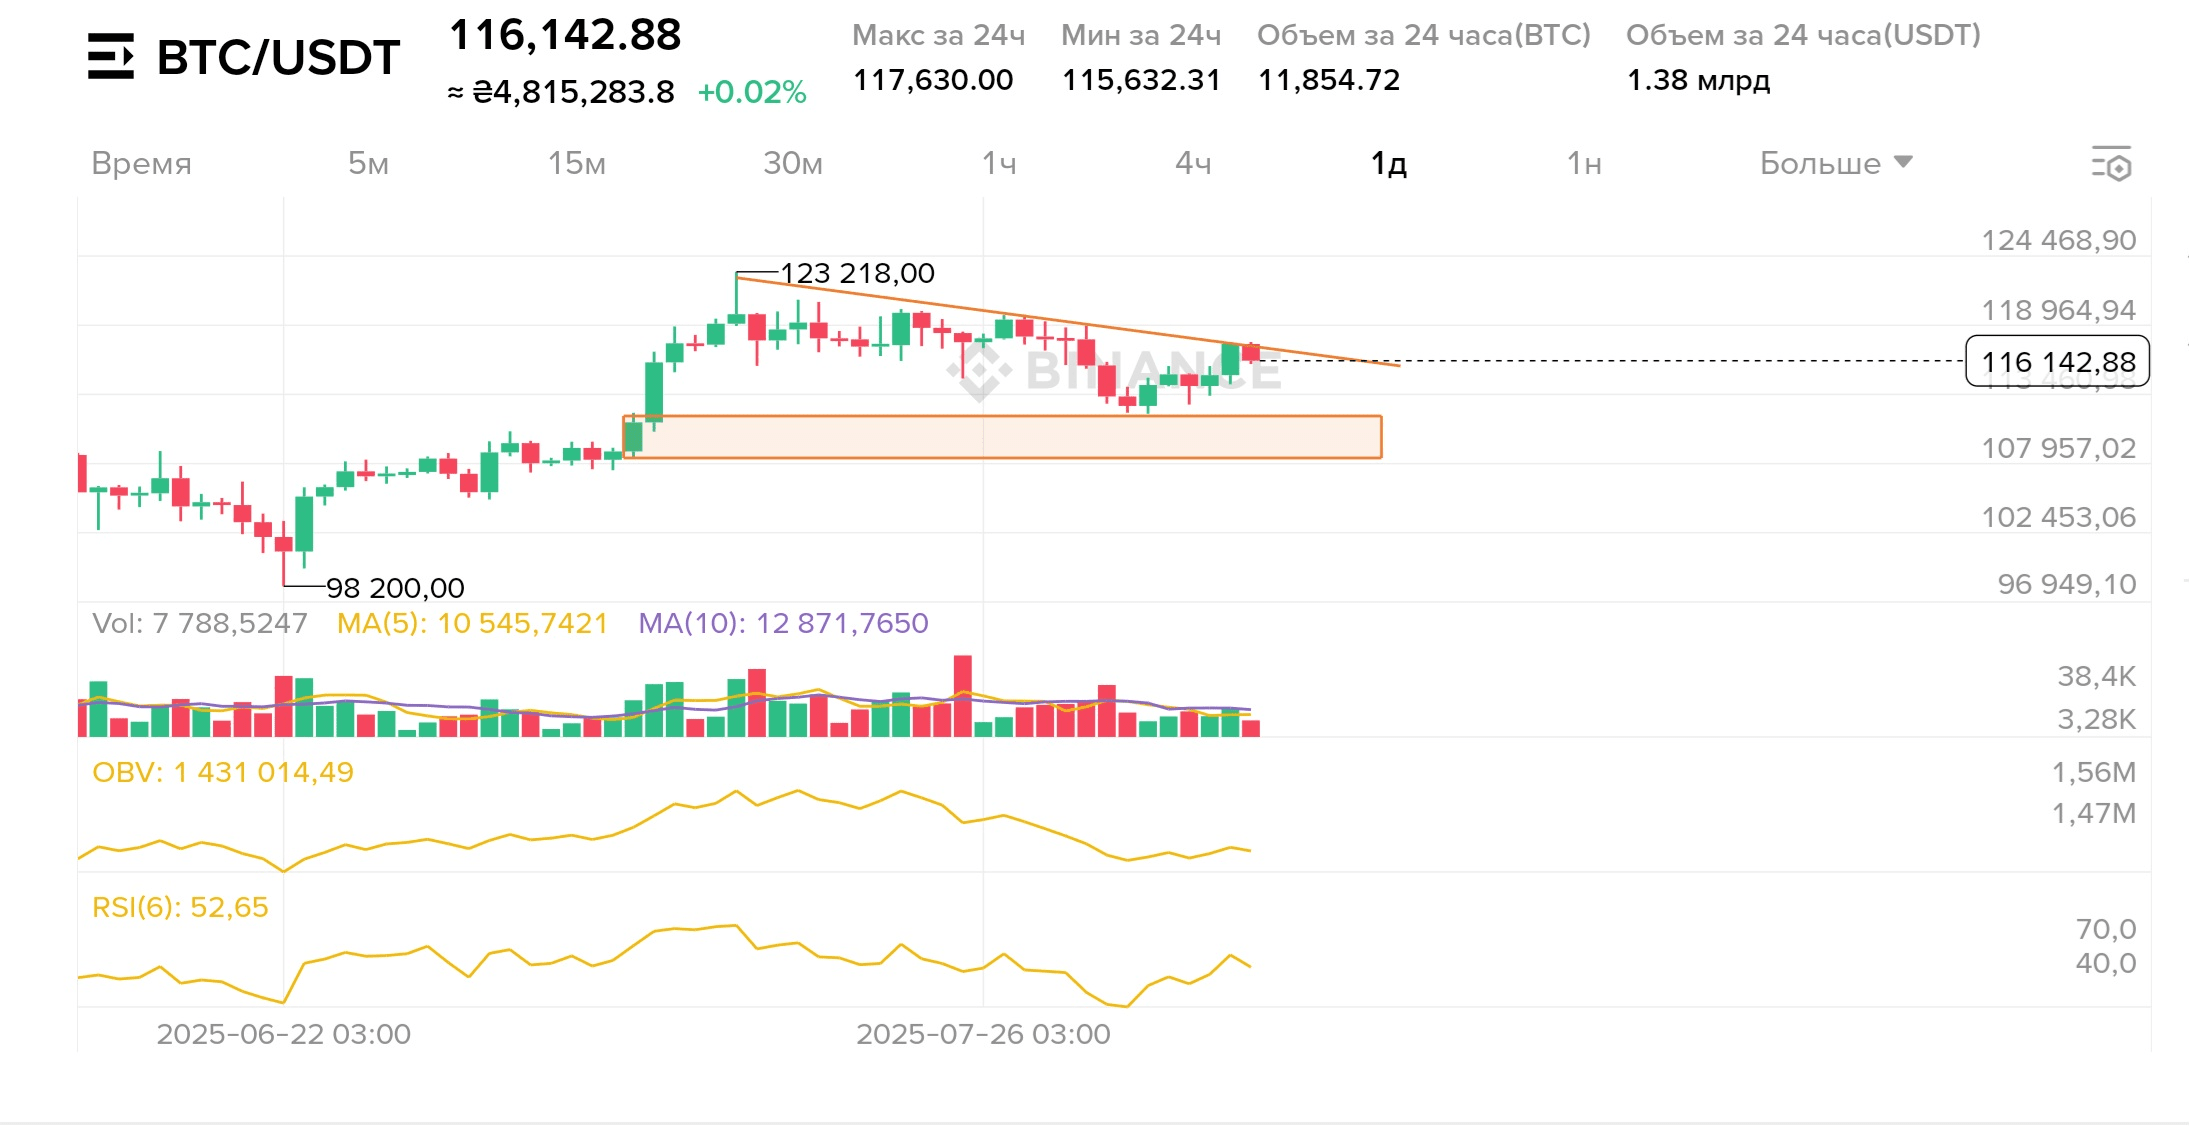
On the daily chart BTC/USDT, a descending triangle (🔻) is forming, with the upper boundary coming from the local high of $123,218 and preventing the price from rising. Meanwhile, the support zone in the range of $107,000–$102,000 (🟧) continues to hold the price from further decline.
📉 Volume is decreasing, indicating a phase of consolidation and a likely approach of a strong movement.
📊 Indicators:
RSI (6) = 52.65 — neutral zone, balance between sellers and buyers ⚖️.
OBV shows moderate outflow, which may signal weakness in demand.
MA(5) and MA(10) — short-term moving averages indicate a possible sideways movement or readiness for a breakout.
📌 Key Levels:
Support: $107,000–$102,000 (whale interest zone 🐳)
Resistance: $118,964 and then $123,218
📈 Bullish Scenario:
A breakout of the descending resistance line (orange line) with a consolidation above $118,964 will open the way to $124,500 and above 🚀.
📉 Bearish Scenario:
A drop below $107,000 activates sellers, and the price may drop to $98,200 and below 🕳️.
💬 Output:
BTC is in a decision-making phase. The forming triangle (📐) and declining volumes indicate accumulation. The future direction will be determined by a breakout of one of the boundaries of the figure. We are monitoring the volumes and reaction to key levels 📊.
🔔 We expect a surge in volatility in the coming days — be ready for movement!