Every morning, I first take the kids to school, then come back to make breakfast, which is usually around 9:00. I open my computer and summarize yesterday's trading records in my trading system, looking for opportunities. I typically operate on more than ten crypto trades at a time, and I am busiest from 9:30 to 10:50 in the morning. The afternoon is generally quiet with fewer trading opportunities, and I can handle trades via my phone. If trading is slow, I won't stare at the computer and will take a break for my eyes.
In the afternoon, if I have free time, I usually go for a run in the park or woods, then pick up the kids from school, return home, and sometimes cook dinner or order takeout.
In the evening, I usually just do some trades, spending more time sharing and answering questions, as well as writing reviews! If trading is slow or there is a one-sided decline with few opportunities, I will drive to a deserted mountain pond to fish. As long as there is a mobile signal, I can trade on Binance while fishing, enjoying myself. In short, it’s all about being free and easy.

In cryptocurrency investing, maintaining account liquidity, i.e., 'having coins on the market, money in the account, and cash in the pocket', is an important safeguard against market uncertainty. Never go all-in; allocate funds reasonably, and master risk control strategies. This not only stabilizes your investment mindset but also effectively controls risk. Invest with spare money rather than borrowed capital; this is the foundation of investing. Master basic operational skills and thinking, cultivate the habit of recording and summarizing, and use the highs and lows of each operation as valuable experience to gradually develop information filtering and decision-making abilities.
In addition to solid technical skills, I also strictly adhere to the following six iron rules: grasp the elements of successful investing!
As long as retail investors adhere to the following six points, turning 100,000 into 5 million is not difficult. These six points may seem simple, but very few can truly achieve them. Here are the 'six iron rules' to ensure success in the crypto market, helping you navigate the market with ease!
1. Understand stop-loss and take-profit. Trading cryptocurrencies is for profit, not for holding forever. When market positions go wrong, decisively sell to avoid unnecessary losses. In the crypto space, do not be greedy when making profits, and do not hesitate when facing losses.
2. Do not pursue absolute highs and lows. The market always has lower lows and higher highs, which ordinary people find hard to grasp accurately. We just need to buy in the bottom area and sell in the top area, capturing the big trend.
3. Volume and price must be perfectly matched. An increase without volume or a new high without volume is often a signal of the main force unloading or a signal of upward exhaustion. It’s better to miss out than to chase volume, avoiding becoming a bag holder.
4. React quickly. When the market receives positive news, quickly find relevant sectors and projects. If you miss the first tier, promptly position yourself in the second tier to also achieve decent returns.
5. Learn to rest. The main uptrend of cryptocurrency prices is short-lived; the rest of the time is mostly in a state of consolidation or pullback. Grasp the main uptrend and learn to rest during other times to avoid losses from frequent trading.
6. A market crash is the biggest boon. A market crash often breeds greater opportunities. Be fearful when others are greedy, and be greedy when others are fearful. When the market crashes, do not panic; choose quality targets and build positions in a timely manner, waiting for a rebound.
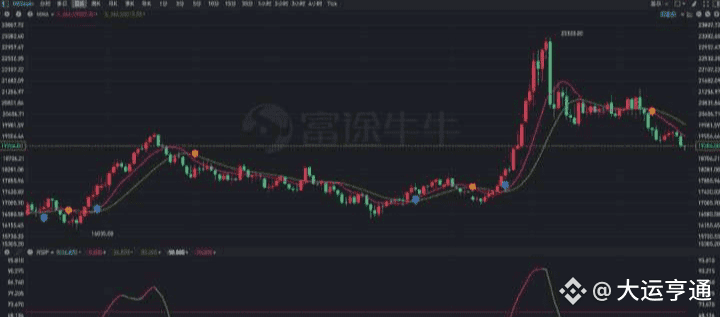
The market has been soaring, and some previous trading strategies have been revitalized. The simplest and most intuitive might be the so-called '400 times in a year' semi-wood summer - the semi-god's MACD trading strategy in the crypto space.
To put it simply, it’s just about finding opportunities for MACD continuous divergences.
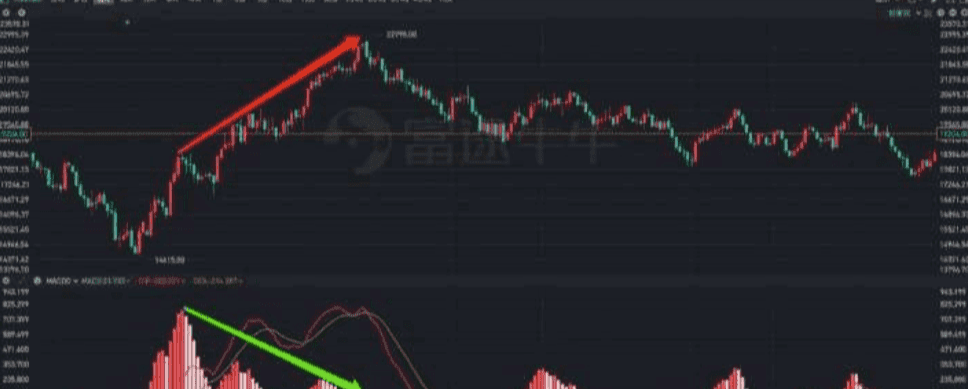
The above image is a good example that fully illustrates the two core points of this trading strategy: continuity and divergence.
What constitutes continuity?
When MACD is above the zero axis, a peak appears and does not drop below the zero axis but rises again to form another peak, or after dropping below the zero axis, it quickly crosses again and produces a peak; this is what is known as continuity.
What constitutes divergence?
The MACD peaks are gradually decreasing, but the stock price is gradually rising, indicating that the MACD trend and the stock price trend are inconsistent; this is what is known as divergence.
Of course, inconsistent trends can be divided into two situations: when the indicator declines while the stock price rises, it is a top divergence; when the indicator rises while the stock price declines, it is a bottom divergence.
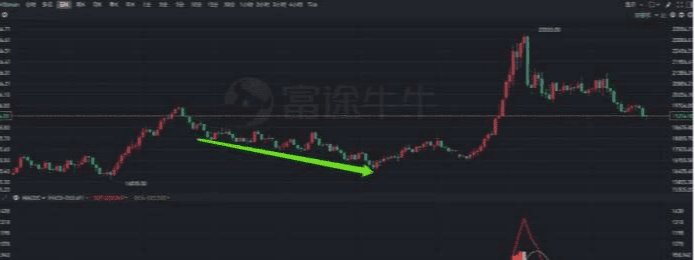
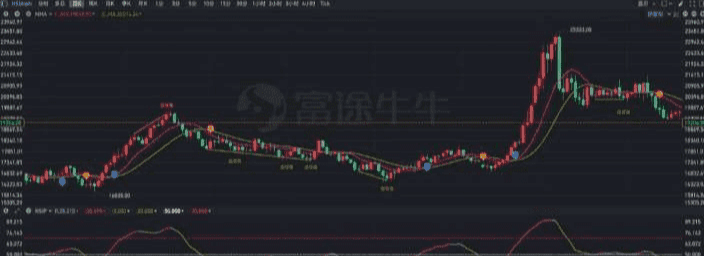
The above image is an example of a top divergence. Similarly, in the Hang Seng Index, bottom divergence had already appeared before the market began on September 24.
The semi-god trading strategy seeks to find opportunities where the MACD indicator shows continuous divergence.
First, modify the default parameters of MACD from 12 and 26 to 13 and 34, then look for consecutive divergences with significant differences between peaks and troughs. Short at top divergences and long at bottom divergences, then apply stop-loss based on the ATR with a parameter of 13.
Causes of Divergence
From the two screenshots above, it is evident that shorting at top divergences and going long at bottom divergences are indeed great opportunities. Everyone can test this strategy on the targets they are interested in to see if it can capture some significant opportunities.
In this process, two issues may arise: first, the built-in MACD indicator of the platform only has fast and slow lines and histogram, without adding divergence recognition, making it very inconvenient to verify the effectiveness of divergence signals when backtesting historical data; second, after backtesting data, it is likely to find that divergence signals are quite effective, but bottom divergences tend to be more effective than top divergences.
How to solve the problem of identifying divergence signals will be discussed later. Now, let's analyze the causes of divergence and why bottom divergence signals are more effective.
First, let's take a look at the code for the MACD indicator and analyze the logic behind its construction.
DIF: EMA(C, 12) - EMA(C, 26), COLORRED;
That's right, the original MACD indicator is that simple; implementing the so-called 'king of technical indicators' MACD only requires three lines of code.
In the first line, the difference between two moving averages of different time periods calculated based on the closing price is displayed as a curve.
In the second line, calculate the average again from the difference between the two moving averages from the previous step and display it as a curve;
In the third line, subtract the two and magnify the result, then display it as a histogram.
Thus, even if we have not studied the design principles of the MACD indicator, we can analyze the causes of divergence just from its code.
If a top divergence occurs, it means the MACD peaks are decreasing while the stock price is rising and reaching new highs. If this happens, it indicates that the MACD value is declining.
And the value of MACD is obtained by subtracting DEA from DIF, indicating that the gap between DIF and DEA is shrinking.
DEA is the average of DIF, which indicates that DIF is gradually decreasing or its increase is slowing. Additionally, due to the smoothing effect of DEA, when DIF's increase narrows, DEA may still rise, causing the difference between the two to shrink or even reverse.
DIF is the difference between two moving averages of different periods. As DIF gradually narrows or its increase slows, it indicates that the difference between the two moving averages is decreasing. Short-term moving averages are sensitive, while long-term moving averages are smooth; therefore, as the difference narrows, it can be seen as the slope of the short-term moving average starting to approach that of the long-term moving average.
The slopes of short-term and long-term moving averages begin to converge, which may be due to two reasons: the stock price has fallen or the increase has slowed. The condition for a top divergence is that the stock price is still rising and reaching new highs, so the narrowing difference between the two indicates a reduced increase, or stagnation in growth.
Similarly, the cause of bottom divergence can be deduced as a situation of stagnation in decline.
After a long period of volatility, once a trend forms, it is hard to reverse. After a top divergence forms, some profit-taking funds may cash out, but those who did not believe at first and are now just starting to believe will gradually enter the market. Although momentum has weakened, the trend still exists, and after a top divergence, there may be another top divergence, meaning the stock price may form higher highs.
Similarly, after a bottom divergence occurs, it is also possible to form lower lows. However, compared to increases, declines often happen quickly and with greater amplitude, especially after several rounds of panic selling, where people become numb to negative news, and there’s little left to drop. At this point, most remaining participants are likely steadfast holders, and coupled with the psychological advantage of buying low, a strong rebound is often triggered, making bottom divergence signals more likely to materialize.
Identify Divergence
When the stock price reaches a new high but the indicator does not, it is called a top divergence, indicating a weakening of the bullish trend strength, and the market may experience a top reversal; when the stock price reaches a new low but the indicator does not, it is called a bottom divergence, indicating a weakening of the bearish trend strength, and the market may experience a bottom reversal.
Since it is 'potentially reversing', it indicates a type of left-side trading. If the trade is still a contract, it is understandable why the semi-god can achieve such high returns with this strategy.
Of course, since it is left-side, there may be situations such as 'top within a top, bottom within a bottom, and divergence followed by divergence'. Therefore, the semi-god trading strategy also specifically includes ATR-based stop-loss to avoid trading against a strong trend, which could lead to zeroing or liquidation risks.
There is both an entry signal and a stop-loss rule, which logically makes this a relatively complete trading strategy. However, the problem is that if one relies on the naked eye to identify continuous MACD divergences, the efficiency will likely be very poor.
Although TradingView has related indicators to assist trading, there are very few toolbox-type indicator tools in domestic trading software. Most just have flashy names, giving the illusion that one can make money just by trading based on indicator signals.
But we all know that for different markets, different targets, and different times, the trading signals must be treated differently.
In a strong trend market, the KDJ indicator may remain in the overbought or oversold range; in a volatile market, moving average indicators may experience repeated golden and death crosses. If one relies entirely on a single signal, they may end up losing everything after some time.
Therefore, technical indicators should actually be seen as auxiliary tools, primarily serving to enhance efficiency. For example, for continuous MACD divergences, if we can use technical indicators to automatically identify this pattern, it can help us better seize these opportunities.
There are three key points in identifying divergence: triggering mechanism, time range, and judgment method. In previous articles, we introduced a simple method for identifying divergences related to MACD color changes.
This identification method is very simple: use the golden cross and death cross of MACD as the trigger mechanism, use two golden crosses/death crosses as the time range, and then judge whether divergence has occurred based on the trends of DIF and stock prices during these crosses.
This actually belongs to a kind of opportunistic method, which can be barely used for a rough understanding in general cases, but it is obviously not suitable for identifying signals based on the semi-god trading strategy.
For example, a continuous top divergence refers to several gradually lowering peaks, and there is no pullback below the zero axis between the peaks, or if there is a pullback, it only slightly touches below the zero axis.
Therefore, its triggering mechanism is to first find a peak, then trace back to see where the previous peak is located, whether there are any parts below the zero axis between the two peaks, and if so, check whether the number of histogram bars below the zero axis exceeds the threshold, and finally, determine whether both peaks are descending while the corresponding stock price is rising.
Similarly, continuous bottom divergences require first identifying a trough, then tracing back to the last trough to see if there are any parts above the zero axis between the two troughs. If so, the number of histogram bars above the zero axis must exceed a threshold. Finally, judge whether both troughs are rising while the stock price is falling.
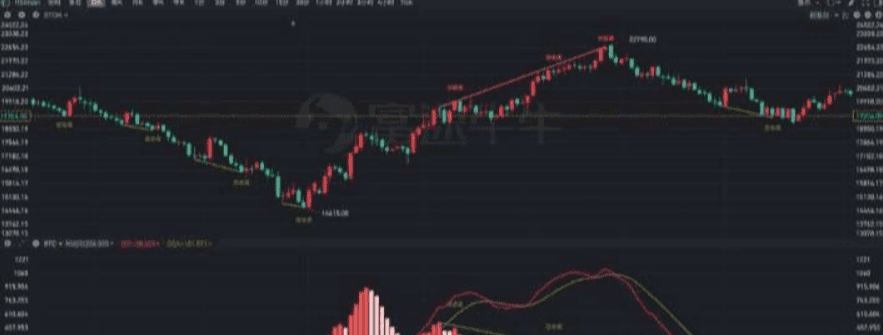
Comparing with the screenshots provided at the beginning of the article, we no longer need to manually draw lines to measure whether continuous divergence has occurred. By using custom technical indicators, we can identify whether MACD has diverged and connect peaks and troughs in the subgraph, while connecting the highest or lowest prices corresponding to MACD peaks and troughs on the main chart. This way, divergence can be identified at a glance.
Of course, since these are custom indicators, the conditions for continuous divergence can be set according to personal preferences, such as whether two or three consecutive peaks and troughs should appear, how many histogram bars are below the zero axis between peaks, and how much the difference between consecutive peaks and troughs needs to reach—all of these can be adjusted.
Identify trends
Trading strategies based on divergence will enter positions before the trend is fully confirmed, characteristic of left-side trading. Therefore, ATR-based stop-loss is essential as an important component of the semi-god trading strategy.
However, we can completely combine this with other technical indicators to further reduce the potential risks brought by left-side trading. MACD measures the strength of trends, while the trend itself can naturally be measured using moving average indicators.
Generally speaking, most identify trends based on the cross of short-term and long-term moving averages. However, there is a longstanding issue: if the two time parameters are too close, the two moving averages may cross frequently, leading to a large number of invalid signals; if the time parameters differ too much, the timing for entering and exiting trades will be severely lagged.
Therefore, we can adopt such a method: choose a personal preferred time parameter, then select different moving average algorithms to derive fast and slow lines.
For example, we first calculate MA10 using the closing price, and then calculate the EMA10 of MA10. This simulates the calculation principles of DIF and DEA, resulting in two fast and slow lines. Based on the intersections of these two lines, we create buy and sell signals.
Of course, this method, compared to traditional double moving averages, has only one time parameter, but it inevitably faces the issue of needing to filter out invalid signals.
The market is mostly in a state of volatility; therefore, we can use whether an asset is overbought or oversold as a filter for moving average crossover signals.
For example, when the dual moving averages form a golden cross, and the RSI indicator is within the 50-70 range (above 70 is considered severely overbought, do not chase highs) and is rising, it is regarded as an effective buy signal; when the dual moving averages form a death cross, and the RSI indicator is within the 30-50 range (below 30 is considered severely oversold, do not chase lows) and is falling, it is regarded as an effective sell signal.
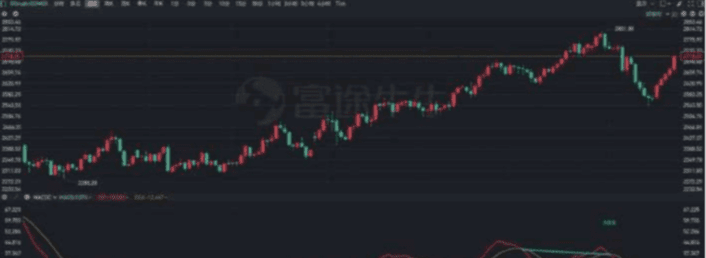
At the same time, further restrictions can be placed on the candlestick lines: for longs, the minimum price must be above the fast line; for shorts, the maximum price must be below the fast line. This way, the effect shown in the following image can be achieved.
Optimization and Iteration
Thus, we have constructed a trading strategy using the most basic technical indicators: moving averages, RSI/KDJ, and MACD.
For those who are very patient and can trade contracts, options, and futures, pursuing a high win rate, they can patiently wait for the emergence of continuous MACD divergence signals. Other traders can trade short based on moving average crossovers + RSI filtered signals.
Moreover, the beginning of a market trend will inevitably trigger the crossover of two moving averages, while the end of a trend often forms MACD divergence.
Therefore, by combining them, we can observe when to take profits based on divergence signals after entering positions based on moving average crossover signals; and after entering from the left side using divergence signals, we can confirm from the right side using moving average crossover signals.
Thus, this is actually a complementary system, although there is still significant room for improvement regarding signal prioritization, the compatibility of short-term and long-term, historical data backtesting, and parameter tuning.
We welcome friends in the crypto community to provide more feedback during the use of indicators so that we can further optimize and iterate.
The current market is indeed in a bottoming phase. If you have no direction, remember to follow my lead; standing on the shoulders of giants can save you ten years of detours!

