After a tumultuous summer, the crypto market is quietly brewing a new storyline. Whether you're a seasoned coin holder, a newbie on-chain surfer, or a new entrant in the circle, the upcoming weeks of on-chain movements are truly worth a closer look.
#TOSHI 's pattern resembles a cheetah poised to spring, #ETH is being firmly suppressed at the $4,000 door, the surge of tokenized stocks is redefining on-chain assets, while familiar faces #AVAX✈️ , #ALGO , and #sui have quietly completed preparations for a technical reversal...
🤔 So the question now is: which coins will rebound? Who is being suppressed? Which narratives are worth positioning in advance? This article will help you understand market trends and potential rebound coins, providing a comprehensive perspective on the current rhythm and pulse of the crypto market, suitable for saving and sharing with the community ~
Is Toshi about to rebound? This wave might be a "false drop for true absorption," and $0.007 is not a dream?
Toshi has been a bit "emotional" recently 😅— just a few days ago it surged over 30%, but now it has given you a 5.6% drop, causing a lot of short-term players' hearts to race 💔.
But don't rush to exit, there might be a "washout-style" false breakout → real rebound happening behind the scenes, as smart money is quietly positioning 📊.

⏳ Toshi: Short-term sharp drop ≠ structural collapse?
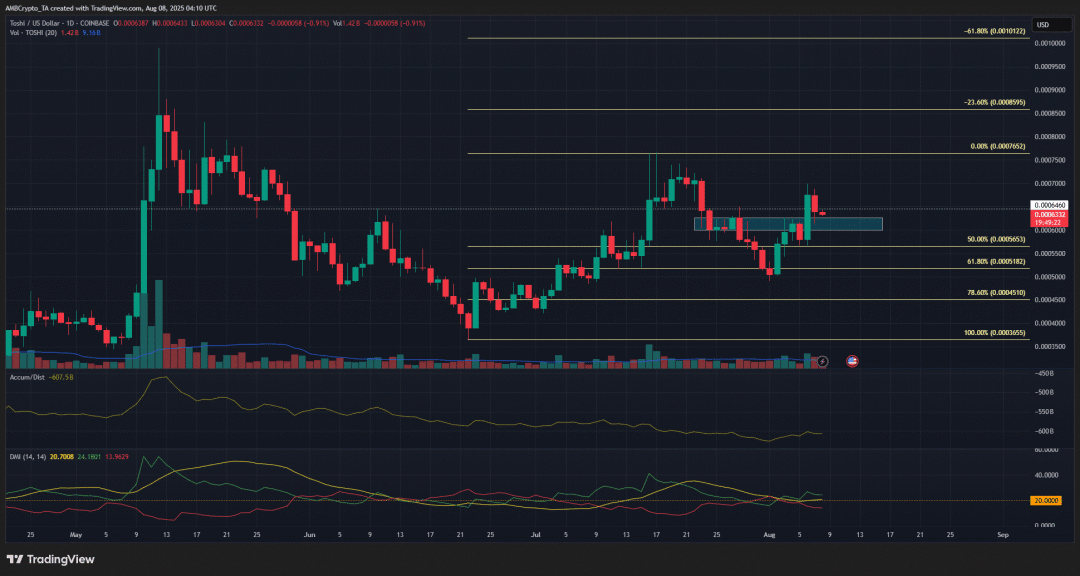
First, let's look at the timeline: this wave of Toshi's market started on Saturday, August 3rd, and the upward trend continued until Tuesday, August 6th, when the increase peaked at over 34%, grabbing plenty of attention 👀.
But after the peak, one must calm down, leading to a significant price correction. As of now, it has dropped another 5.61% in the past 24 hours, causing many to begin questioning their existence: Is this the end of the rally?
However, if you open the chart and look closely, you'll find things may not be that simple.
📊 Technical aspect: descending triangle + support testing.
From the 1-hour candlestick chart, Toshi is actually forming a very typical descending triangle, and the key price level between $0.0006 ~ $0.00062 has been tested several times 🧪.
What does this indicate?
👉 This area may be the "bottom line that the main force wants to defend."
From the chart, this position was previously resistance, and now it has turned into support, likely indicating a "false drop washout" operation.
The DMI indicator currently shows a slight upward trend forming, which is a positive signal ✅.
However, the A/D (Accumulation/Distribution) indicator is relatively weak, indicating that during this wave of increases, the buying power has not been particularly strong. This explains why the market has been so volatile—insufficient momentum makes it prone to being smashed.
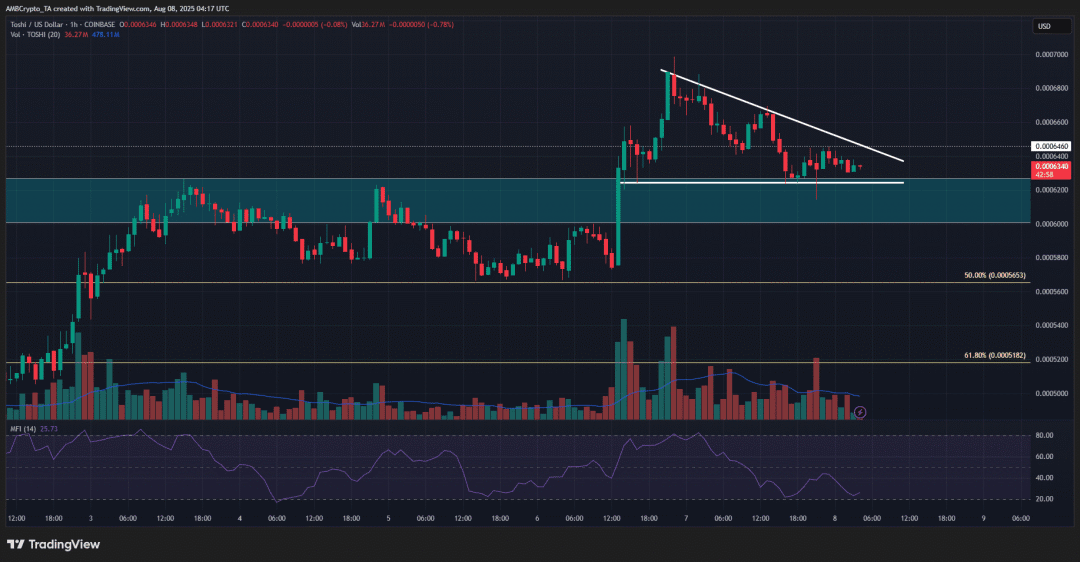
More importantly, the MFI (Money Flow Index) also shows insufficient funds entering the market, indicating that the market is currently on the sidelines, with a strong short-term speculative atmosphere and weak long-term bullish confidence 📉.
Conclusion: If the bulls want to continue rising, they must first lift the buying pressure!
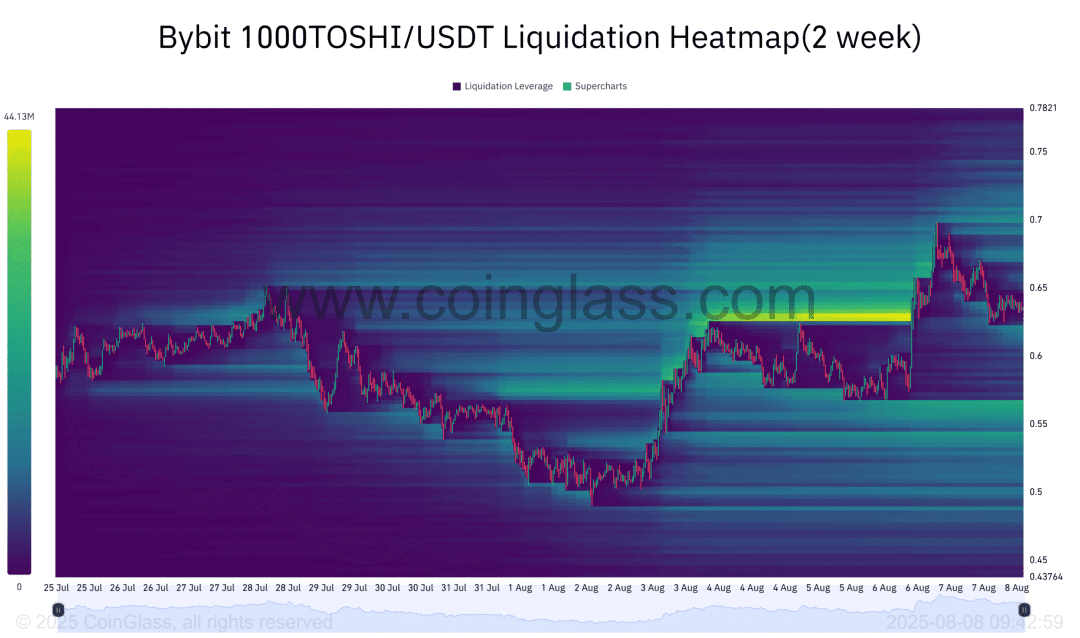
🔥 Heatmap reveals: Is there a "capital attraction" above 0.006?
From Coinglass, in the past two weeks, Toshi's liquidation heatmap has shown a very interesting discovery:
👉 A large amount of liquidity is gathering above the $0.006 area!
It's like a "magnet zone," where funds are "lining up" waiting for the market to sweep a wave of liquidity past, and then directly surge 💥. This interval coincides with the previous high of Toshi's daily chart and the area of concentrated transactions.
So, experienced friends understand:
Before rising, main forces often initiate a wave of "false drops" to wash out panic sellers, and then can charge ahead 🚀.
Let's look at the key summary 👇.
✅ The structure remains: although the volatility is large, the technical structure has not been broken, and the triangular pattern's support area is still being defended;
⚠️ Insufficient momentum: fund inflows are a bit weak, and if there is no significant volume increase for an upward attack in the short term, the market may get stuck in a tug-of-war.
🎯 Potential target level: Once it breaks through $0.00065 ~ $0.00066, it could hit $0.007 or even higher;
📉 Breaking the warning line: If $0.0006 is lost, it may dip in the short term, so set your stop-loss carefully.
So, if you are a short-term player, you can pay attention to whether the support at $0.0006 is solid and whether there is strong volume for a counterattack. If you are a trend trader, then focus on the moment of the triangular breakout 📈.
📌 Keywords: key support level $0.0006, weakening MFI, good potential for patterns, liquidation data supports rebound.
🧠 ETH and Solana: Does the wave of tokenized assets lead to a new round of on-chain warfare?
While you are feeling "bored" with BTC oscillating around 60K, the "tokenized asset" track on the other end of the chain has quietly ignited! This wave of tokenized stock explosions is not simple! If you still think that on-chain assets only include NFTs and DeFi, then you are OUT— the "relocation" of traditional stocks on-chain has just begun to go wild.
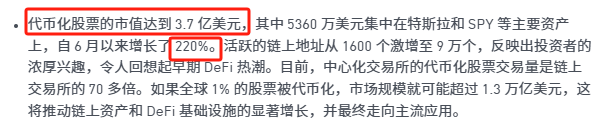
💥 According to the latest report from Binance Research, since June, the market value of tokenized stocks has skyrocketed by 220%, reaching $370 million. You heard it right, a 220% increase is no longer just a niche narrative.
🔥 Tokenized stocks have exploded, with users surging by 56 times! From only 1,600 active on-chain addresses, it has surged to over 90,000. This wave of growth has analysts at Binance Research exclaiming, "This is simply a replica of the 2021 DeFi boom!" Investor interest is skyrocketing, and on-chain stocks are becoming the new darlings of the market.
🚀 Speaking of the star platform for tokenized stocks, Backed Finance's xStocks cannot be overlooked, as it has been particularly popular outside of Europe and America. According to data from Dune Analytics, xStocks' total trading volume has already surpassed $2 billion, demonstrating strong market vitality.
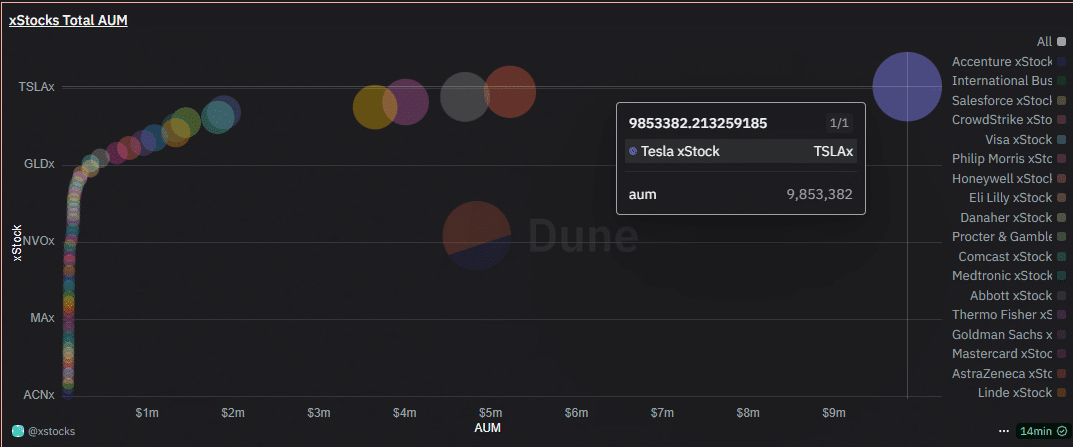
💎 Tesla (TSLA) continues to hold the top position, with a number of shareholders reaching 11,000, followed closely by the S&P 500 Index (SPY) and Nvidia. Circle and Apple have also successfully squeezed into the top five most held stocks on-chain.
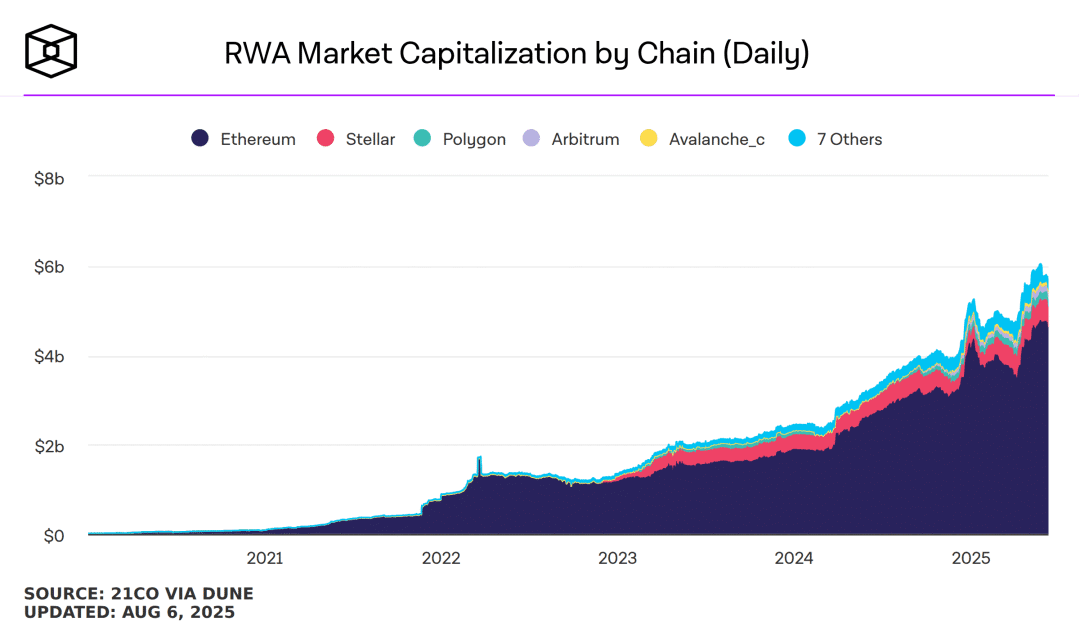
🌐 Although xStocks has made its debut in the Solana ecosystem, launching through platforms like Kraken, ByBit, and Jupiter, the overall settlement players in the tokenized asset market are still dominated by Ethereum. To date, Ethereum controls $4.6 billion of the nearly $5.76 billion in tokenized assets, demonstrating overwhelming strength.
🔮 The trend of tokenization will further boost the demand for ETH and SOL.
🏛️ Imagine: even if only 1% of the stocks globally are tokenized, the market size will exceed $13 trillion. Therefore, whoever can accommodate more TradFi assets on-chain demand may be the big winner in the next bull market.
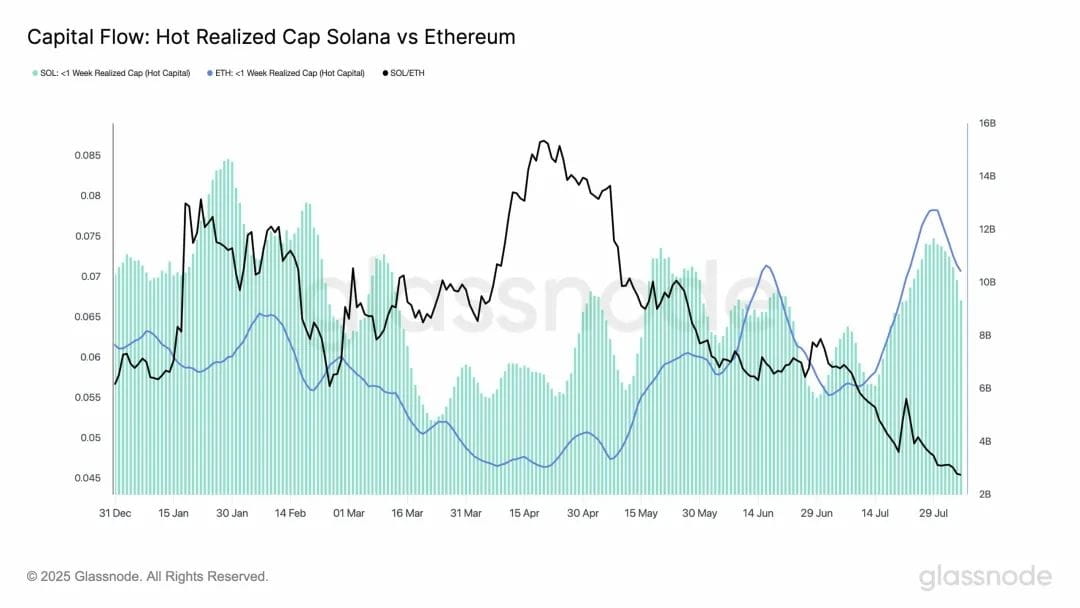
However, also do not ignore the trend of fund flows—Solana's fund inflow has clearly slowed down, beginning to be replaced by Ethereum. The SOL/ETH exchange rate has also dropped to an annual low, and the market generally expects that, benefiting from the stablecoin and tokenized asset boom, Ethereum will significantly outpace Solana in the second half of 2025. Whether Solana can catch up remains a suspense...
📌 Keywords: ETH dominance, SOL underperformance, xStocks popularity, institutional entry, and the big trend of tokenized assets has begun.
🚧 Why is ETH "locked" at $4,000? Is there a hidden hand behind this from hedge funds?
Everyone knows ETH reached a high of $4,800 in 2021, and has been above $3,500 for a long time, but always misses the mark at $4,000. Why? Is it really a hard "ceiling"?

😈 A market analyst named Glen Goodman pointed out that hedge funds might be manipulating things behind the scenes.
🧨 Hedge funds have issued a large number of options with a $4,000 threshold, acting as option "sellers"; they can only profit from premiums and avoid losses if ETH does not break above $4,000.
🧨 Whenever ETH approaches $4,000, they will aggressively short it, pushing the price down to maintain profits.
🧨 So we see that $4,000 has become the "curse" threshold, and every time it approaches, it suffers from invisible "divine retribution."
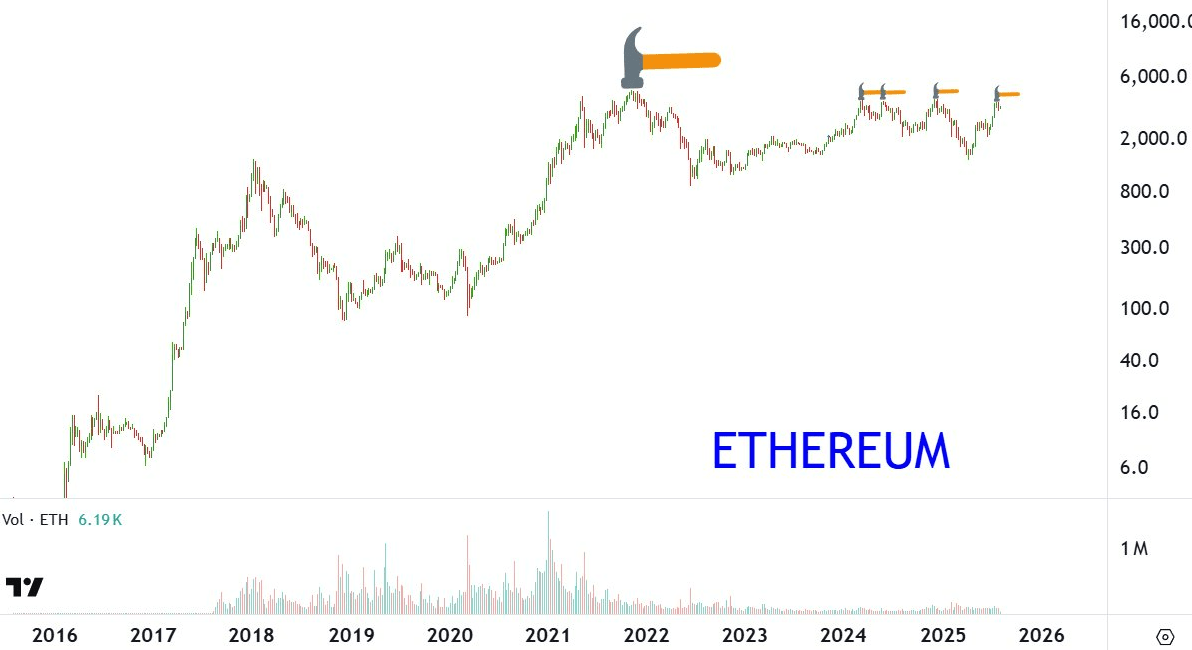
But the good news is: this mountain is about to be toppled. Goodman pointed out that once ETH truly breaks through $4,000, not only will option buyers start making money, but hedge funds will also face huge losses— the rebound will be even more rapid.
📌 Keywords: strong resistance at $4,000, option manipulation, short suppression, and after a breakout, it may quickly rush to historical highs.
🔄 ALGO, AVAX, SUI: The "three horses" that may reverse next week, don't ignore the technical patterns!
When we discuss the "on-chain war" between ETH and SOL, don't forget these long-gestating "dark horses."
🟢 Algorand (ALGO).
Recently broke through a strong double bottom structure, with the neck line at $0.26, and after completion, it surged to $0.34, achieving a 90% target increase.
Although it later retraced to $0.22, it quickly rallied back to the neck line area, with bulls beginning to regain control. If it can stabilize above $0.27, testing $0.34 is not a dream.
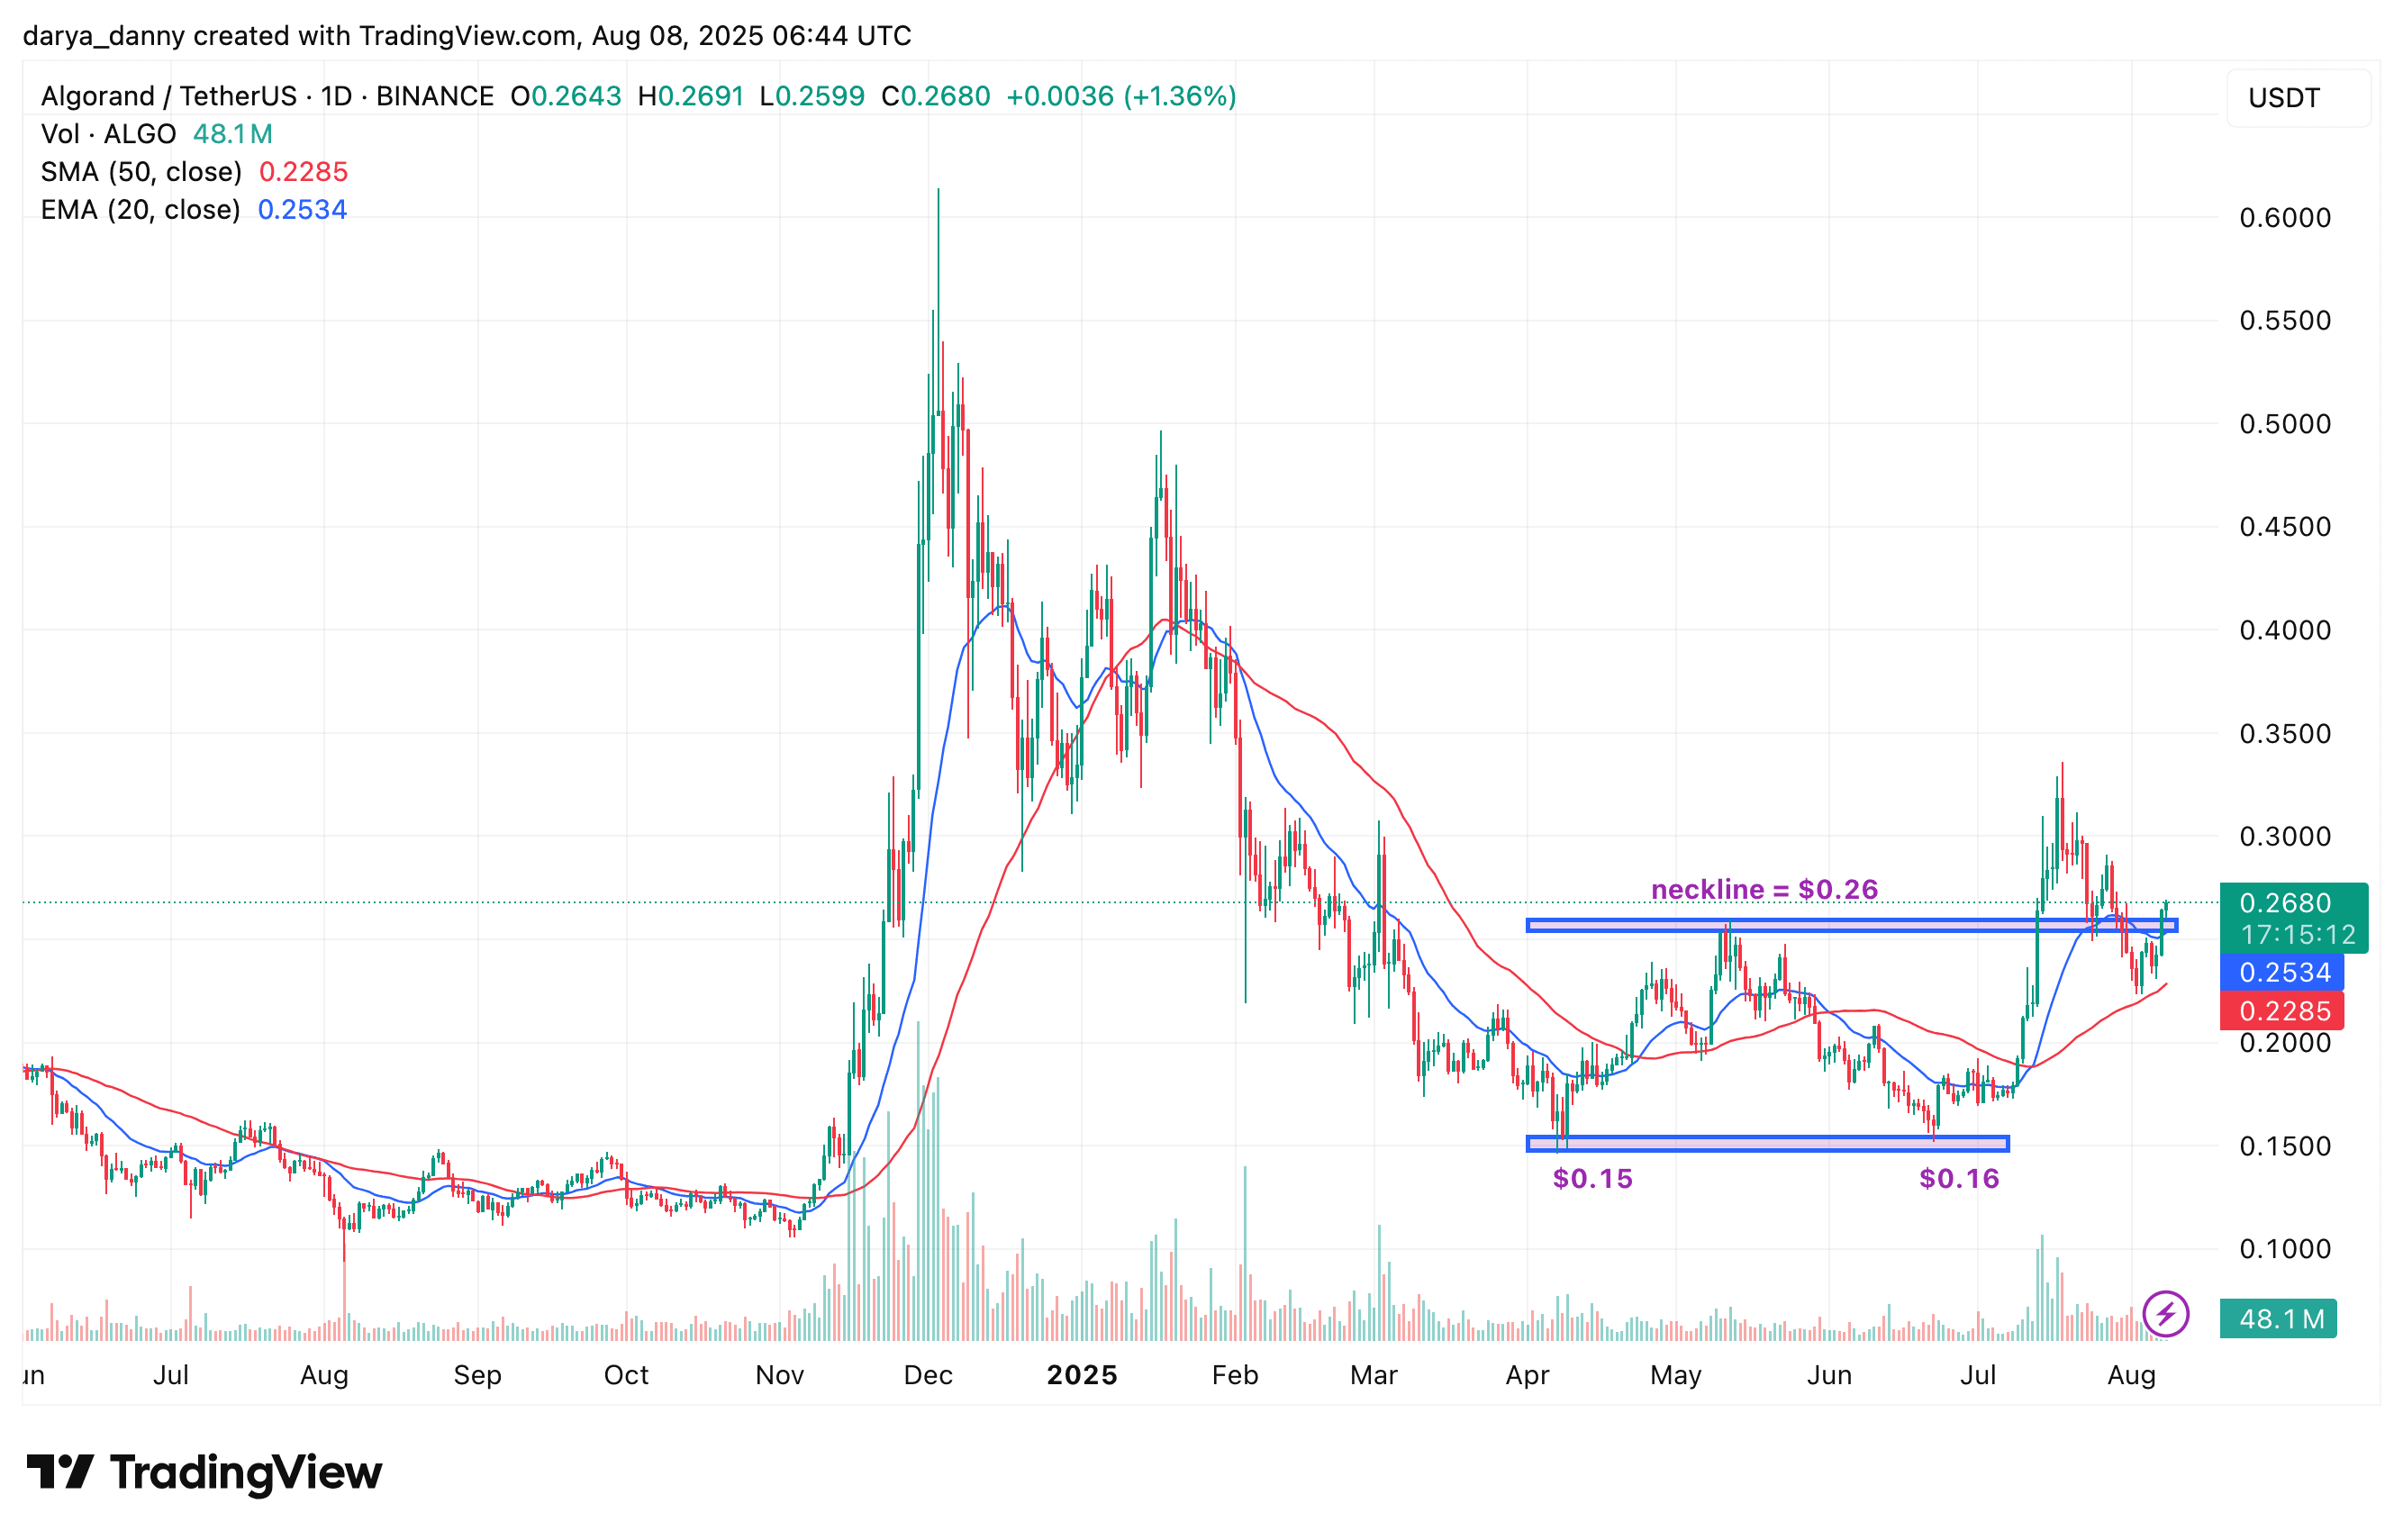
📌 Technical highlights: strong rebound structure, signs of accumulation, successful support at the critical neck line.
🔴 Avalanche (AVAX).
Unlike ALGO, AVAX's double bottom formation has not broken through; after repeatedly testing around $27, it has fallen back to $21 but has gained support from the 50-hour moving average and is currently rebounding, challenging the 20-day moving average.
This means that as long as there is another volume breakout above $27, it could trigger a significant reversal. The short-term space to the breakout point is only 17%.
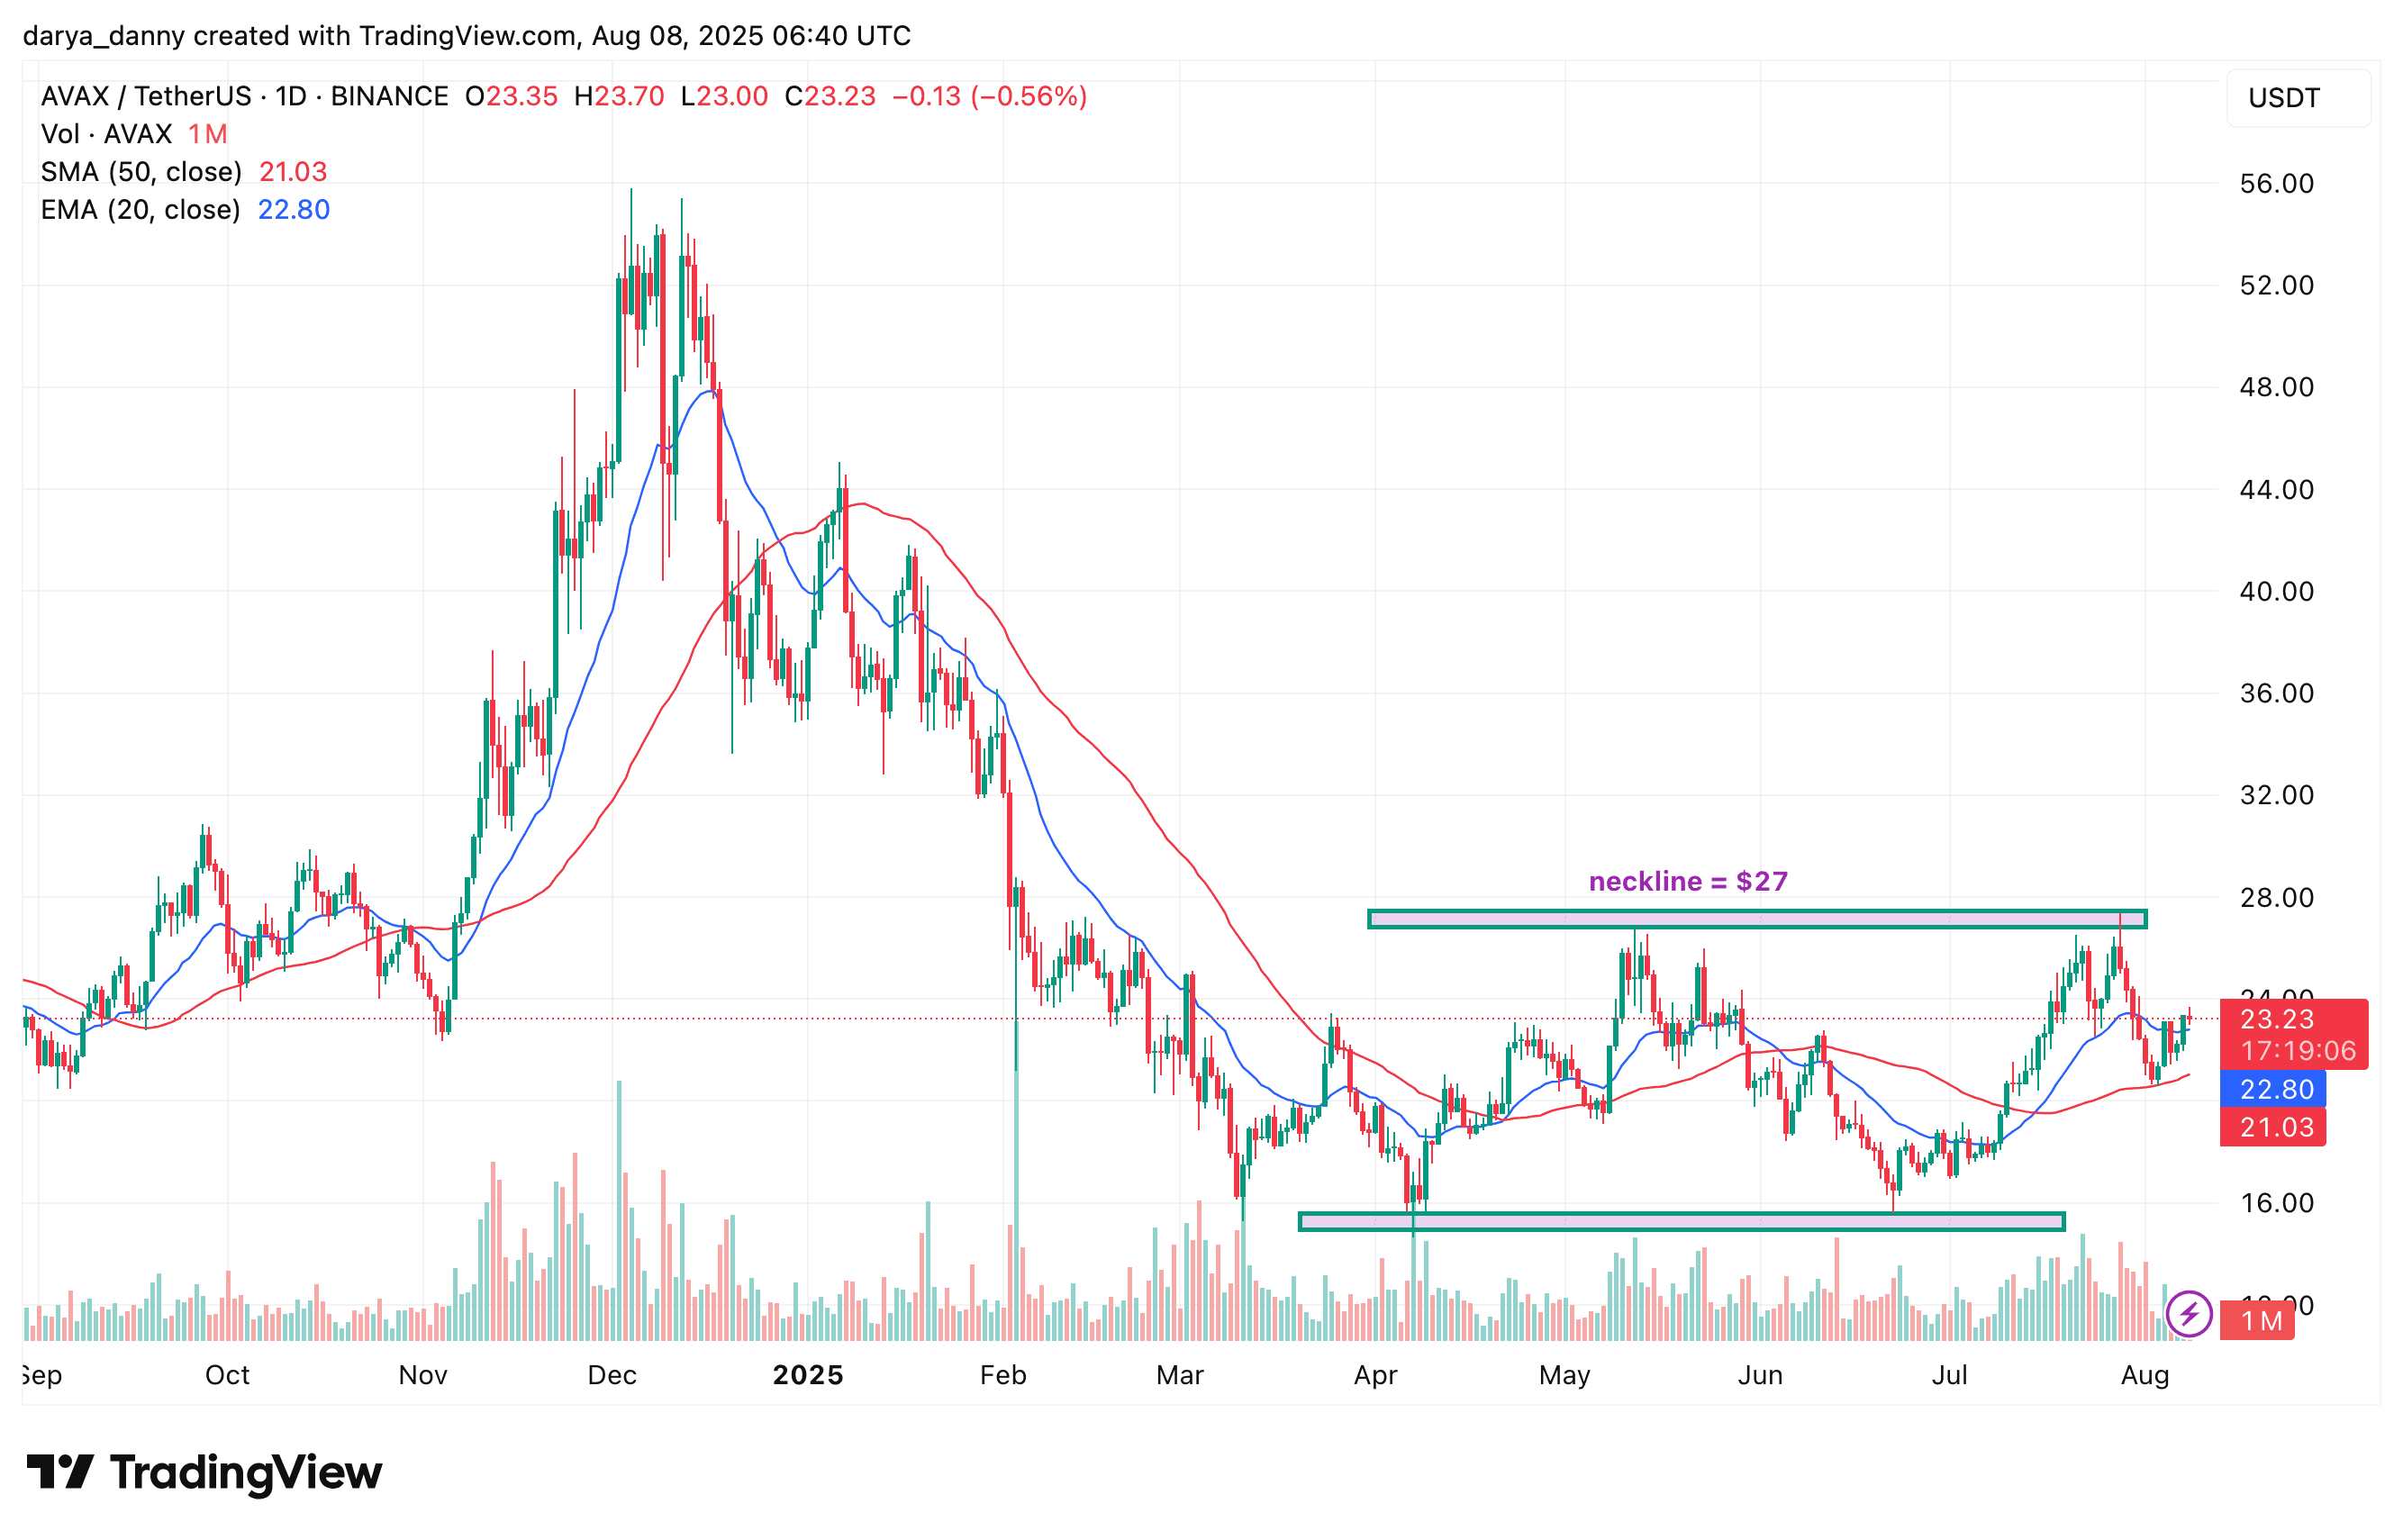
📌 Technical highlights: double bottom pattern at the brink, clear moving average support, waiting for volume confirmation of the breakout.
🔵 SUI (SUI).
Quietly becoming one of the cleanest coins in recent charts.
Currently, the SUI price has broken through the 20-day moving average and is moving towards the $4.30 - $4.40 range. The three moving averages (7-day, 20-day, 50-day) are showing a typical bullish convergence signal, indicating that the previously formed bearish risk has been lifted.
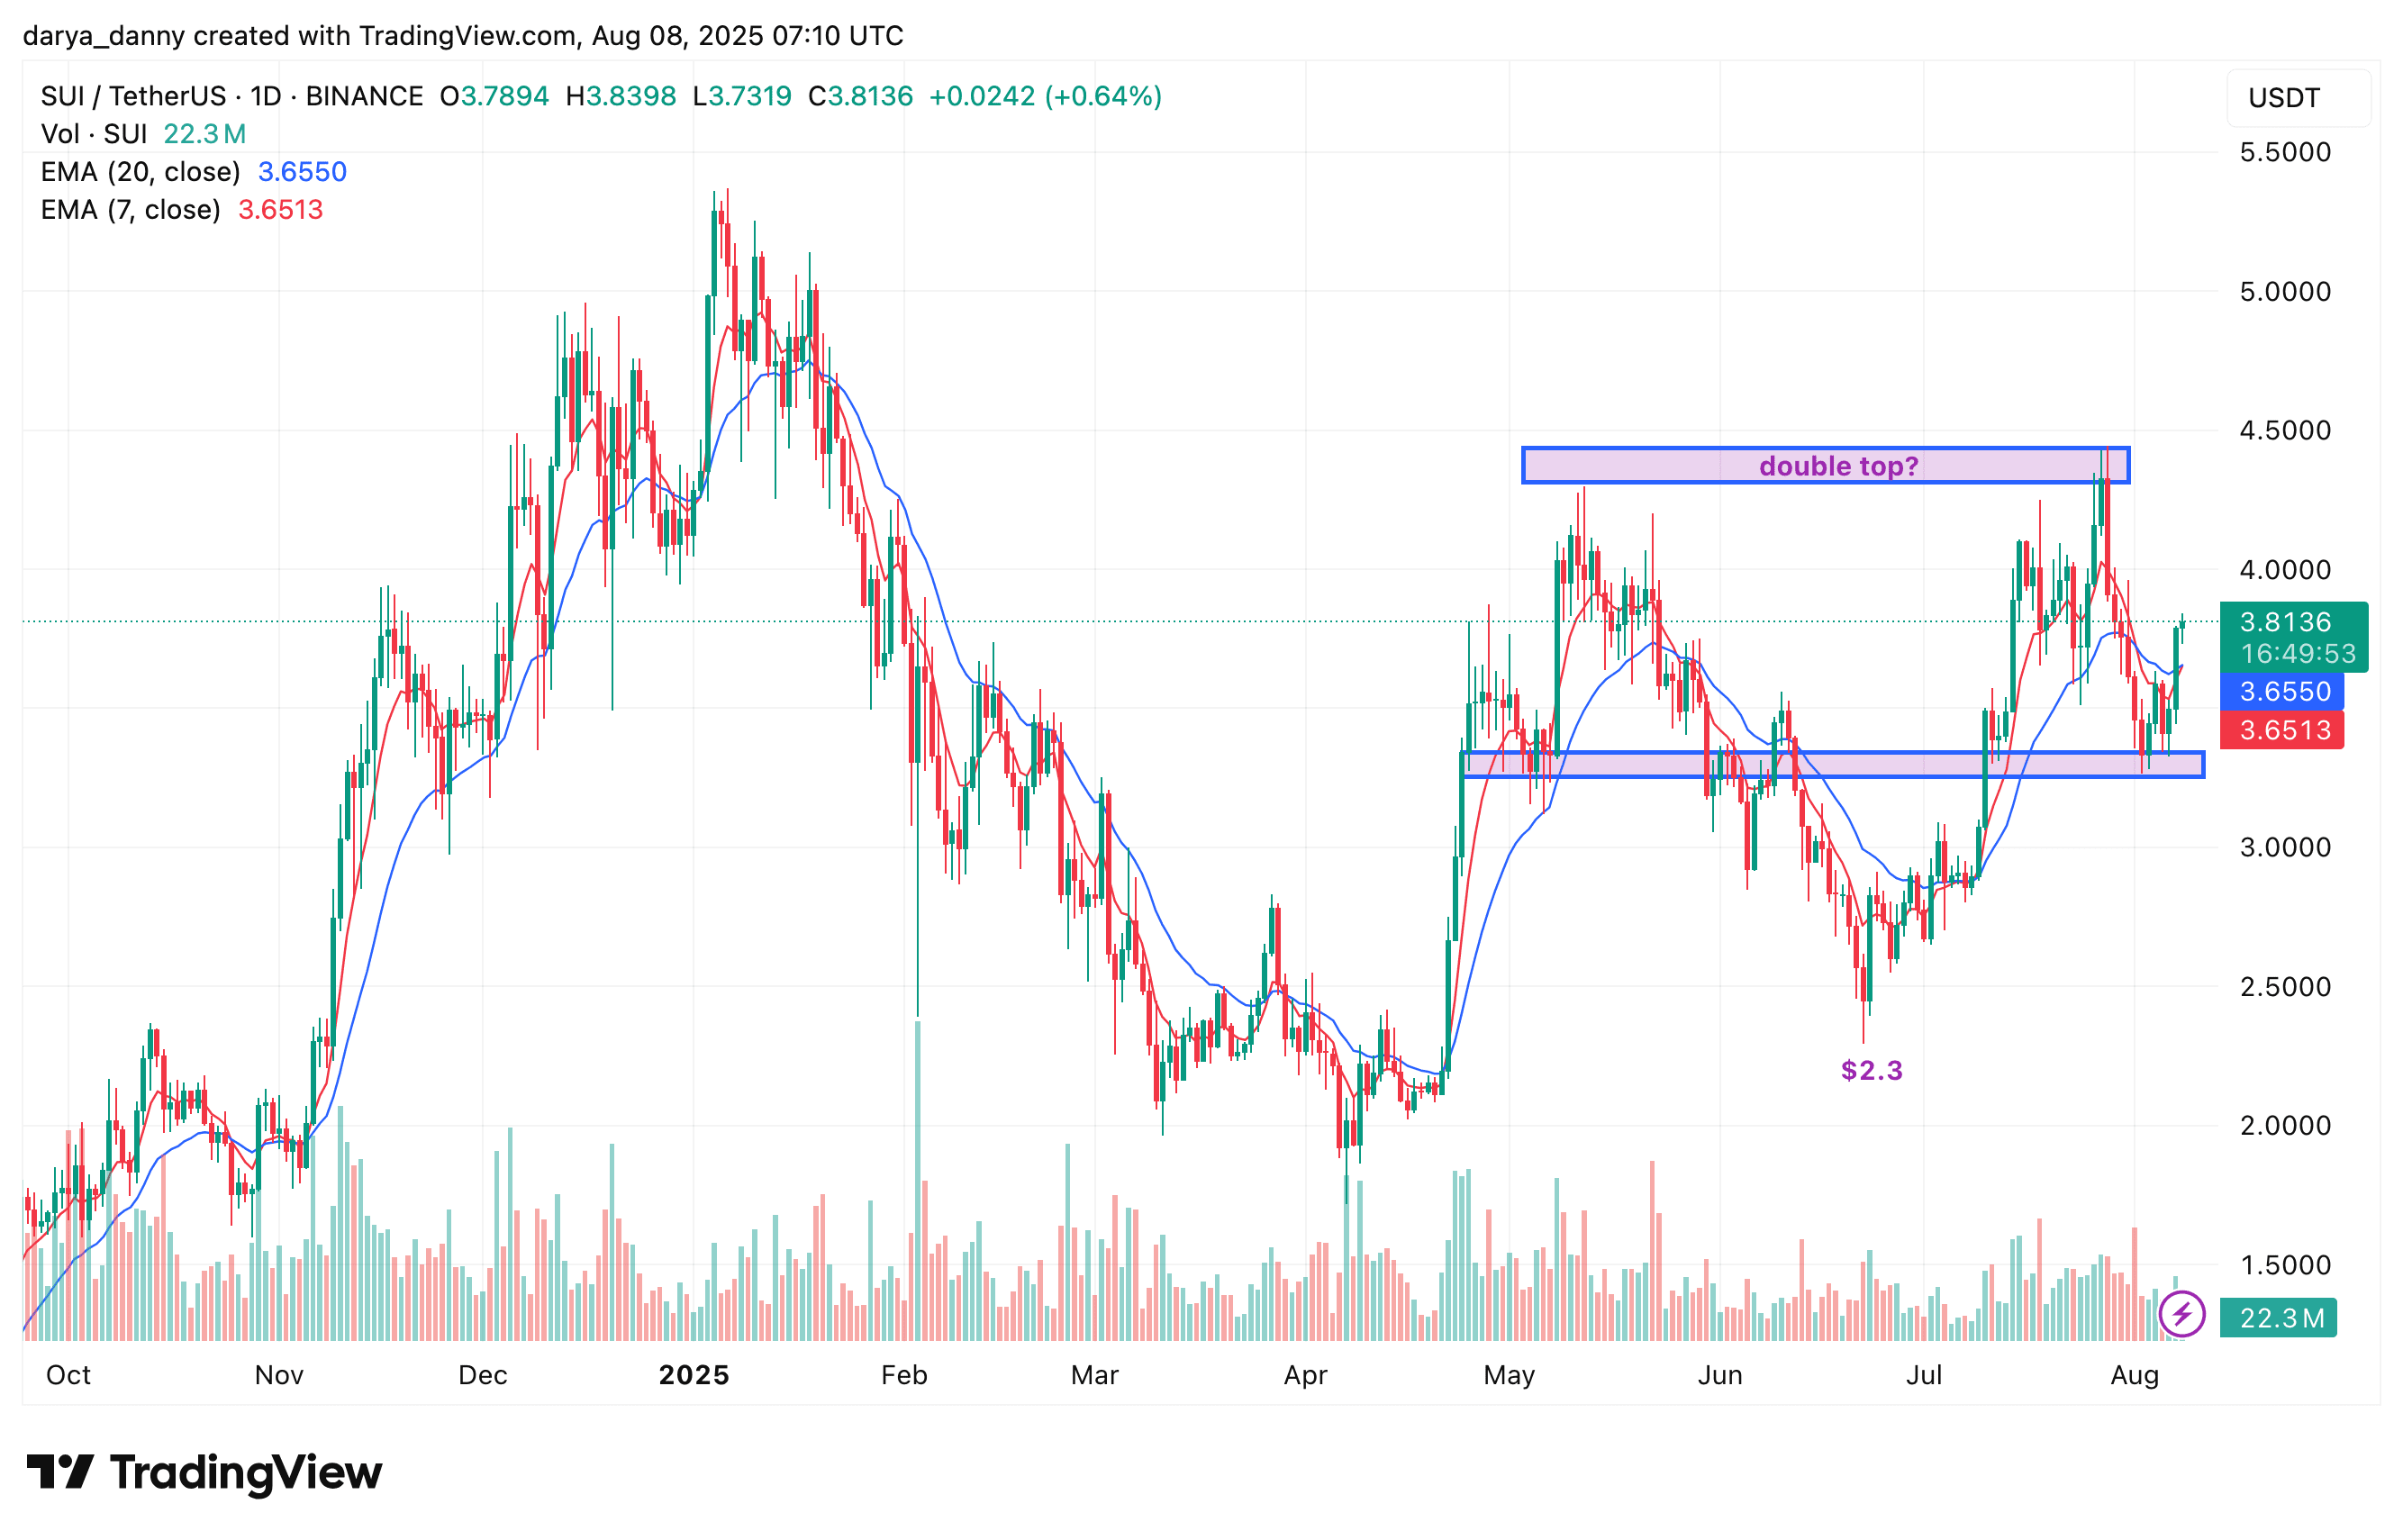
📌 Technical highlights: bullish moving average convergence, strong short-term momentum, with a mid-term target in the $4.40 area.
✅ Summary: This summer, patience pays off for the winners.
👀 Whether it's Toshi's structural buildup, ETH's battle to break $4,000, or the rise of tokenized assets behind the ETH/SOL showdown, along with reversal opportunities for ALGO, AVAX, and SUI, this market is accumulating energy.
Now is not the time for random FOMO, but it is definitely a good time for observation and positioning.
📊 Want to catch the next rebound?
Keep an eye on the liquidation heatmap (like Toshi).
Focus on on-chain real users and liquidity trends (like xStocks).
Identify key structural levels and moving average convergence (ALGO, AVAX, SUI).
Understand the capital game behind options (ETH).
Many understand the trend, but few follow the rhythm.
The crypto space changes rapidly, and opportunities coexist with risks. Learning to enter and exit strategically, while protecting your principal, is the key to steady progress and accumulating wealth and growth. ✍️
Remember to DYOR, manage risks well, and wish everyone smooth sailing in the crypto world! 🌊
Like and share, follow me for more insights into the crypto space! Let's keep pushing!