Friends in the crypto world! The market has been exceptionally lively recently, with major cryptocurrencies and popular altcoins putting on spectacular shows of ups and downs.
From the slight rise in prices on Solana's #Bonk to the important technical signals in #Xrp🔥🔥 ; from Ethereum's #ETH突破4000 breakthrough of key resistance to Cardano's (#ADA! ) strong rebound, to #TRUMP coins rebounding in key areas—multiple coins are advancing together, with opportunities and challenges coexisting, making it hard not to keep up with the rhythm! ✨
The entire crypto market is full of highlights and opportunities. Let’s analyze these assets' latest dynamics together, see where it’s worth buying, and where to be cautious, helping you become the most knowledgeable one in your circle! 🐂💥
1. BONK: Small coins are also crazy; though the price is volatile, the potential remains strong 🚀
Let’s start with the recently popular memecoin on the Solana chain—BONK.
Although the price fluctuations are not large, with a 24-hour increase of 1.7%, this operation has significant points of interest. According to the latest data, BONK's price range is between $0.0000248 and $0.0000272, with the current price at $0.0000271.
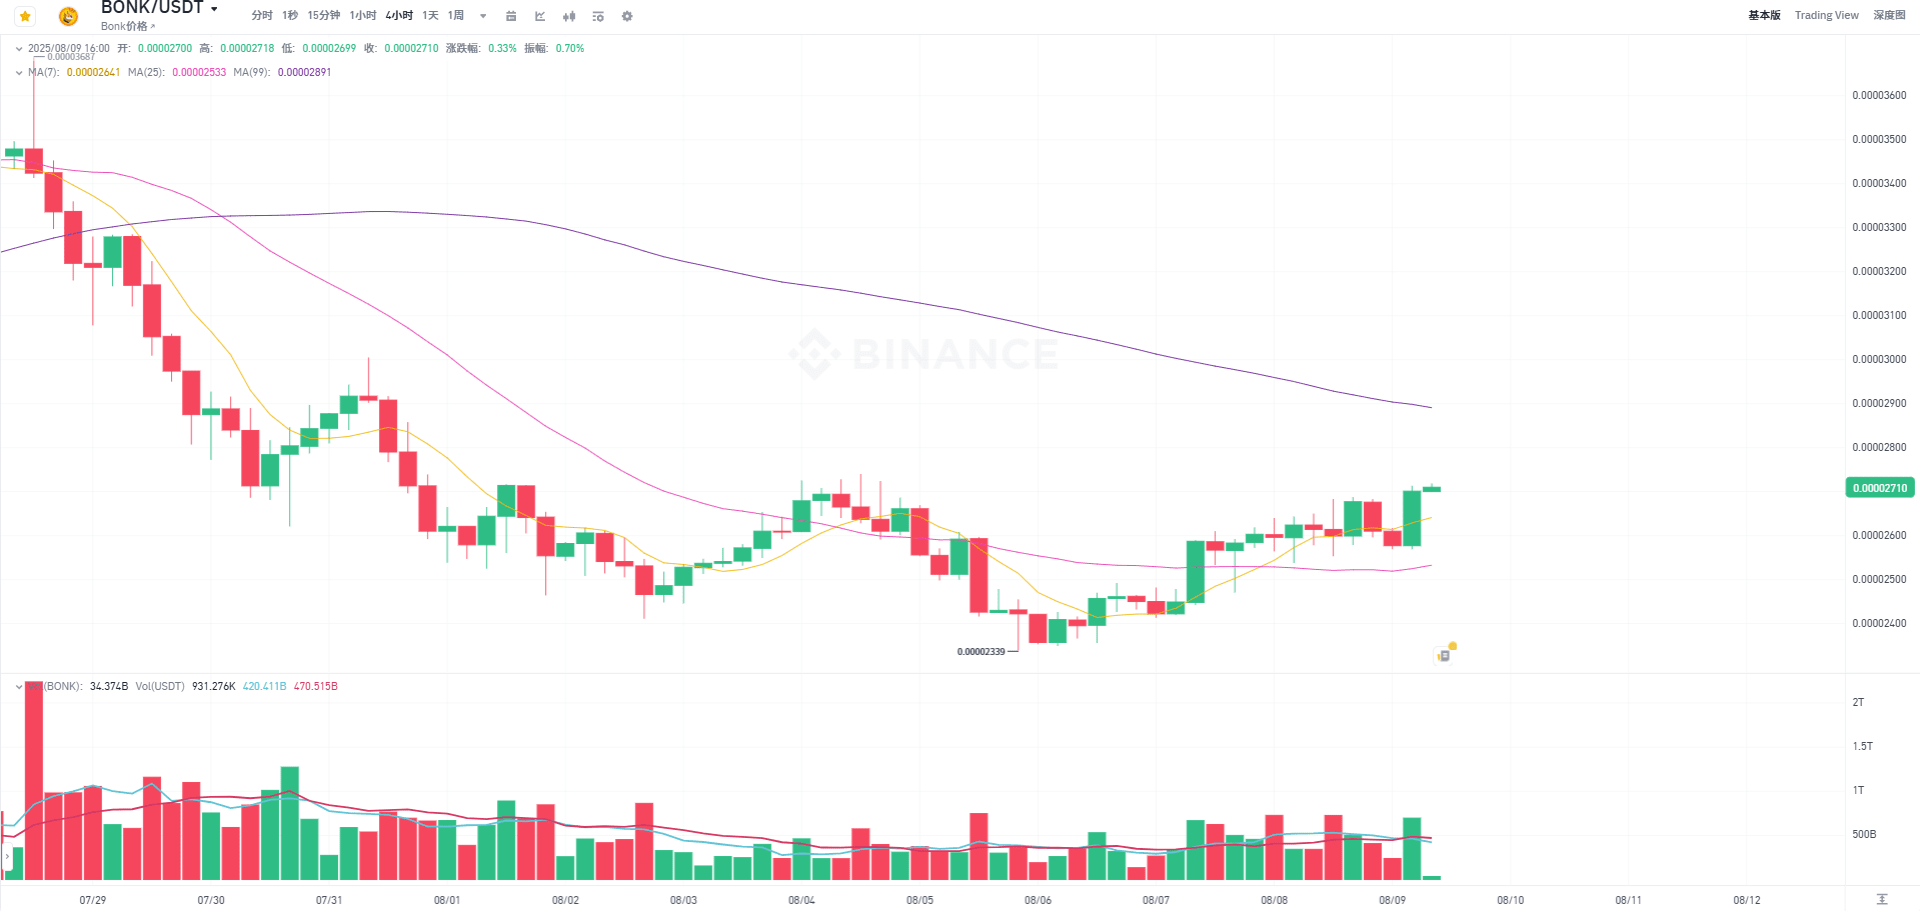
Notably, around 16:00 UTC on August 7, BONK began to rebound from its low, peaking during the European morning. That day, the trading volume exceeded 1.09 trillion tokens, far above average levels, indicating high activity on both the buy and sell sides. Although strong selling pressure appeared above $0.00002640, limiting further rises, the bulls still showed resilient strength.
📊 Trading volume data shows that there were nearly 48.86 billion token buy attempts during the 12:07 period. Although the resistance at $0.00002615 was not broken, buyers in the support range ($0.00002550-$0.00002600) have clearly increased. CoinDesk Research commented that there is high volatility and concentrated buy orders in the range of $0.00002580 to $0.00002610, indicating very ample liquidity.
From a technical perspective, BONK has encountered resistance at $0.00002640 and has repeatedly retreated, with the price likely to continue oscillating around this range in the short term. The focus for investors is: can it break through selling pressure and achieve a sustainable upward movement, or will it face a new round of selling pressure?

🔥 Summary: Although memecoins typically experience extreme volatility and higher risks, BONK currently shows active competition between buyers and sellers, with high capital activity. For friends who enjoy trading small coins, keeping an eye on breakout and retracement signals in the short term can still provide opportunities to participate.
2. XRP's golden crossover signal: the historical surge trajectory reappears; can it challenge historical highs? 📈
Next, let’s talk about XRP—this leading payment coin has recently released positive signals!
Renowned crypto analyst Ali Martinez pointed out that XRP's MVRV ratio recently broke through the 200-day moving average, forming a bullish indicator known as the 'golden crossover.' This on-chain signal has previously appeared twice, leading to explosive increases of 630% and 54% for XRP, which is simply astounding!
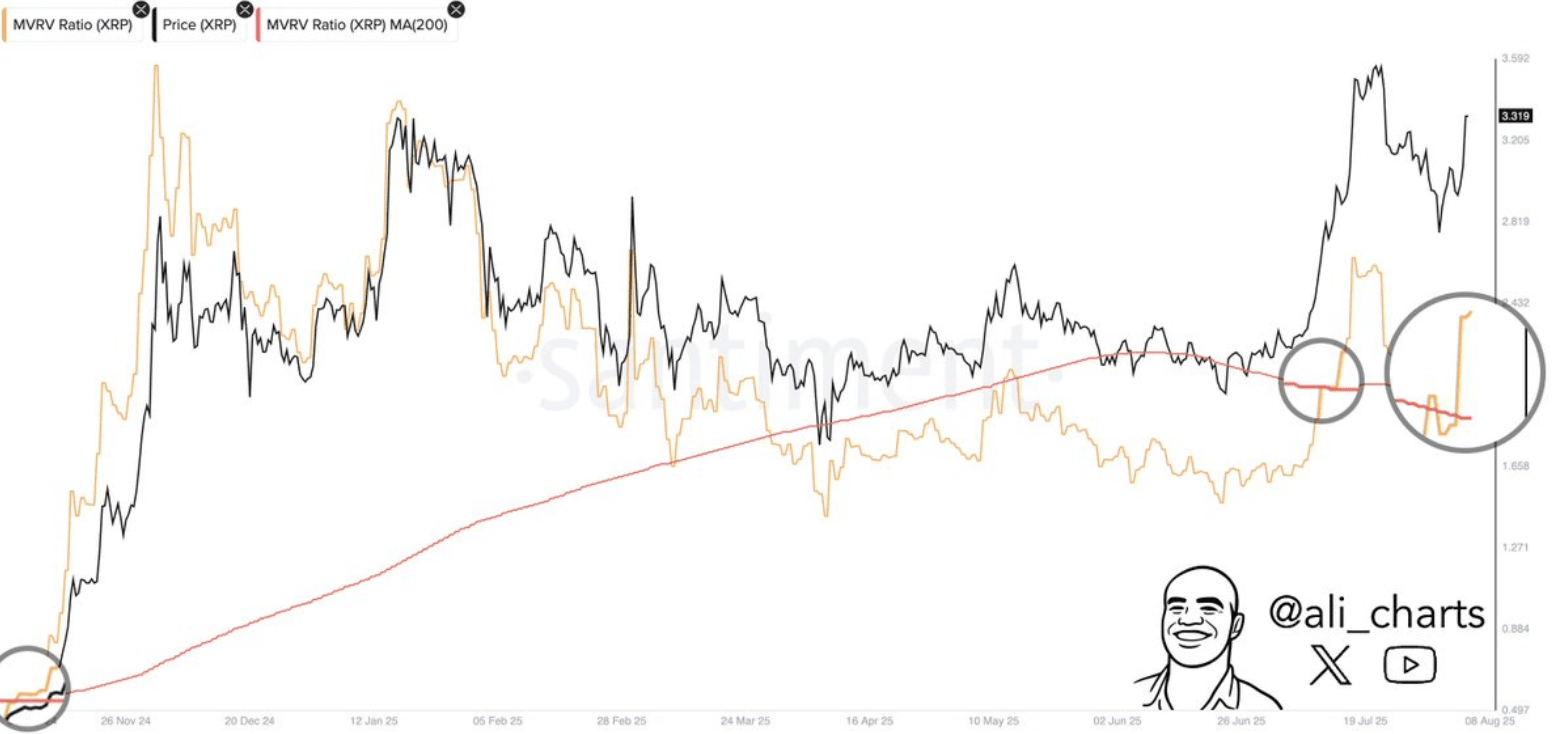
Currently, the price of XRP is approximately $3.31, while the MVRV (Market Value to Realized Value ratio) is at a critical turning point. Technical charts show that this signal has appeared for the third time in this time frame, reigniting market sentiment.
🧐 Why is this signal so important?
The MVRV ratio reflects whether holders are in profit or loss. A breakout above the 200-day moving average typically indicates enhanced bullish strength, and the price may enter a strong upward phase. Historically, the golden crossover in November 2024 directly triggered XRP's surge, eventually reaching a multi-year high of $3.39. A similar signal in July this year also led to a 54% increase, greatly boosting market confidence.
What’s even more exciting is that if this rebound continues, XRP is expected to challenge theoretical highs of $3.65 or even $24.23! Of course, this is an ideal scenario, but even conservatively estimating, the target of $5.11 would still be a record high.
⚠️ It’s worth noting that while the signals are optimistic, the market is still full of uncertainties. Investors should implement reasonable stop-loss and capital management. Meanwhile, the legal dispute between Ripple and the SEC is nearing its end, significantly reducing regulatory risks, which is also an important backdrop for XRP.
3. ETH has strongly broken through $4100, and may approach $4500 in the short term 🚀
Having discussed XRP, let’s turn our attention to the smart contract giant—Ethereum (ETH). ETH has also performed strongly recently, breaking through the key resistance level of $3,550, and currently stands above $4,100. This level has repeatedly served as a reversal point in the past, and if Ethereum can stabilize above it, the potential for further upward movement is vast.
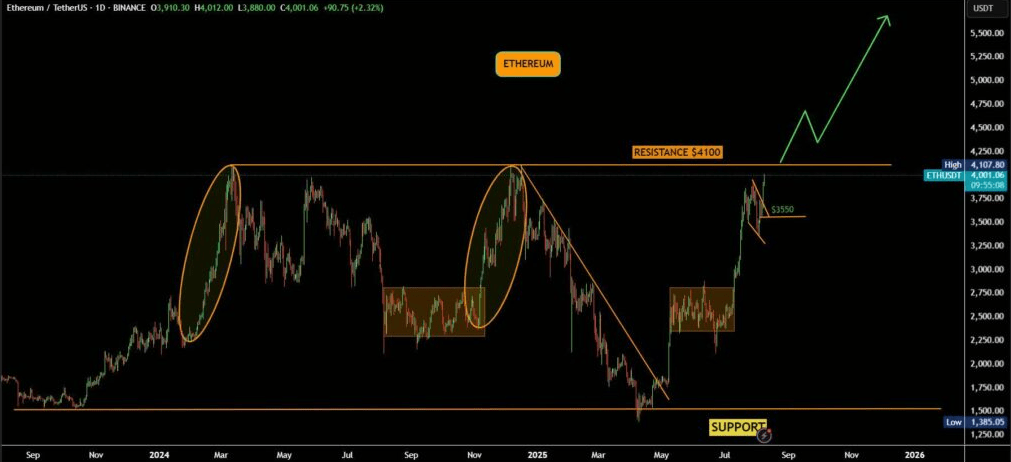
Trading data shows that ETH has risen about 6.34% in the past 24 hours, with increased trading activity and a trading volume close to 14,430. The Bollinger Bands indicator shows the price has broken above the upper band at $4,088, indicating strong buying power in the short term. However, caution is required as the RSI is close to 72, entering the overbought zone, and short-term adjustments may be faced.
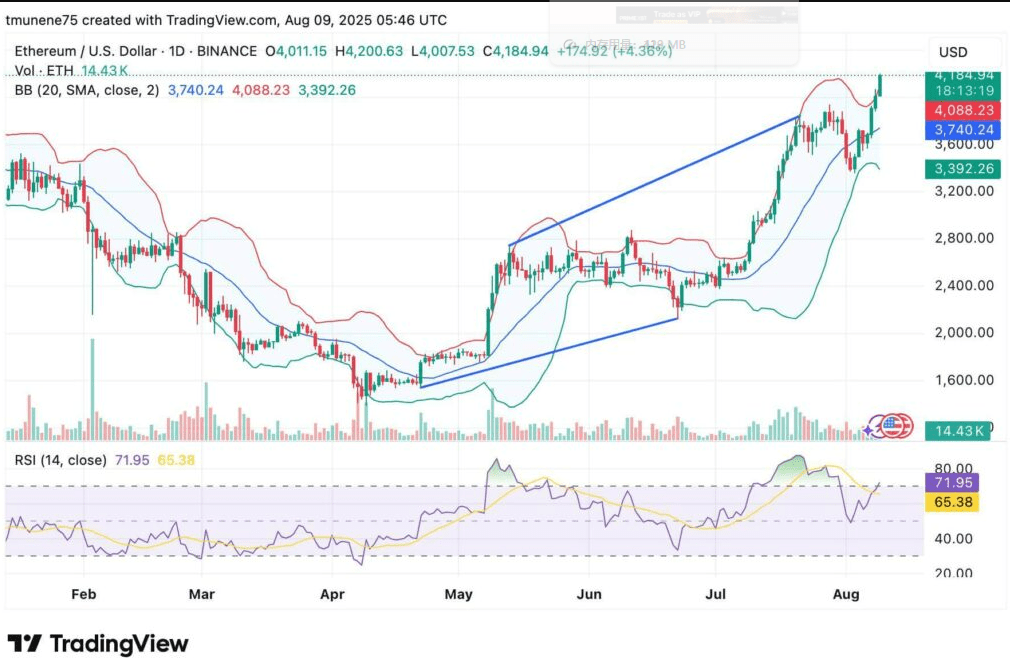
From a technical perspective, ETH has successfully broken through the previous descending wedge pattern, with evident increases in buying interest. As long as it stays above $3,550, the medium-term bullish trend remains unchanged. Analysts expect the next target stage to be $4,400-$4,500, with the possibility of challenging $4,750 and $5,200.
🛡️ Support level observation:
In the short term, if the price falls back, the 20-day moving average at $3,740 will become the first support, with deep adjustments possibly reaching $3,392, but the overall bullish pattern remains healthy.
4. Cardano (ADA) continues to rise, targeting the milestone of $1.2 💪
Cardano fans, don’t blink too quickly! ADA has surged strongly by 4.88% in the past 24 hours, with daily trading volume skyrocketing by 74%, indicating a surge in market buying.

Looking back at recent trends, ADA tested the volatility points of $0.51 and $0.937 at the end of June and the end of July respectively. Fibonacci retracement indicates that the 61.8% retracement level of $0.673 has been repeatedly validated as important support. The resistance level of $0.73 from two months ago has successfully transformed into support, further solidifying the bullish pattern.
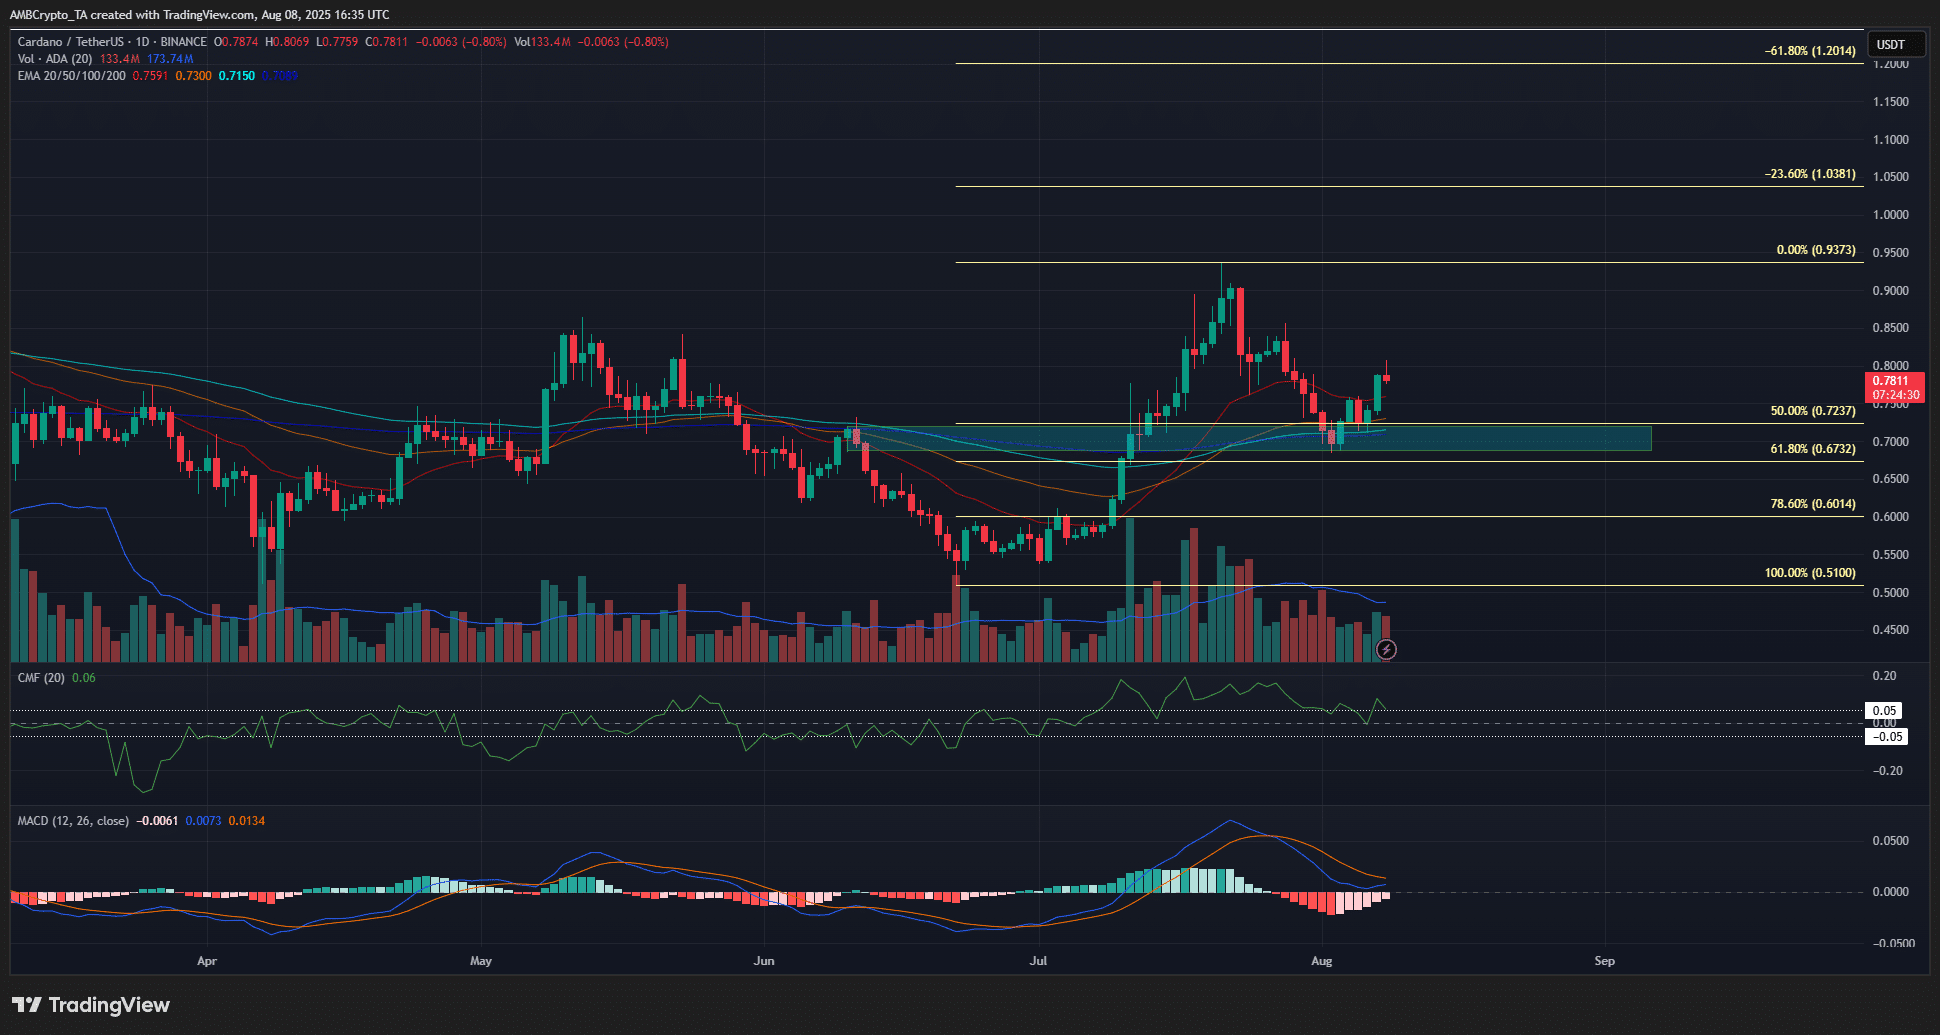
Technical indicators also performed strongly:
CMF (Chaikin Money Flow) remains at +0.06, reflecting significant buying pressure.
MACD remains above the zero line, indicating that a bullish crossover is about to form.
📈 Both the daily chart and the 4-hour chart show strong bullish signals, especially with the key resistance near $0.78 being successfully broken and turned into support, leading to active short-term buying.
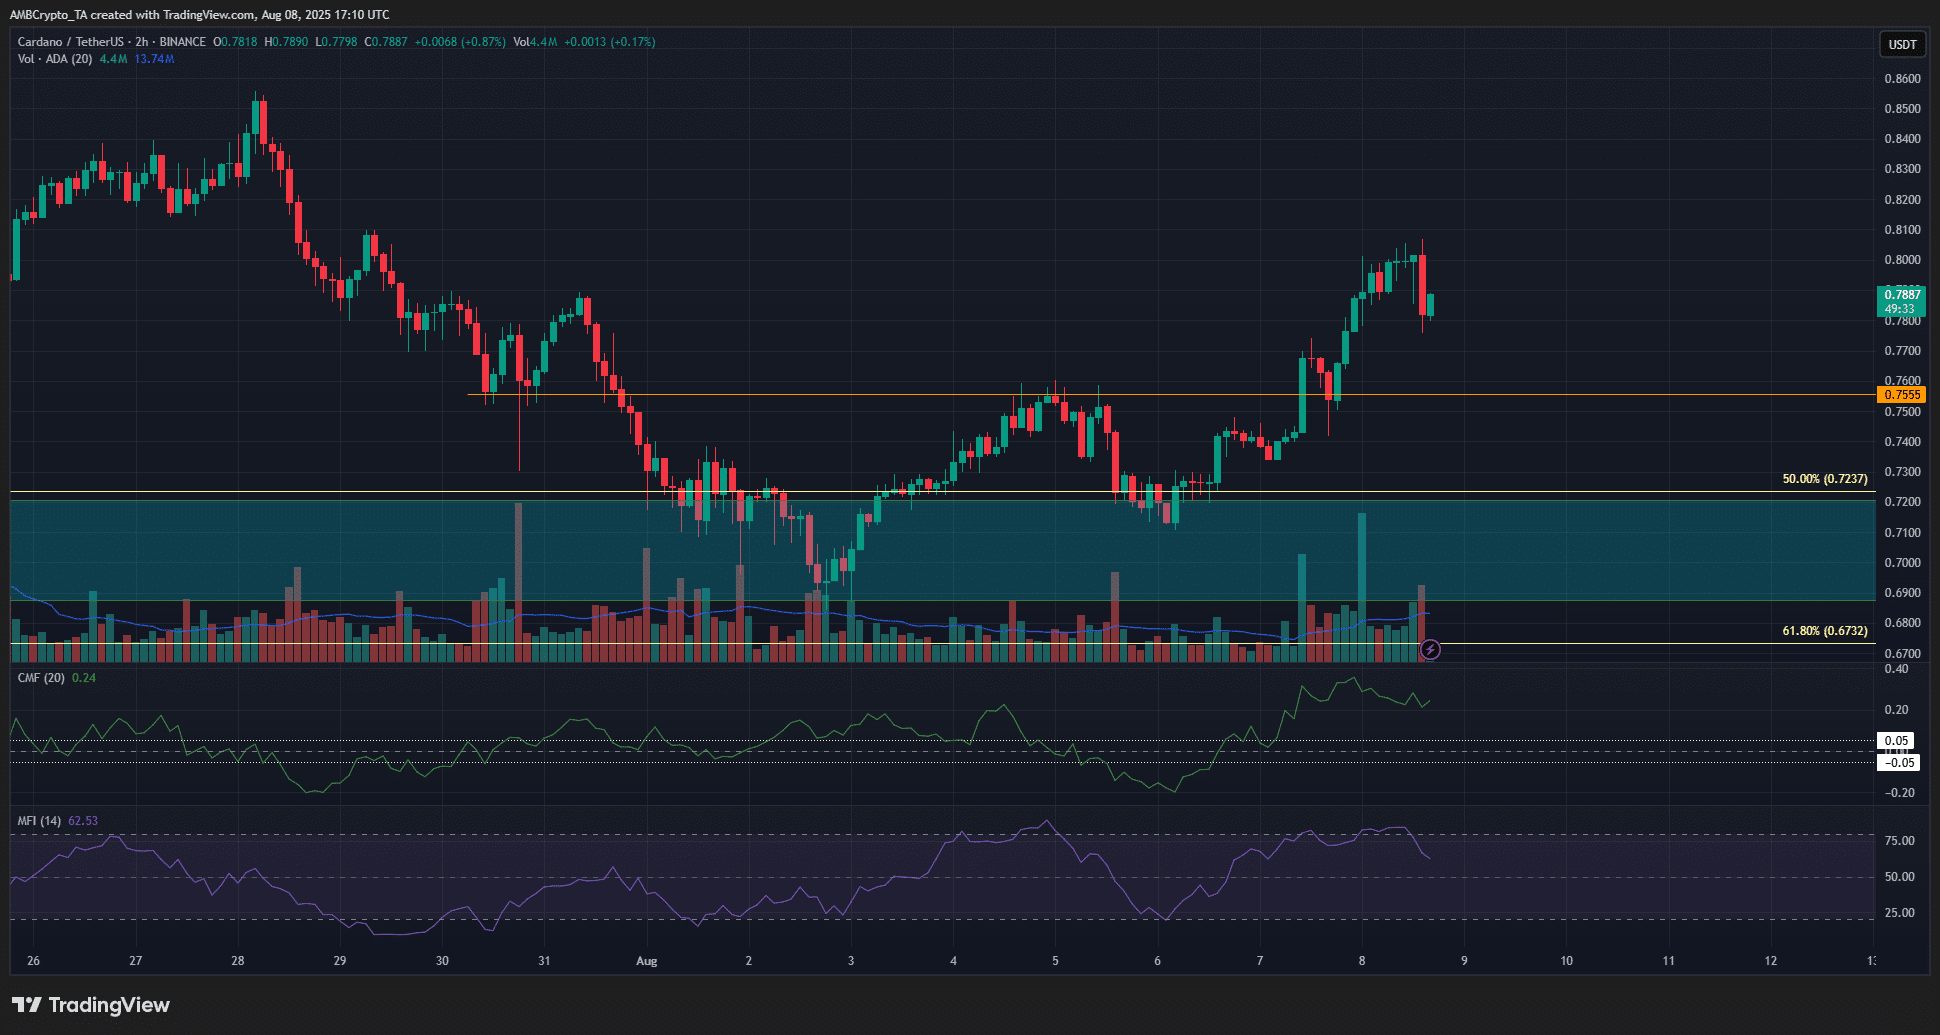
Future targets are naturally locked in at the Fibonacci extension levels of $1.03 and $1.2, and these price levels are highly aligned with the historical strong resistance lines from November to December 2024, indicating that if market sentiment continues, ADA is likely to welcome a new round of breakthroughs.
5. TRUM: Rebounds from the demand zone, bullish signals are clear; can it challenge $15? 🔥
Finally, let’s take a look at the much-watched TRUMP coin. Recently, TRUMP completed a strong rebound near the critical demand zone of $7.20 to $7.80, showing clear bullish reversal signs. The price is steadily climbing and facing challenges from two major resistance levels.
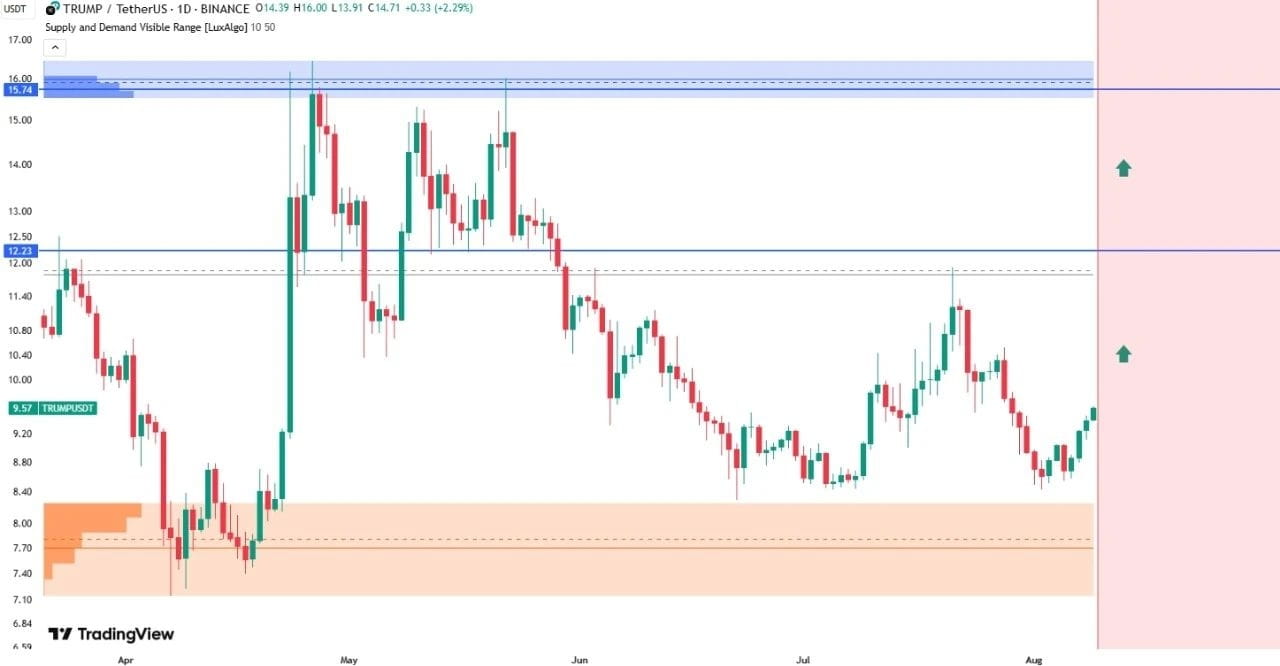
Demand zone: $7.20 - $7.80, the repeatedly held support zone has propelled the current bullish trend.
The first major resistance level: $12.23; once broken, the upward trend may accelerate quickly.
Supply zone: $15.00 - $15.74, a historical selling pressure concentration area, increasing the risk of seller intervention.
Currently, TRUMP's price is in the medium-term bullish zone above $8, and breaking $12.23 will be the key to starting the next wave of market action. If it fails to break through, the price may retreat to $9.50 or even the demand zone, waiting to test buying pressure again.
💎 Overall, TRUMP's trend is full of hope, leaning towards bullish in the medium term. Market participants can closely monitor the dynamics of these two resistance levels, manage positions effectively, and seize potential upward opportunities.
Conclusion: Market enthusiasm remains, with opportunities and challenges coexisting. Risk control and flexible operations are essential!
From BONK's high-frequency oscillation to XRP's on-chain golden crossover signal, from Ethereum's strong breakout to Cardano's steady rise, and to TRUMPUSDT's rebound in the demand zone, the entire crypto market is filled with passion and variables. Every coin has its unique technological and financial flow logic behind it, and investors need to respond flexibly by combining technical analysis, on-chain data, and market sentiment.
⚠️ Small advice:
Short-term traders should seize the breakout signals of BONK and TRUMPUSDT, and take profits and stop losses in a timely manner;
Medium to long-term investors should focus on structural opportunities in XRP and Ethereum, adjusting positions based on market regulation and macro dynamics;
Cardano is also a good time to intervene, especially after confirming support from the bulls, as it’s possible to wait for further rises.
The rhythm of the crypto market is always fluctuating, but it is precisely this volatility that nurtures enormous profit potential. Stay alert and respond flexibly to laugh through the digital asset feast!
Many understand the trend, but few follow the right rhythm.
The crypto market changes quickly, with opportunities and risks coexisting. Learning to enter and exit strategically, and protecting the principal, is key to progressing steadily and reaping wealth and growth. ✍️
Remember to DYOR, manage risk well, and wish everyone a smooth sailing in the crypto world! 🌊
Like👍 and share, follow me to capture more market hotspots, and accompany you in watching the ups and downs of bulls and bears! Let’s keep pushing forward!