Do you want to make big money through trend trading? You actually don’t need to stare at the market until late at night, nor do you need to study complex indicators—just one trend line can help you accurately catch the turning point of the market. Today, I will break down this 'trend line breakout entry method' and teach you in 3 steps how to extract real trends from fluctuations; missing it could lead to big losses!
① First understand the 'breakout signal': It’s not enough to chase just because it broke; the pullback test is key.
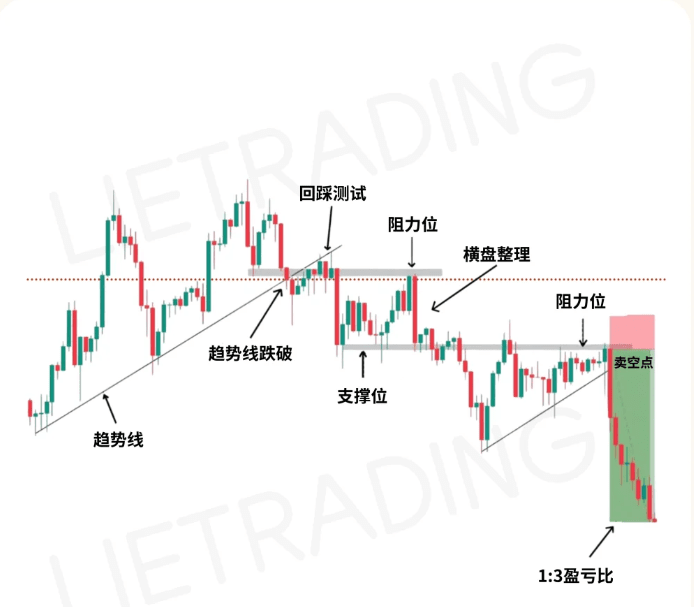
The core function of the trend line is to help you see the market's 'inertia direction.' But just breaking the line is not enough; you need to look at the 'pullback after the breakout':
In an upward trend, when the price breaks above the trend line and does not fall below it on the pullback, it indicates that the bullish strength is strong, which is a signal to increase positions;
In a downward trend, when the price breaks below the trend line and then bounces back to touch the line before coming down again, it indicates that the bearish strength is still dominant, allowing for short positions.
Key logic: Trend reversals do not happen overnight; pullback tests are like 'shifting gears in a car,' requiring a brief pause before accelerating—skipping this step makes it easy to chase at the 'false breakout' high point.
② 3 iron rules to filter out false breakouts, directly increasing the win rate by 50% (a must-read for beginners).
Why do some people always get caught by 'false breakouts'? Because they haven't thoroughly understood these 3 details:
Only solid breakthroughs count: The 'real part' of the candlestick (the closing price to the opening price) must stabilize outside the trend line; simply piercing the shadow does not count. For example, in an upward breakout, the closing price must close above the trend line, otherwise it is just 'a feint';
Volume must follow: The trading volume during a breakout should be at least 30% higher than usual, indicating that real money is coming into the market, not just the main force intentionally 'drawing candlesticks';
Look at 2 candlesticks on the daily level: A single candlestick breakout may be a 'spike'; only when two consecutive daily candlesticks stabilize on both sides of the trend line can it be considered a genuine trend change (for short-term traders, the same applies to the 4-hour chart, with at least 2 candlesticks for confirmation).
For example: If BTC breaks the trend line at $110,000 and closes with a long upper shadow candlestick on the same day, with no increase in volume, and then falls back below the line the next day—this is a typical false breakout, entering here will definitely lead to losses.
③ Entry + Risk Control Combo: Earn more when making profits, lose less when losing.
After confirming the breakout signal, entry and risk control must be done simultaneously:
Entry point: Enter when the price pulls back to the trend line, which is safer and costs less than chasing the breakout price directly;
Stop-loss position: Place it outside the 'extreme point' before the breakout, for example, in an upward breakout, set the stop-loss below the lowest point of the pullback to ensure that if wrong, losses can be controlled within 5%;
Risk-reward ratio: At least aim for 1:3—if the stop-loss is set at 50 points, then the take-profit should be above 150 points, so even if you win 1 out of 3 times, you will still make a profit overall.
Don’t always think about 'buying at the lowest and selling at the highest,' trend trading profits come from 'profits in the middle section.' It’s like taking a train; you don’t have to rush to catch the first station, as long as you get on at the right direction, you can still reach the destination.
Lastly, highlight this: The essence of a trend line is the 'market consensus line.'
An effective trend line is backed by countless traders' 'psychological expectations'—everyone makes decisions based on this line, and it becomes more and more agile. But remember: **Trend lines are not set in stone**; when the market accelerates, adjust the angle of the line in time, otherwise you will miss the opportunity for 'trend strengthening.'
Try using this method to review the recent market; you will find that those big trends you missed actually already provided signals with trend lines.
How do you usually draw trend lines? Have you ever been caught by a false breakout? Let’s discuss in the comments and avoid pitfalls together~
#比特币流动性危机 #美联储比特币储备 #特朗普允许401(k)投资加密货币 #美SEC批准流动性质押 #ETH巨鲸增持
Keep an eye on ASR BIO A2Z BB ILV OMNI.