

Bitcoin is trading in the range of $113,561 to $113,800 over the past hour with a market cap of $2.26 trillion. In the last 24 hours, it recorded a trading volume of $49.17 billion and a daily price range from $112,680 to $115,899, revealing high volatility and uncertainty in the short-term trend.
Bitcoin
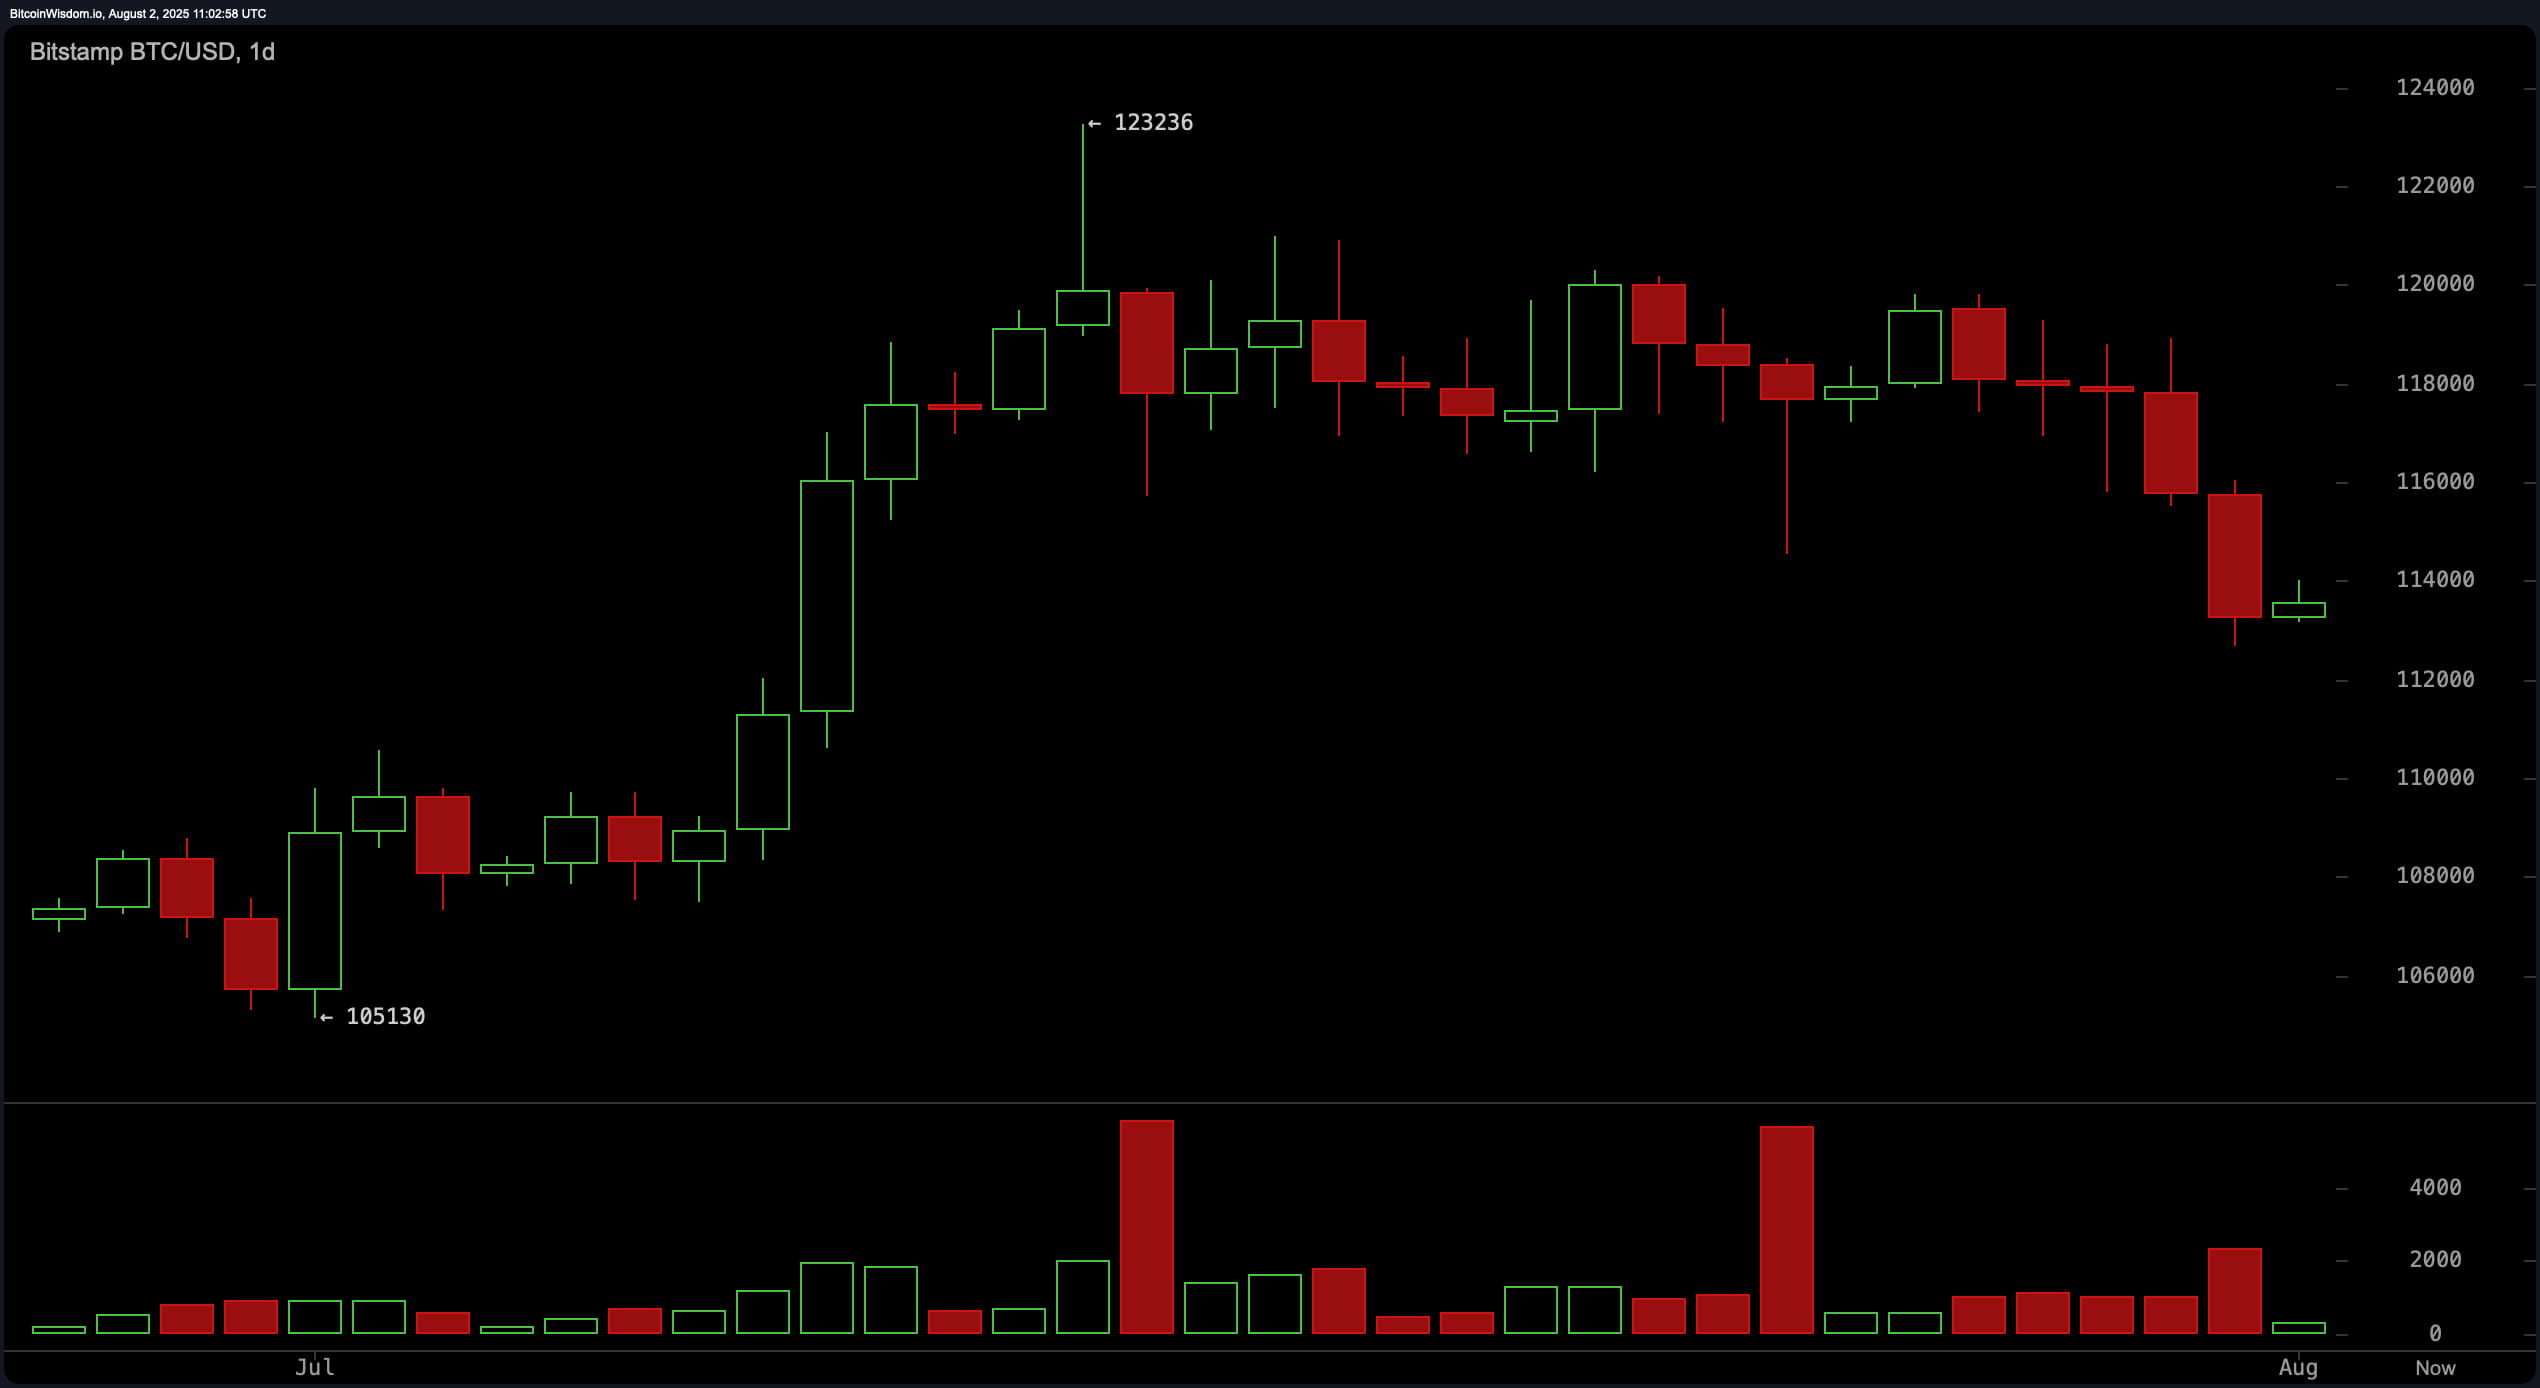
A detailed assessment of the daily chart shows Bitcoin's recent decline from a high of around $123,236, indicating a short-term bearish trend. Strong selling near the top suggests a distribution phase, with clearly defined resistance from $118,000 to $120,000. The price has recently found support in the $112,680 to $113,000 range, where there have previously been high-volume bounces. If the price returns to this area and selling pressure decreases, it could open up an optimistic re-entry point. However, if it fails to reclaim territory above $117,000 with new volume, it will reinforce a bearish sentiment and signal an opportunity exit.
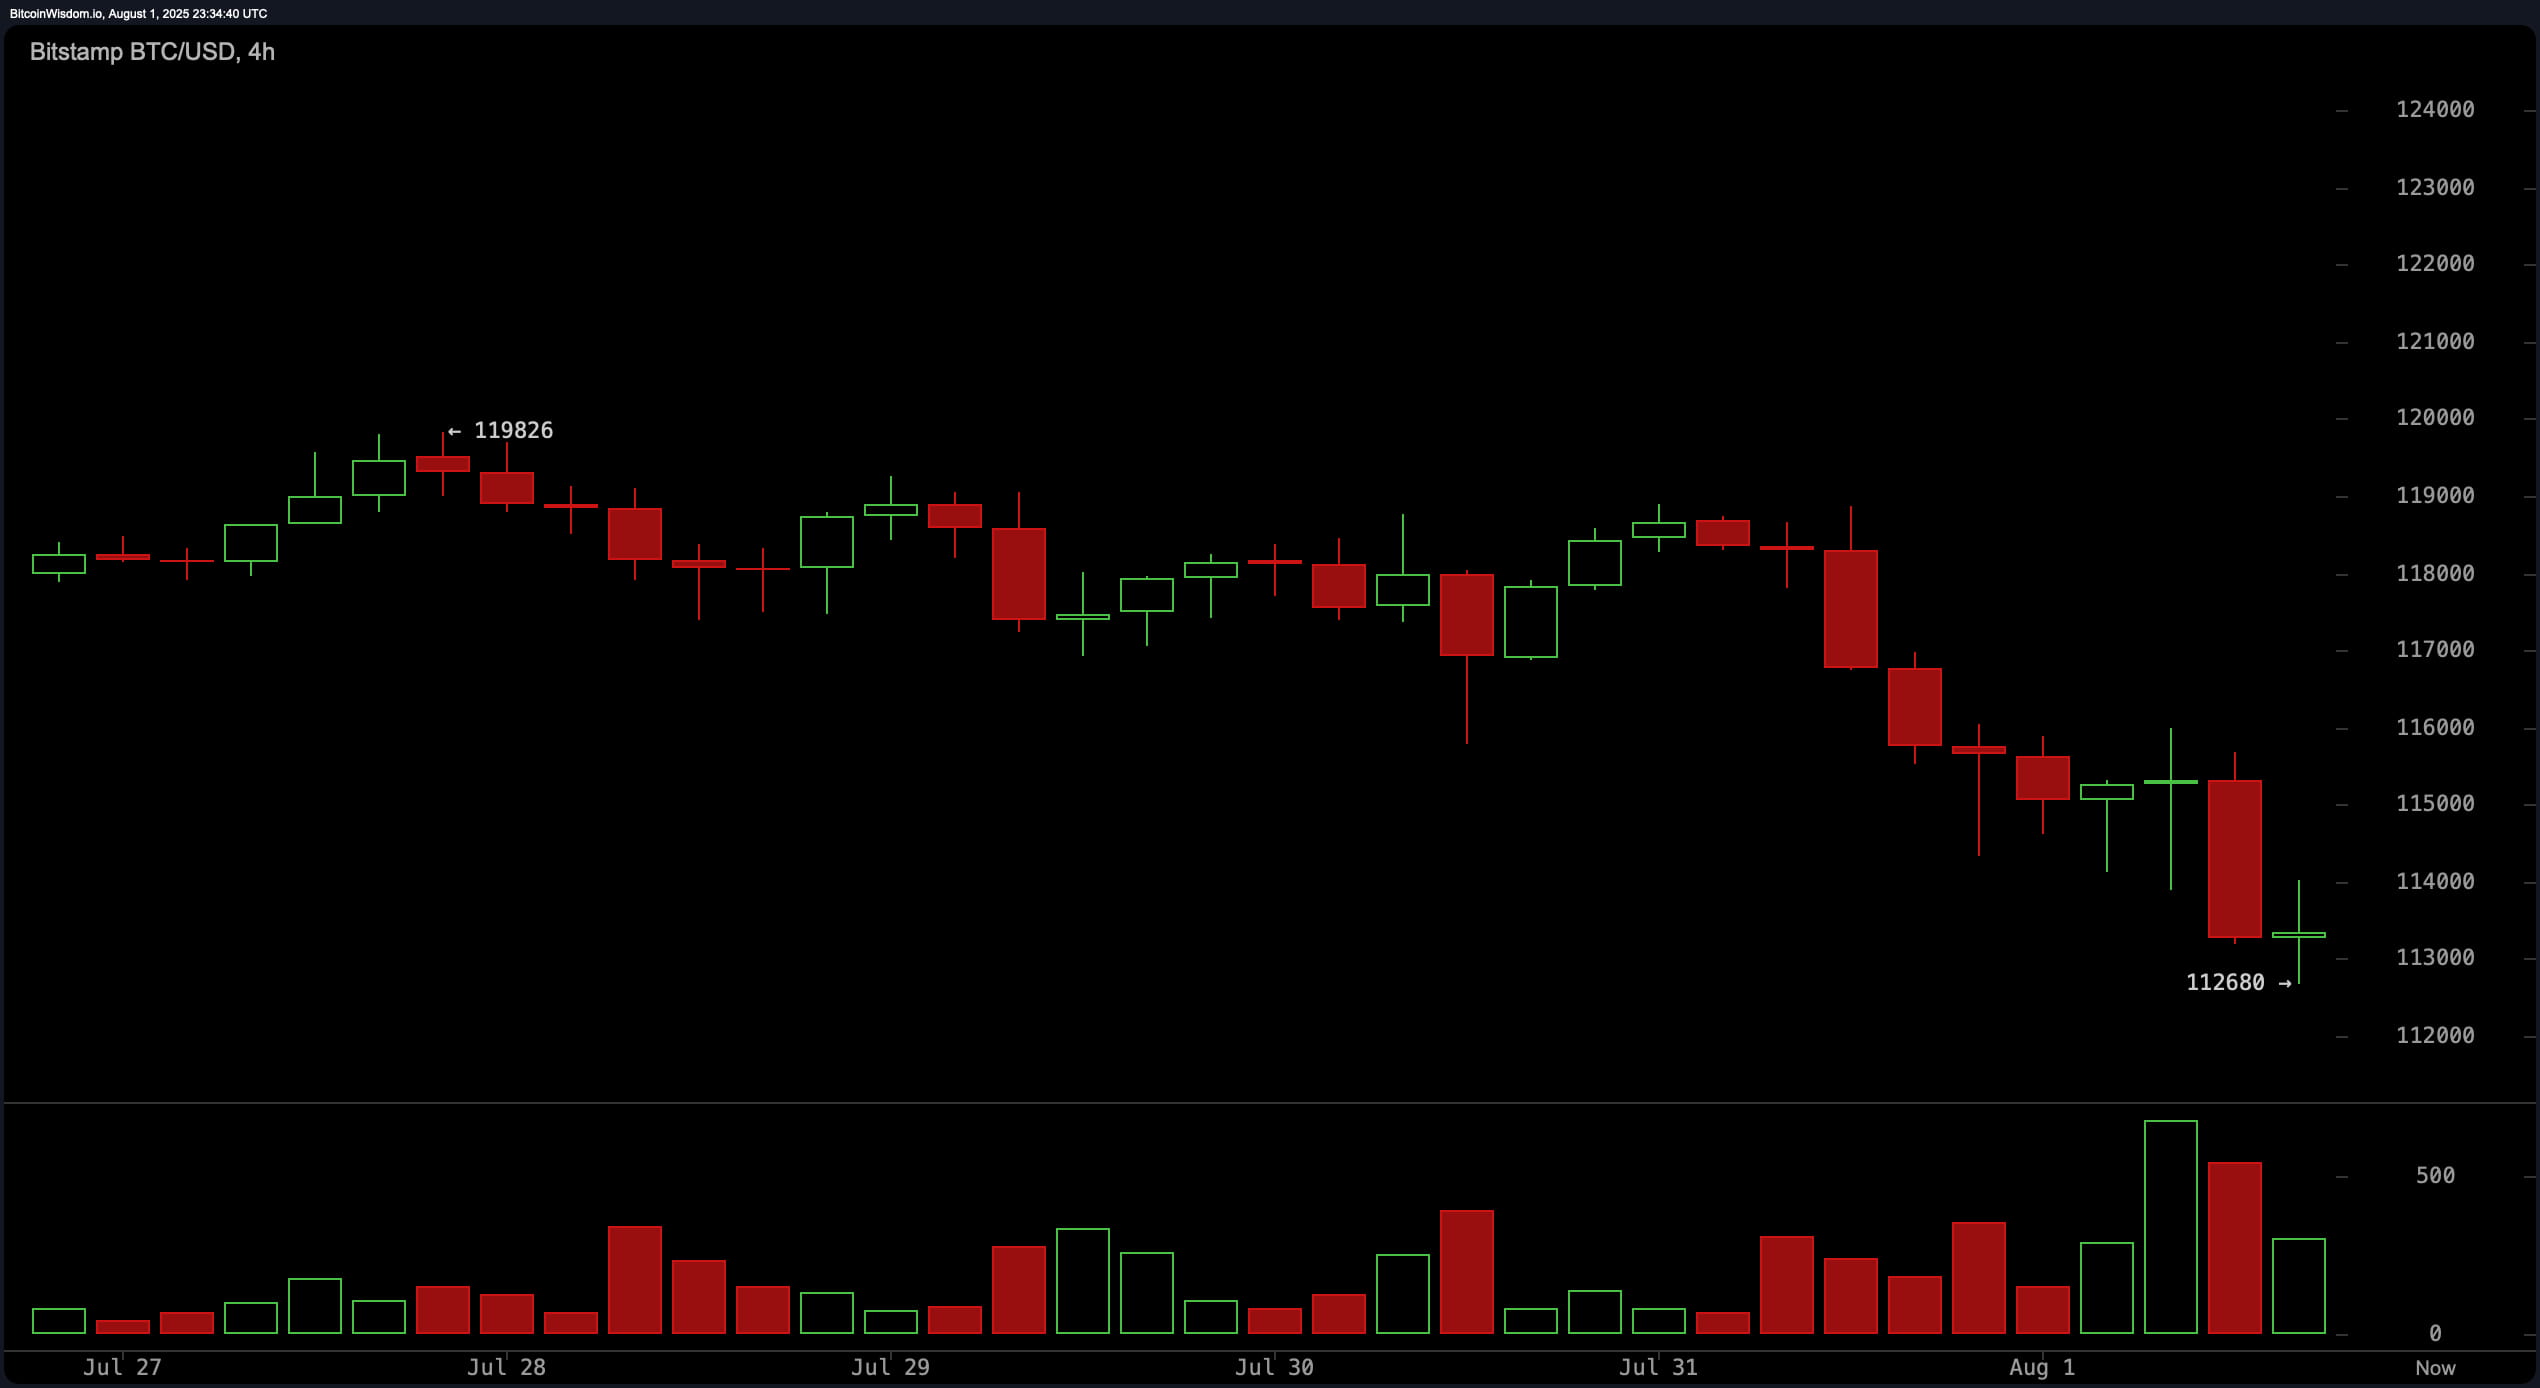
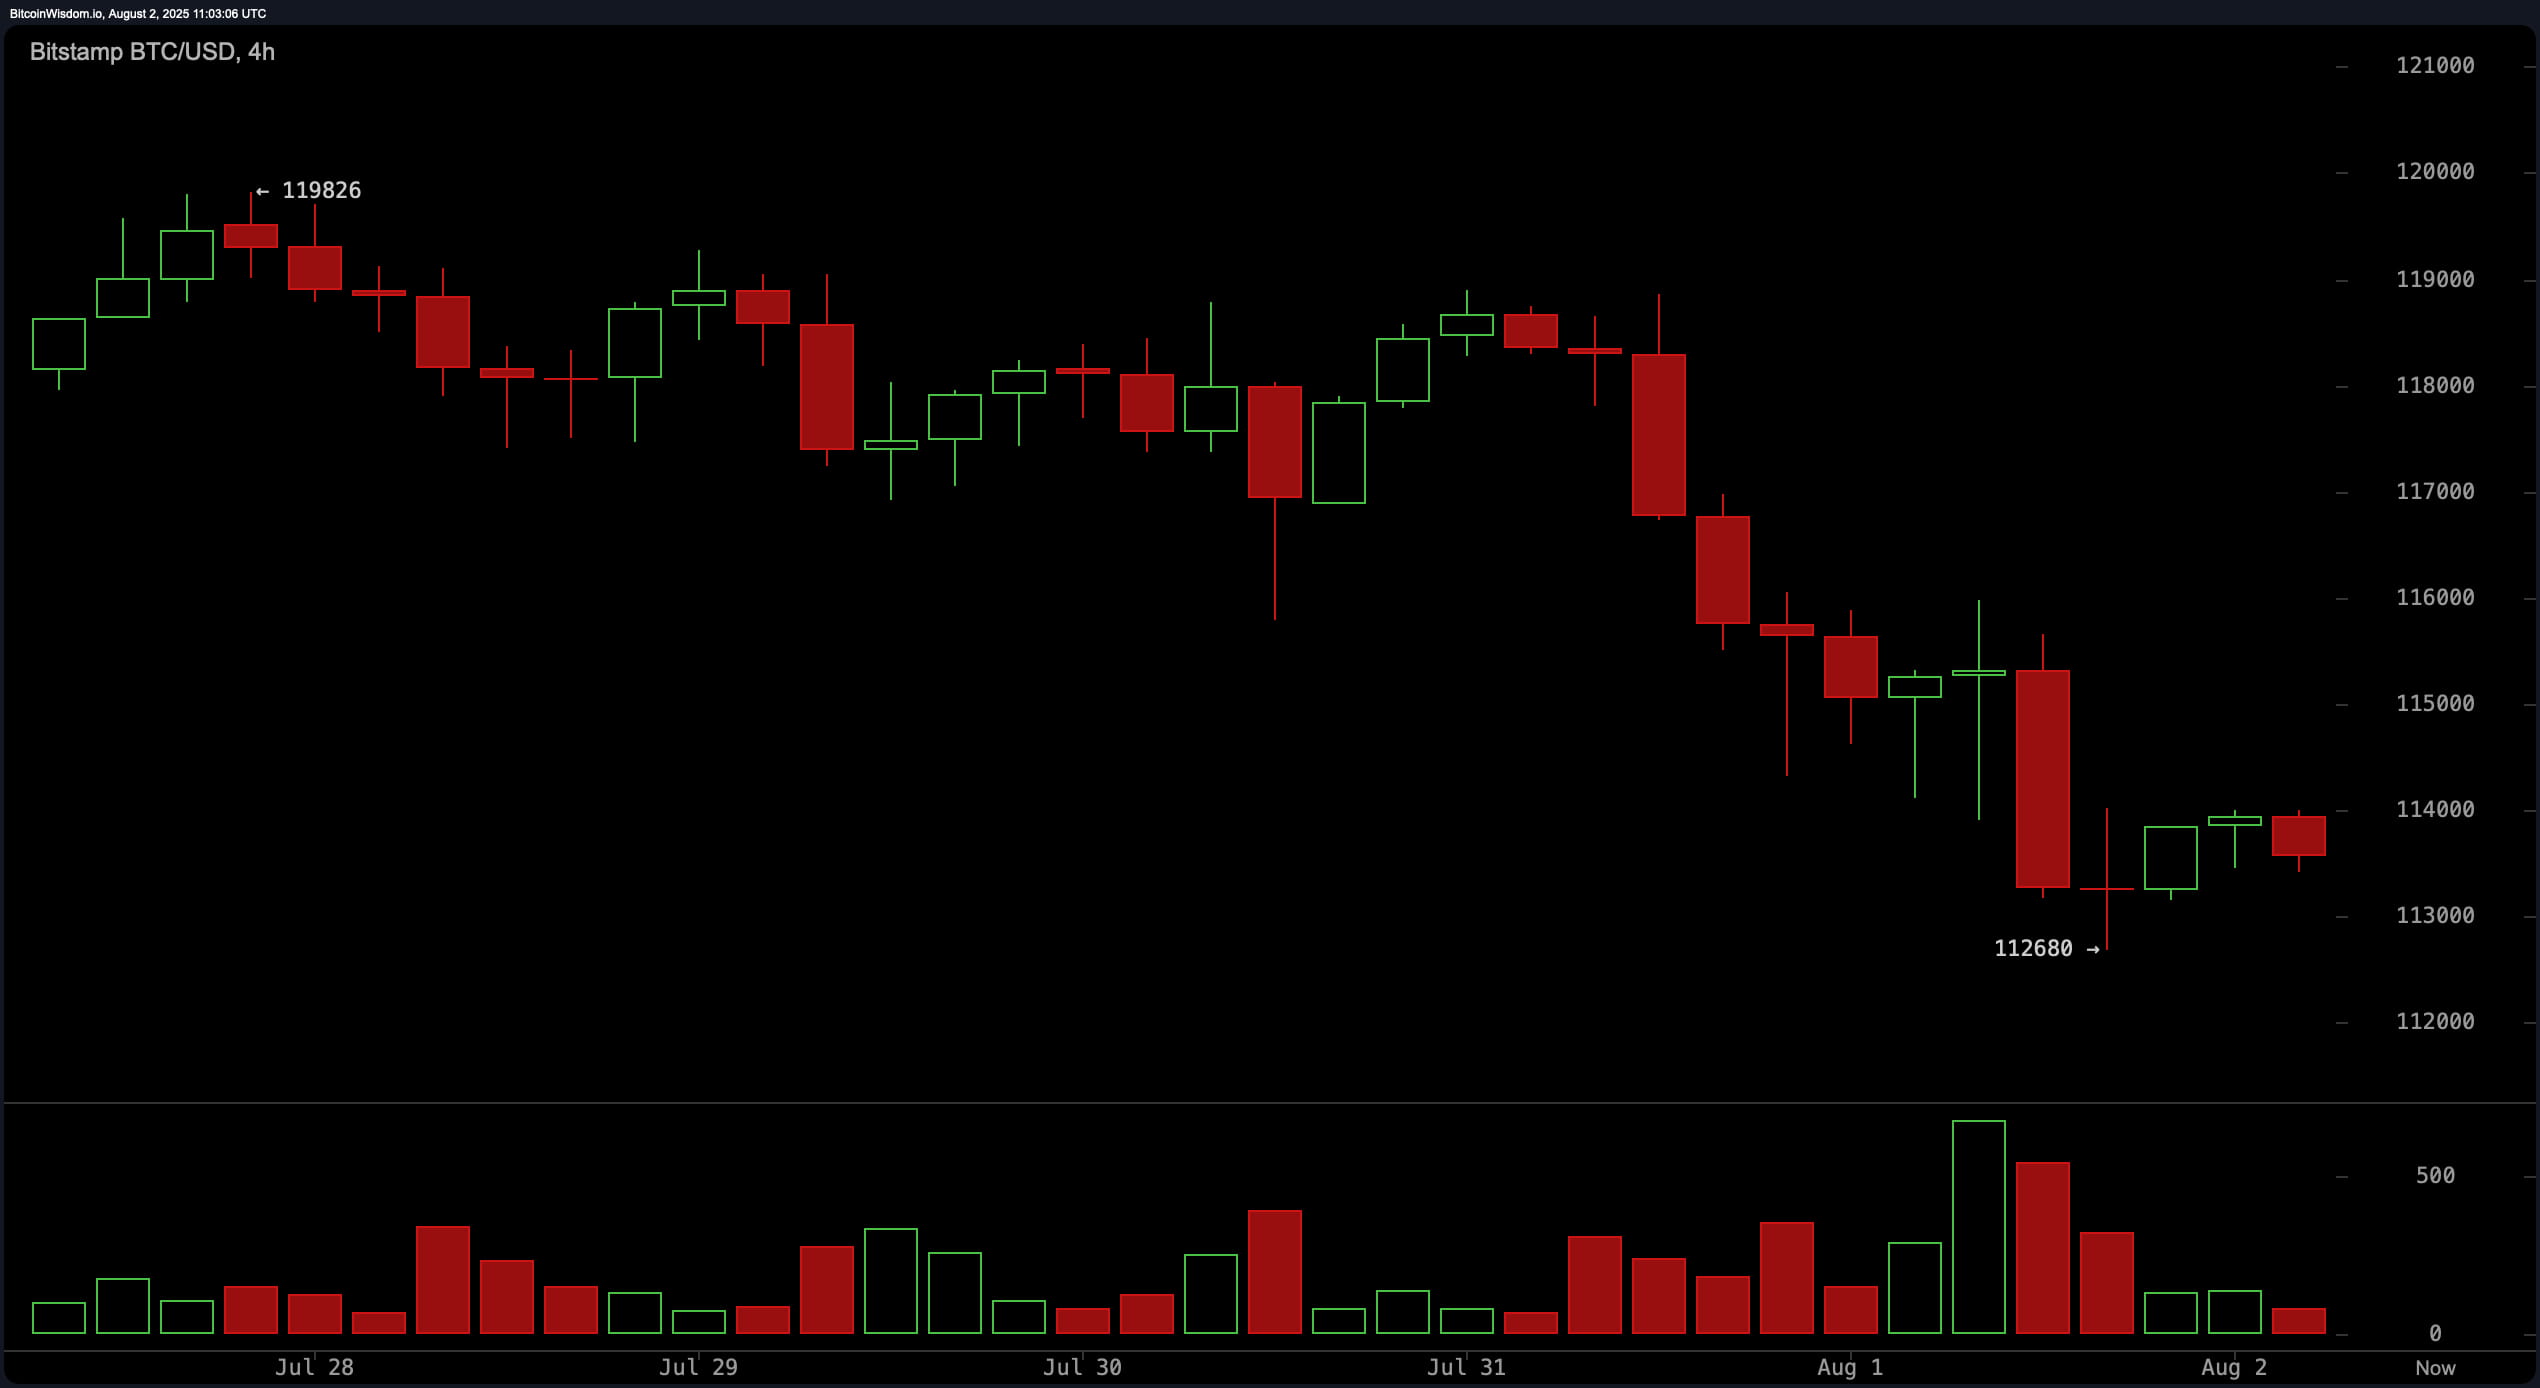
On the 4-hour chart, Bitcoin shows clear bearish momentum, highlighted by the appearance of engulfing bearish candles. The price has reached a support floor at $112,680, but recovery efforts are weak, characterized by low volume green candles. The market seems to be entering a potential accumulation zone from $112,500 to $114,500. A decisive breakout above this range with strong volume could initiate a short squeeze targeting $116,000, while a drop below $112,500 would confirm continued bearish momentum.
The BTC/USD 1-hour chart confirms a micro structure of lower highs and lower lows, reinforcing the current short-term bearish trend. Despite a slight bounce from the $112,680 level, volume remains inadequate, and candle patterns lack conviction. Immediate resistance lies between $114,200 and $114,500. A clear breakout above this level could trigger a short-term bullish move, but failing to hold above $113,000 poses a risk of increasing downward pressure.
Oscillators show mixed signals. The Relative Strength Index (RSI) is at a neutral 43, while the Stochastic is at 13, also reflecting neutrality. The Commodity Channel Index (CCI) is at -265 and momentum is at -5,256 both indicating potential bullish conditions, in contrast to the varying convergence of the Moving Average Convergence Divergence (MACD) at 730, suggesting a bearish signal. The Average Directional Index (ADX) at 21 points to a weak trend, and the Awesome Oscillator at 1,172 remains neutral. These indicators show market indecisiveness, with possibilities set up in both directions depending on volume and breakout confirmation.
Moving averages reflect a short-term bearish attitude and a long-term bullish trend. The exponential moving averages (EMAs) and simple moving averages (SMAs) in the 10-, 20-, and 30-periods all indicate bearish signals, with values above the current price. Conversely, the EMAs and SMAs in the 50-, 100-, and 200-periods lie below the current price and suggest bullish signals. This divergence indicates a transitional phase where long-term investors remain optimistic, while short-term traders react to recent price weakness. Trading positions near support or resistance levels with volume confirmation remain crucial for risk management in the current environment.
Bullish Assessment:
If Bitcoin maintains support above $112,500 and the volume gradually decreases under selling pressure, there is potential for a bullish reversal up to $116,000 and may retest resistance at $118,000. Continued strength in the 50-, 100-, and 200-period moving averages will support a long-term bullish outlook, provided that short-term accumulation resolves upward.
Bearish Assessment:
If Bitcoin cannot hold the support at $112,500 and faces rejection near $114,500, the bearish trend is likely to accelerate with a target drop near $110,000. The current weakness in short-term momentum, confirmed by sell signals at key moving averages and negligible buying interest, emphasizes a high-risk environment for bullish entry points.


