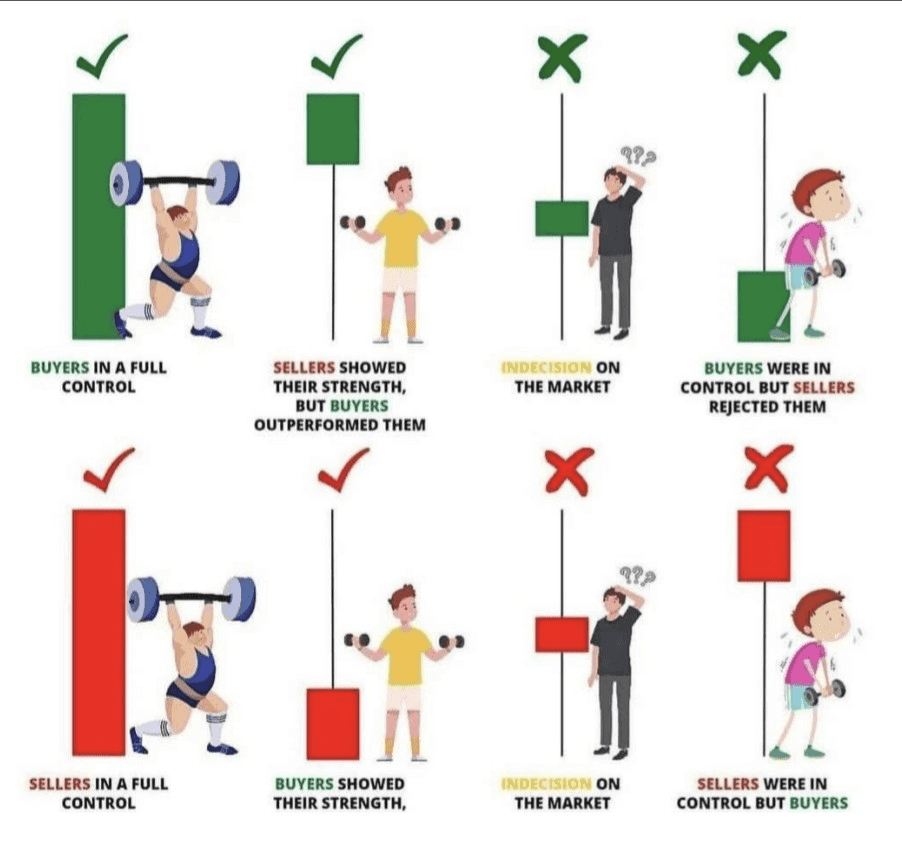
👈Top row (from left to right):
1. ✅ Buyers in full control: 🟩 Large green candle - Strong bullish momentum, buyers dominated the session.
2. ✅ Sellers showed strength, but buyers prevailed 🟩 Long lower wick - Sellers pushed the price down but buyers recovered and closed higher.
3. ❌ Market indecision 🟫 Doji candle - Equal pressure from buyers and sellers, showing market uncertainty.
4. ✅ Buyers were in control but sellers rejected them 🟩 Long upper wick - Buyers pushed the price up, but sellers forced a lower close.
👈Bottom row (from left to right):
1. ✅ Sellers in full control 🟥 Large red candle - Strong bearish momentum, sellers dominated the session.
2. ✅ Buyers showed their strength 🟥 Long lower wick - Buyers tried to fight back after sellers pushed the price down.
3. ❌ Market indecision 🟧 Small body candle with wicks - Uncertainty; no clear winner between buyers and sellers.
4. ❌ Sellers were in control but buyers rejected them 🟥 Long lower wick - Sellers pushed the price down but buyers regained ground before the close.
💡 Summary:
✔️ Long candles = Clear strength
❌ Doji = Indecision
✔️ Wicks = Rejection or Retracement
This chart helps you read the emotions behind the candles 🧠🔥
Here is a candle picture 👇
If you found this post helpful, please follow, like, and comment on it, thank you 👍
🎁Don't forget to visit my profile for free coins🎁 through the pinned post (first and second) at the top of the page.
#IPOWave #NOTCOİN #BuiltonSolayer #BTCUnbound #CFTCCryptoSprint
