According to data from CryptoQuant, Ethereum's Net Taker Volume has plummeted to -$418.8 million – marking the second-largest imbalance favoring sellers ever recorded in a day.
This means that more than 116,000 ETH have been sold more than bought in just one day. Historically, such strong sell-offs often signal a local peak, acting as a reversal signal.
However, ETH is still trading around $3,643, indicating that buyers are absorbing selling pressure — at least at the current moment.
If the support level continues to hold, ETH may stabilize before taking its next step. Currently, the market remains divided on the outlook: should we expect a continuation of the uptrend or an impending correction?
Is ETH’s bullish structure breaking down below the resistance zone?
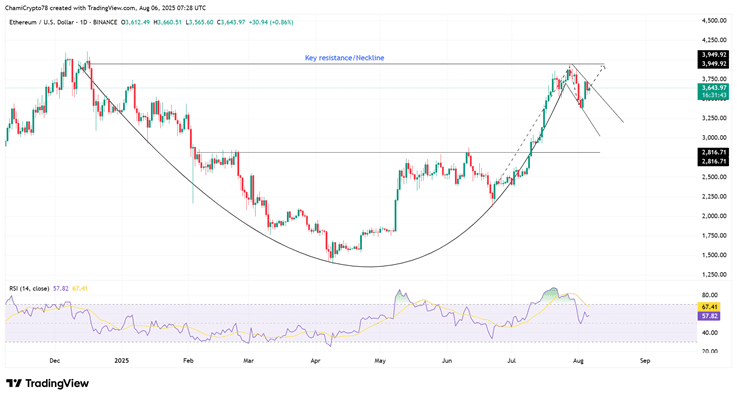
Ethereum recently completed the cup and handle pattern — a classic signal for the potential continuation of an uptrend.
However, the price cannot break through the resistance zone at $3,950 (the neckline) and is currently accumulating in a descending channel.
The RSI is at 57, indicating neutral momentum, with no clear breakout pressure. Failure to rise above key resistance levels could invalidate the pattern if the bulls do not regain control soon.
Therefore, ETH must quickly break above the $3,950 mark to maintain its bullish structure. If rejected at this level, the price could continue to correct deeper towards lower support levels.
Will on-chain growth help ETH resist bearish signals?
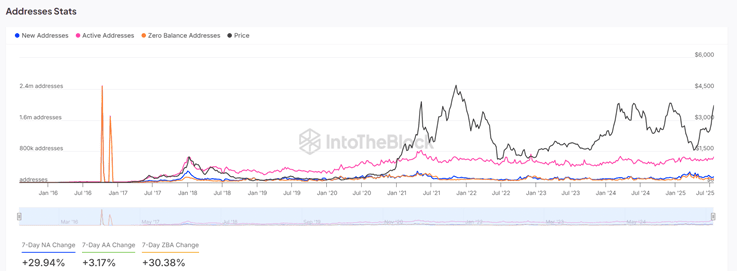
Despite the market's bearish pressure, Ethereum's network activity is on the rise. According to data from IntoTheBlock, the number of new addresses increased by 29.94%, while active addresses rose by 3.17%.
Historically, the increase in the number of addresses is often a solid foundation for price stability and recovery.
Therefore, the divergence between price action and current on-chain indicators may be a sign of underlying strength in the market.
If user activity continues to remain high, ETH could very well hold support and bounce back, even as selling pressure continues to test buyers' expectations.
Do long-term holders still trust ETH's valuation?
On-chain valuation indicators are showing a rather complex picture.
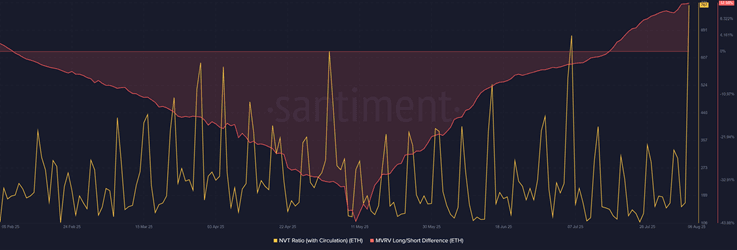
The NVT ratio (based on circulation) has surged, indicating that Ethereum's market cap is growing faster than transaction activity. This often implies that ETH is overvalued in the short term.
However, the Long/Short Difference MVRV indicator remains above 12.36%, meaning long-term investors are still holding onto a significant amount of unrealized profits.
This reflects strong confidence from experienced investors, despite recent weaknesses in the market. While there is still a risk of profit-taking, the ongoing commitment from long-term holders is providing a solid buffer for the price.
Thus, if long-term investors continue to hold their ground, ETH may maintain strength and soon retest the $3,950 resistance zone with renewed momentum.
Can the bulls regain control?
In summary, Ethereum faces a significant challenge as record selling pressure collides with improving on-chain signals and strong confidence from long-term holders.
The price needs to surpass the $3,950 mark to confirm a bullish breakout. However, the increase in address activity and support from long-term investors may help ETH maintain stability.
In the coming days, the market will show whether buyers can push ETH higher or whether recent sell-offs will trigger a deeper correction.
Until then, ETH is at a crucial pivot point between support and resistance.